Employment growth continues slowly
Each year at the end of January, the U.S. Bureau of Labor Statistics updates its monthly seasonal factors and revises its nonfarm payroll employment numbers. This year, the revised employment numbers indicate that job growth in the United States may have been stronger than previously estimated. Chart 1 below shows monthly nonfarm employment from January 2010 through December 2012 before and after the latest revisions.
1. U.S. nonfarm payrolls in thousands
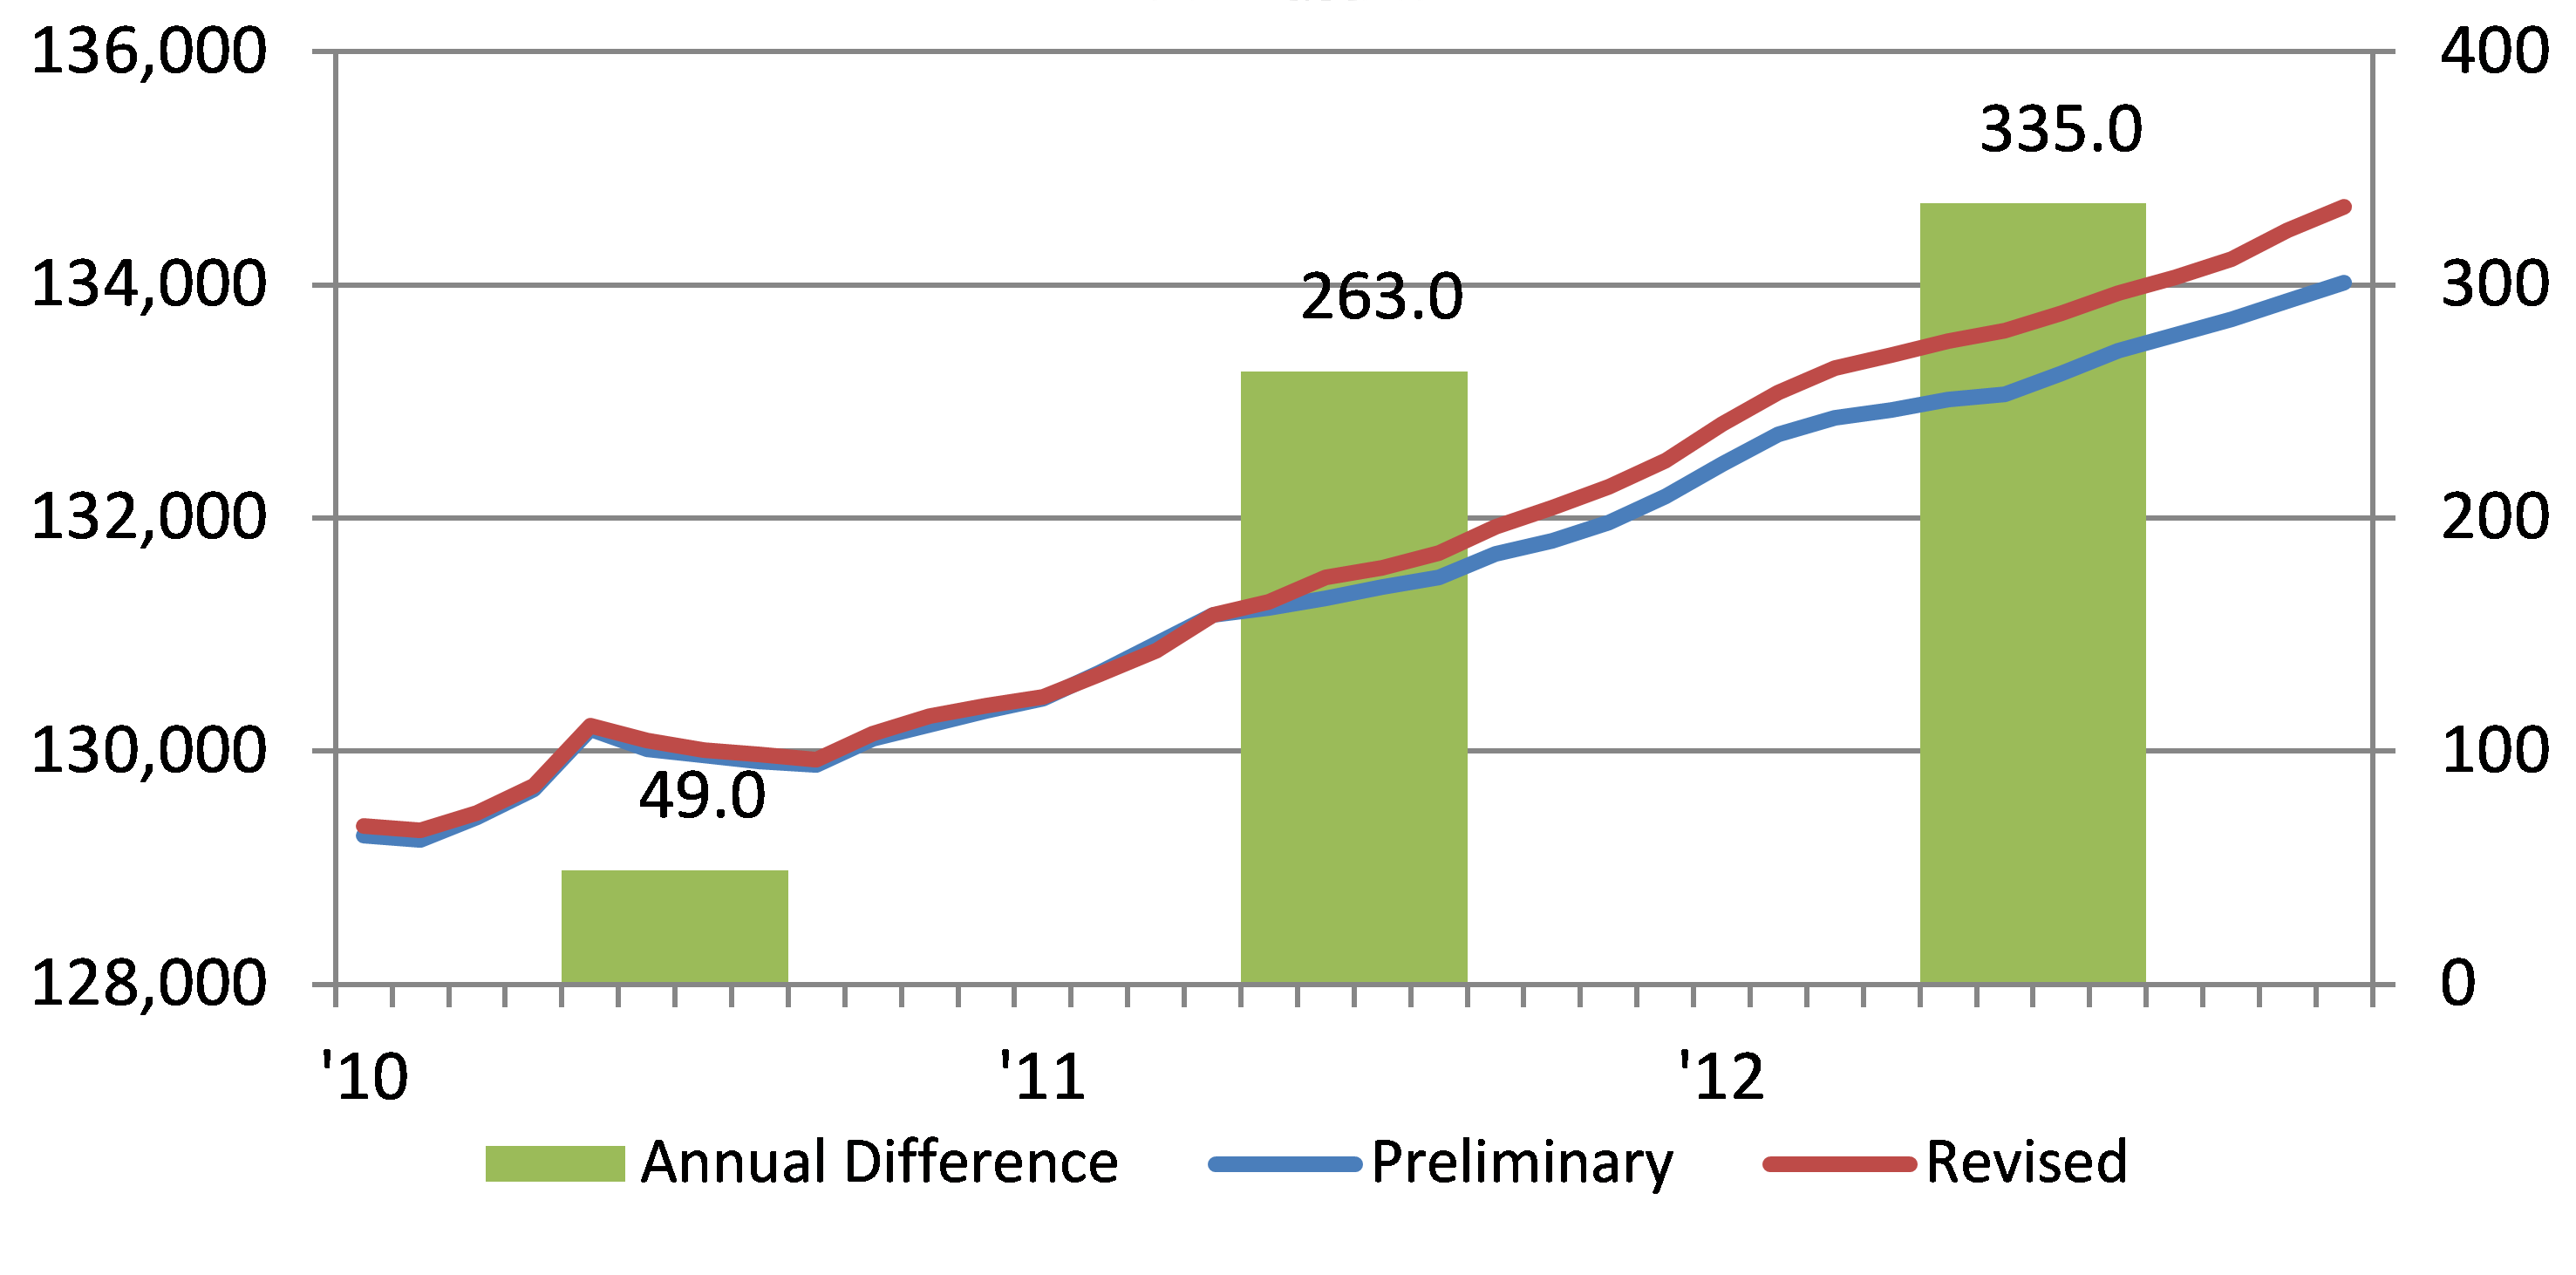
According to the latest revision, there were some 647,000 more nonfarm payroll jobs created since January 2010 than originally estimated, with more than half of them created during calendar year 2012.
While this is good news, the unemployment rate in the United States in January 2013 remained at 7.9 percent; and the fact remains that there are fewer people working today than at the start of the recession. In fact, since the start of the recession in December 2007, we have lost over 9.0 million jobs. Through January 2013, only 5.8 million new jobs have been created. This means that nonfarm payroll employment levels are still running 3.2 million behind where they were when the recession began. Chart 2 shows U.S. nonfarm payroll jobs gained and lost by sector since January 2008, when U.S. nonfarm payroll employment peaked.
2. U.S. nonfarm payroll jobs in thousands
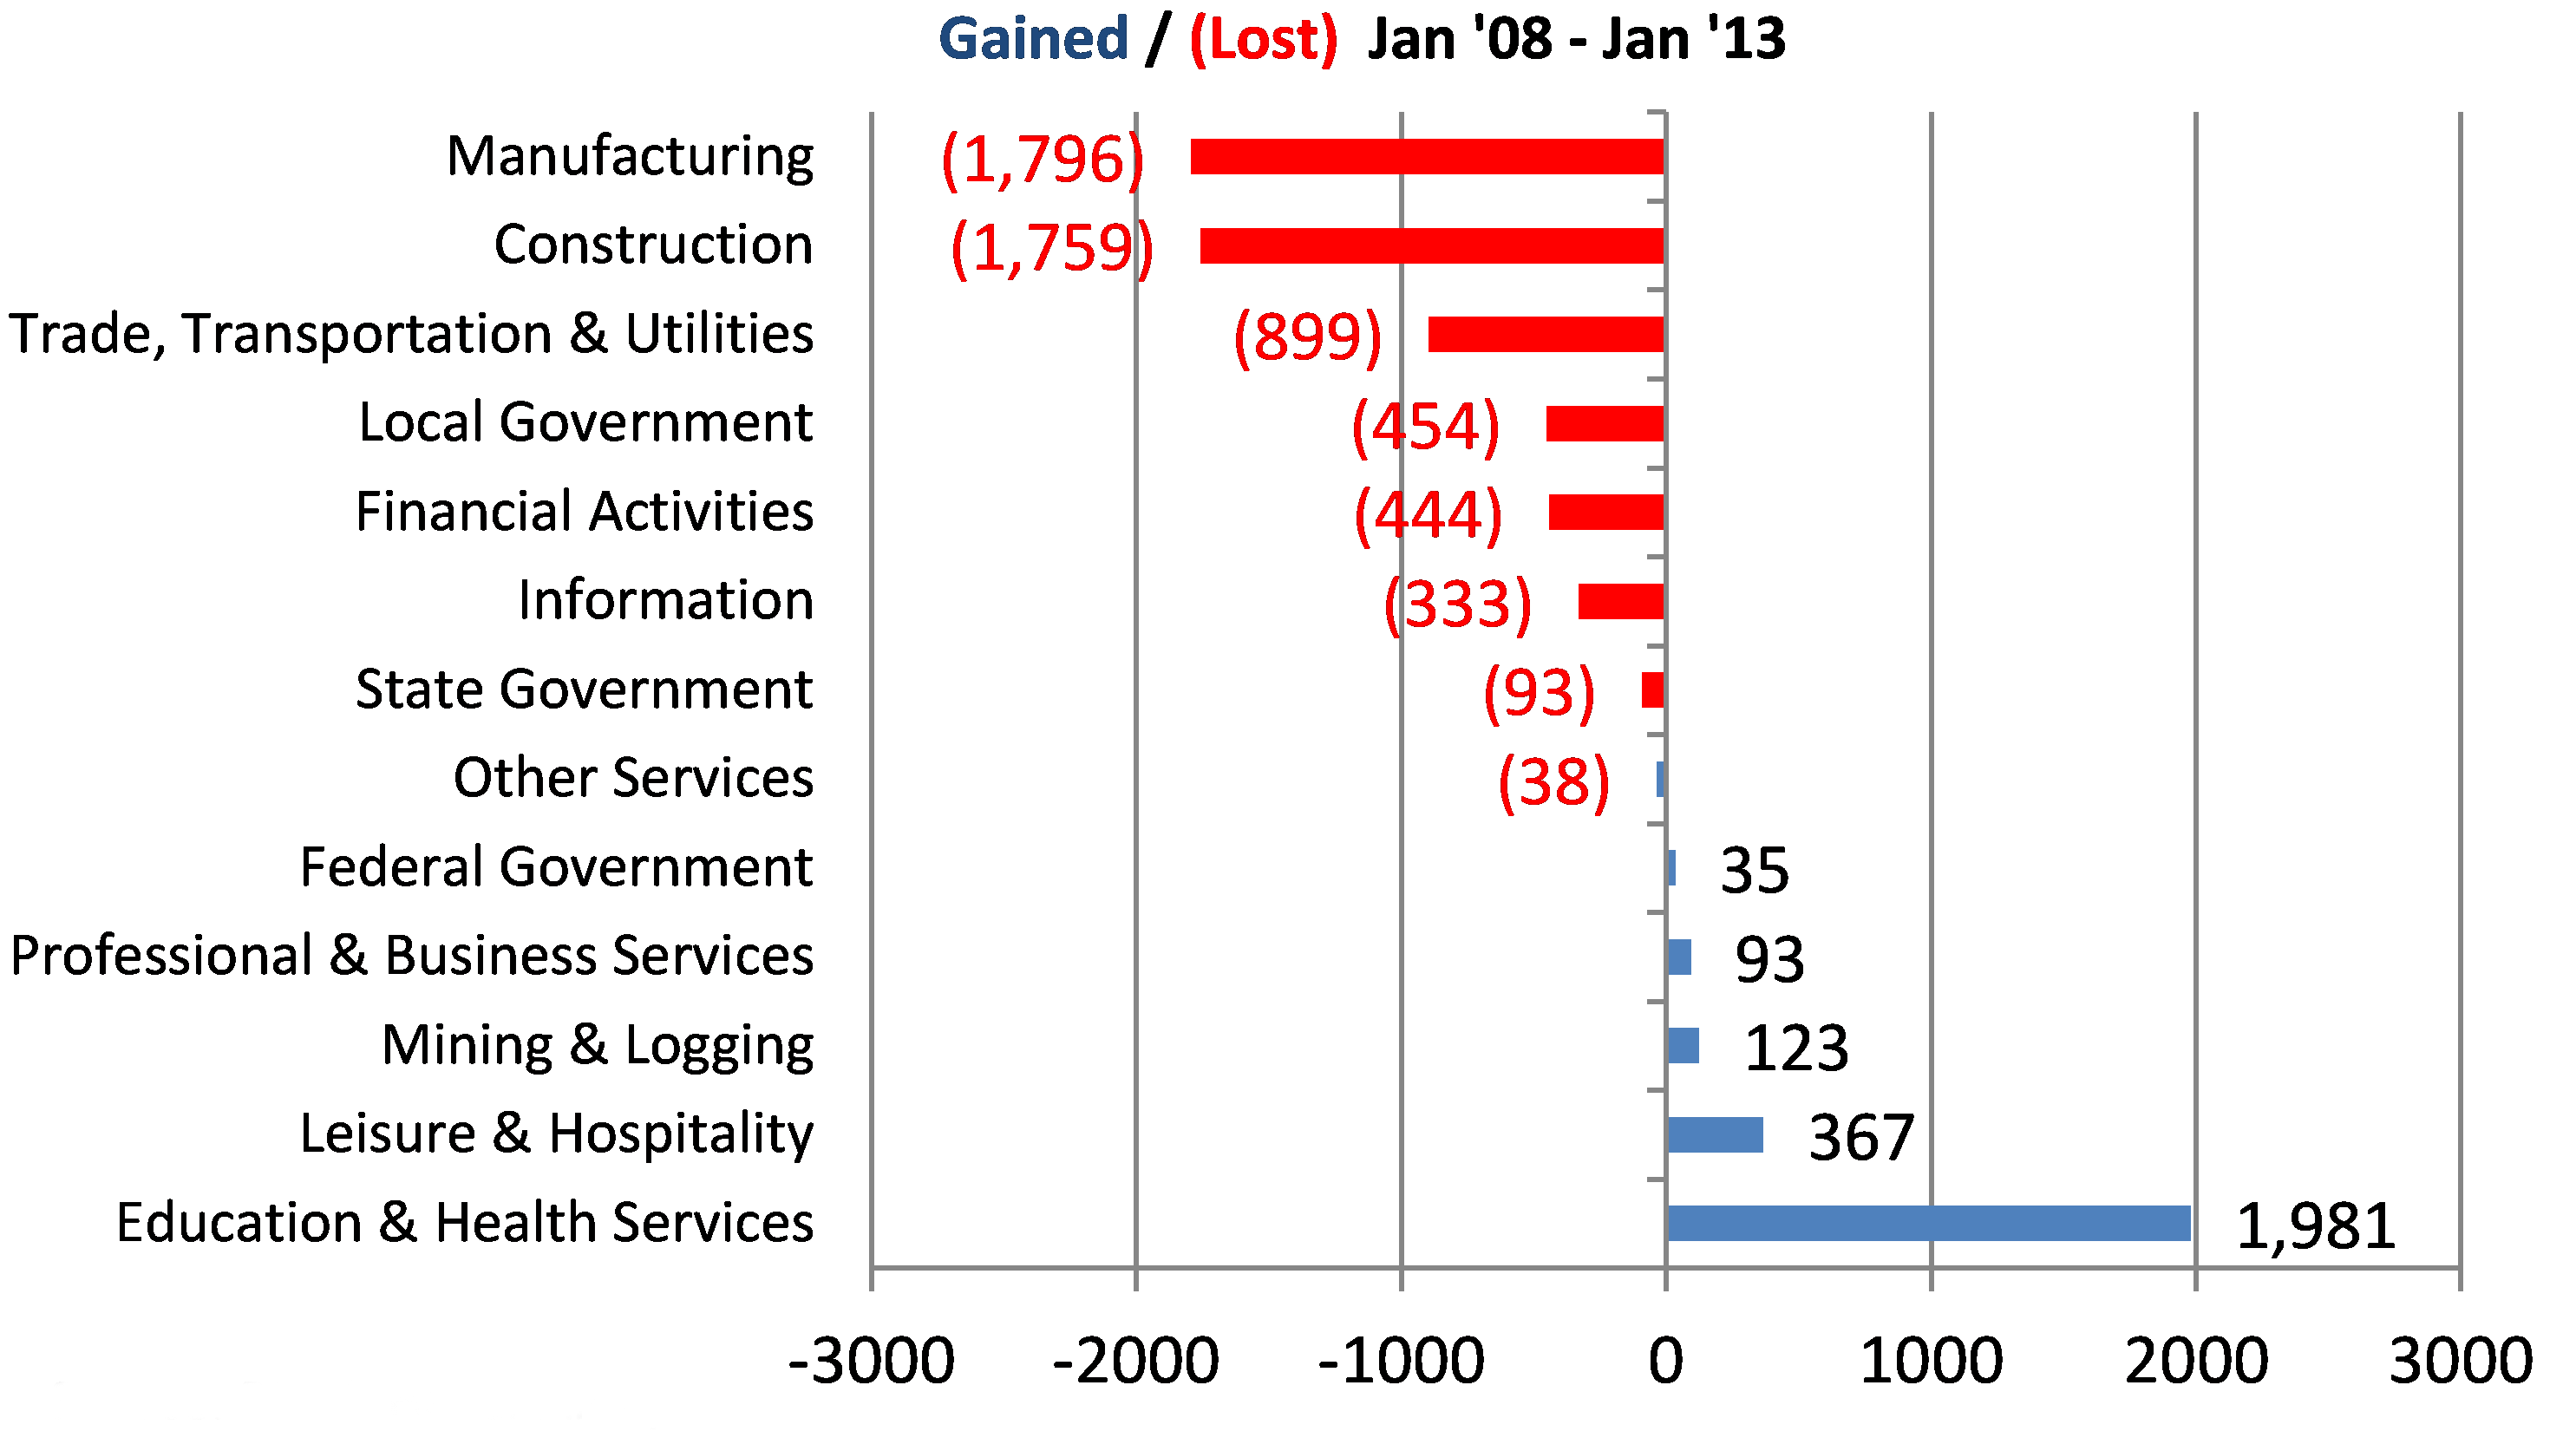
In the private sector, the industries that have been the slowest to recover include manufacturing, construction, trade and transportation, information technology, and financial activities. In total, these sectors are still down a total of 5.2 million employees. The public sector is still down by 512,000 employees, with local governments accounting for 89% of those job losses. It is no surprise that local governments have been the hardest hit, given the impact falling real estate price have had on revenue generation in many local communities and school districts throughout the country.
On the plus side, the biggest employment gains can be seen in the education and health services, leisure and hospitality, and mining and logging sectors. Health services alone has added 1.6 million jobs, accounting for half of all jobs created since the start of the 2008 recession. In fact, that sector has added jobs in every month since December 2007. This is a pretty remarkable feat, given the severity of the recession.
How has Michigan fared? Unlike the U.S., in Michigan nonfarm payroll employment actually peaked in April 2000 at 4,691,100 jobs. Michigan continued to lose jobs from then through the start of the 2008 recession. By January 2008, Michigan’s total nonfarm payroll employment had fallen by 450,000 jobs. After the 2008 recession started, Michigan lost an additional 413,300 jobs before bottoming out in July 2009 at 3,827,800 jobs. This is a total job decline from peak to trough of 863,300 jobs or 18.4% of all nonfarm payroll employment in the state. In December 2012, Michigan’s nonfarm payroll employment was reported to be 3,973,300, which is an increase of 145,500 jobs since July 2009. However, from peak to trough, Michigan is still down 717,800 nonfarm payroll jobs.
Chart 3 shows Michigan’s nonfarm payroll jobs gained and lost by sector since the start of the 2008 recession. Since the recession began, Michigan is still down 267,800 payroll jobs.
3. Michigan nonfarm payroll jobs in thousands
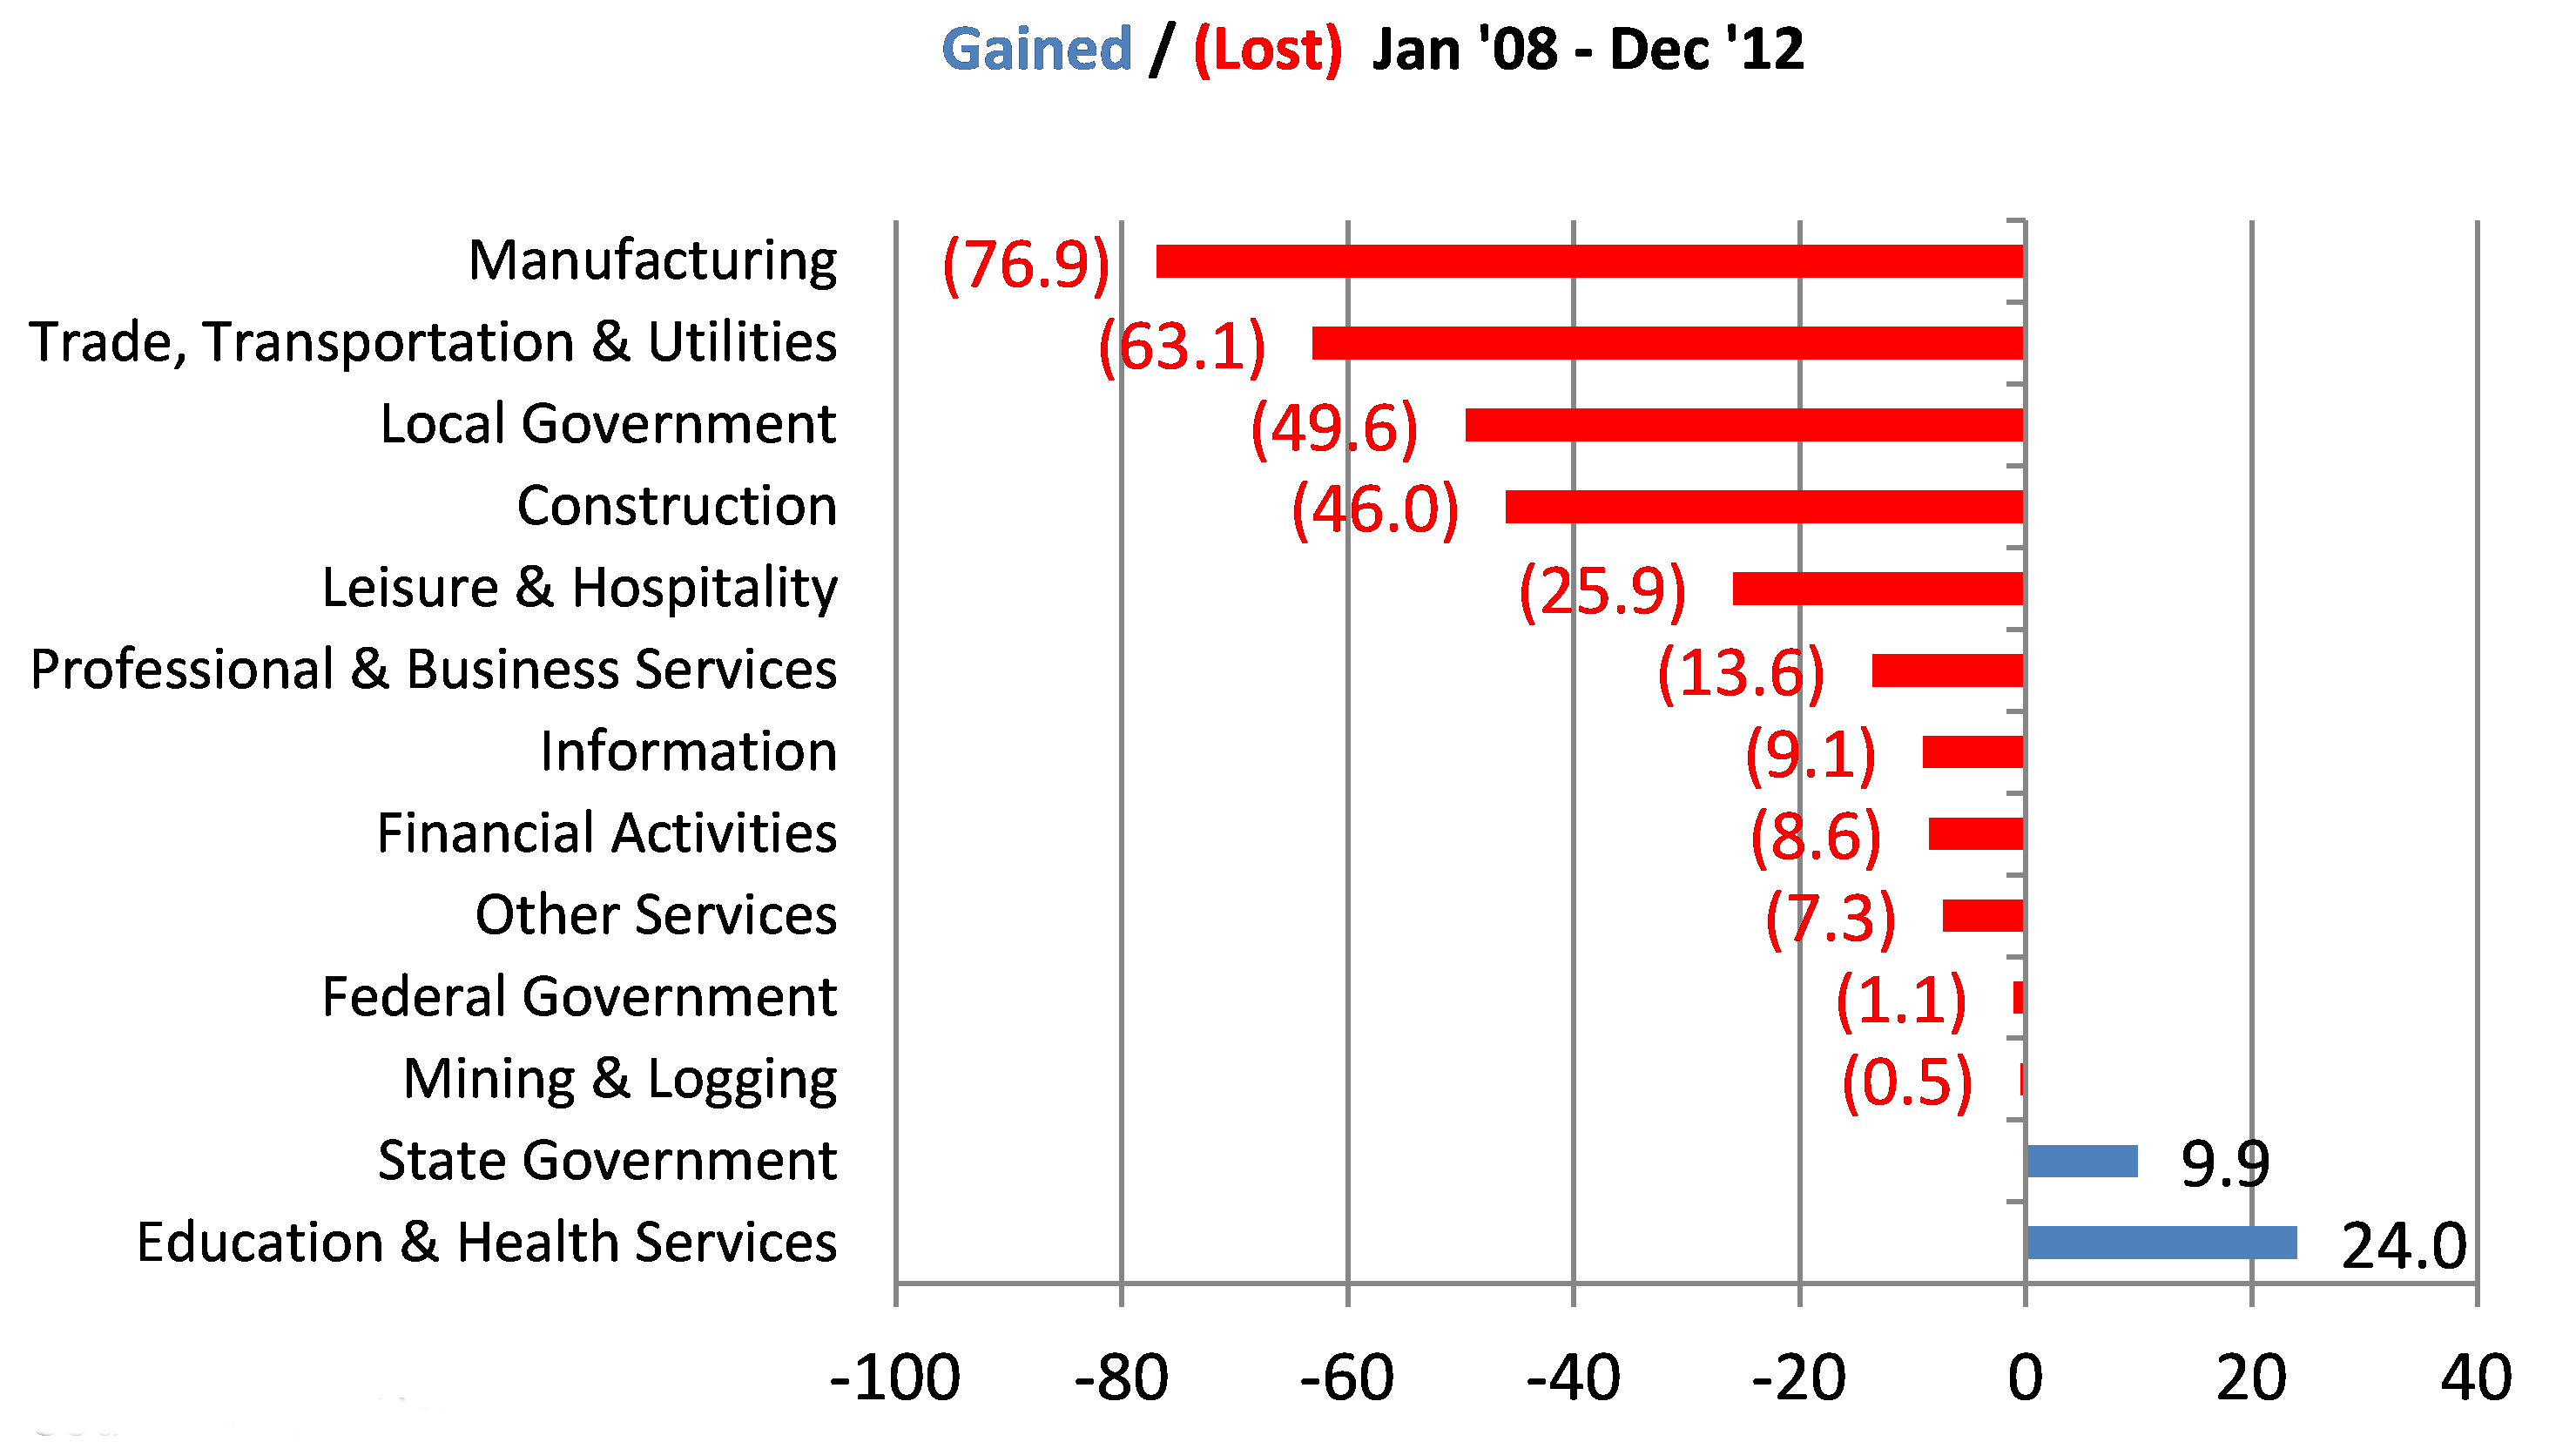
Even with the recent job gains in the auto industry, Michigan’s manufacturing employment is still down 76,900 jobs from the start of the recession. However like the nation as a whole, Michigan has seen fairly steady job growth in the education and health services sectors. The good news is that, relative to the nation’s, Michigan’s job recovery has been somewhat stronger, albeit from a much lower base. Charts 4 and 5 show the percentage change in nonfarm payroll employment for the United States and Michigan by major category and by sector from the start of the recovery through December 2012.
4. Nonfarm payroll employment
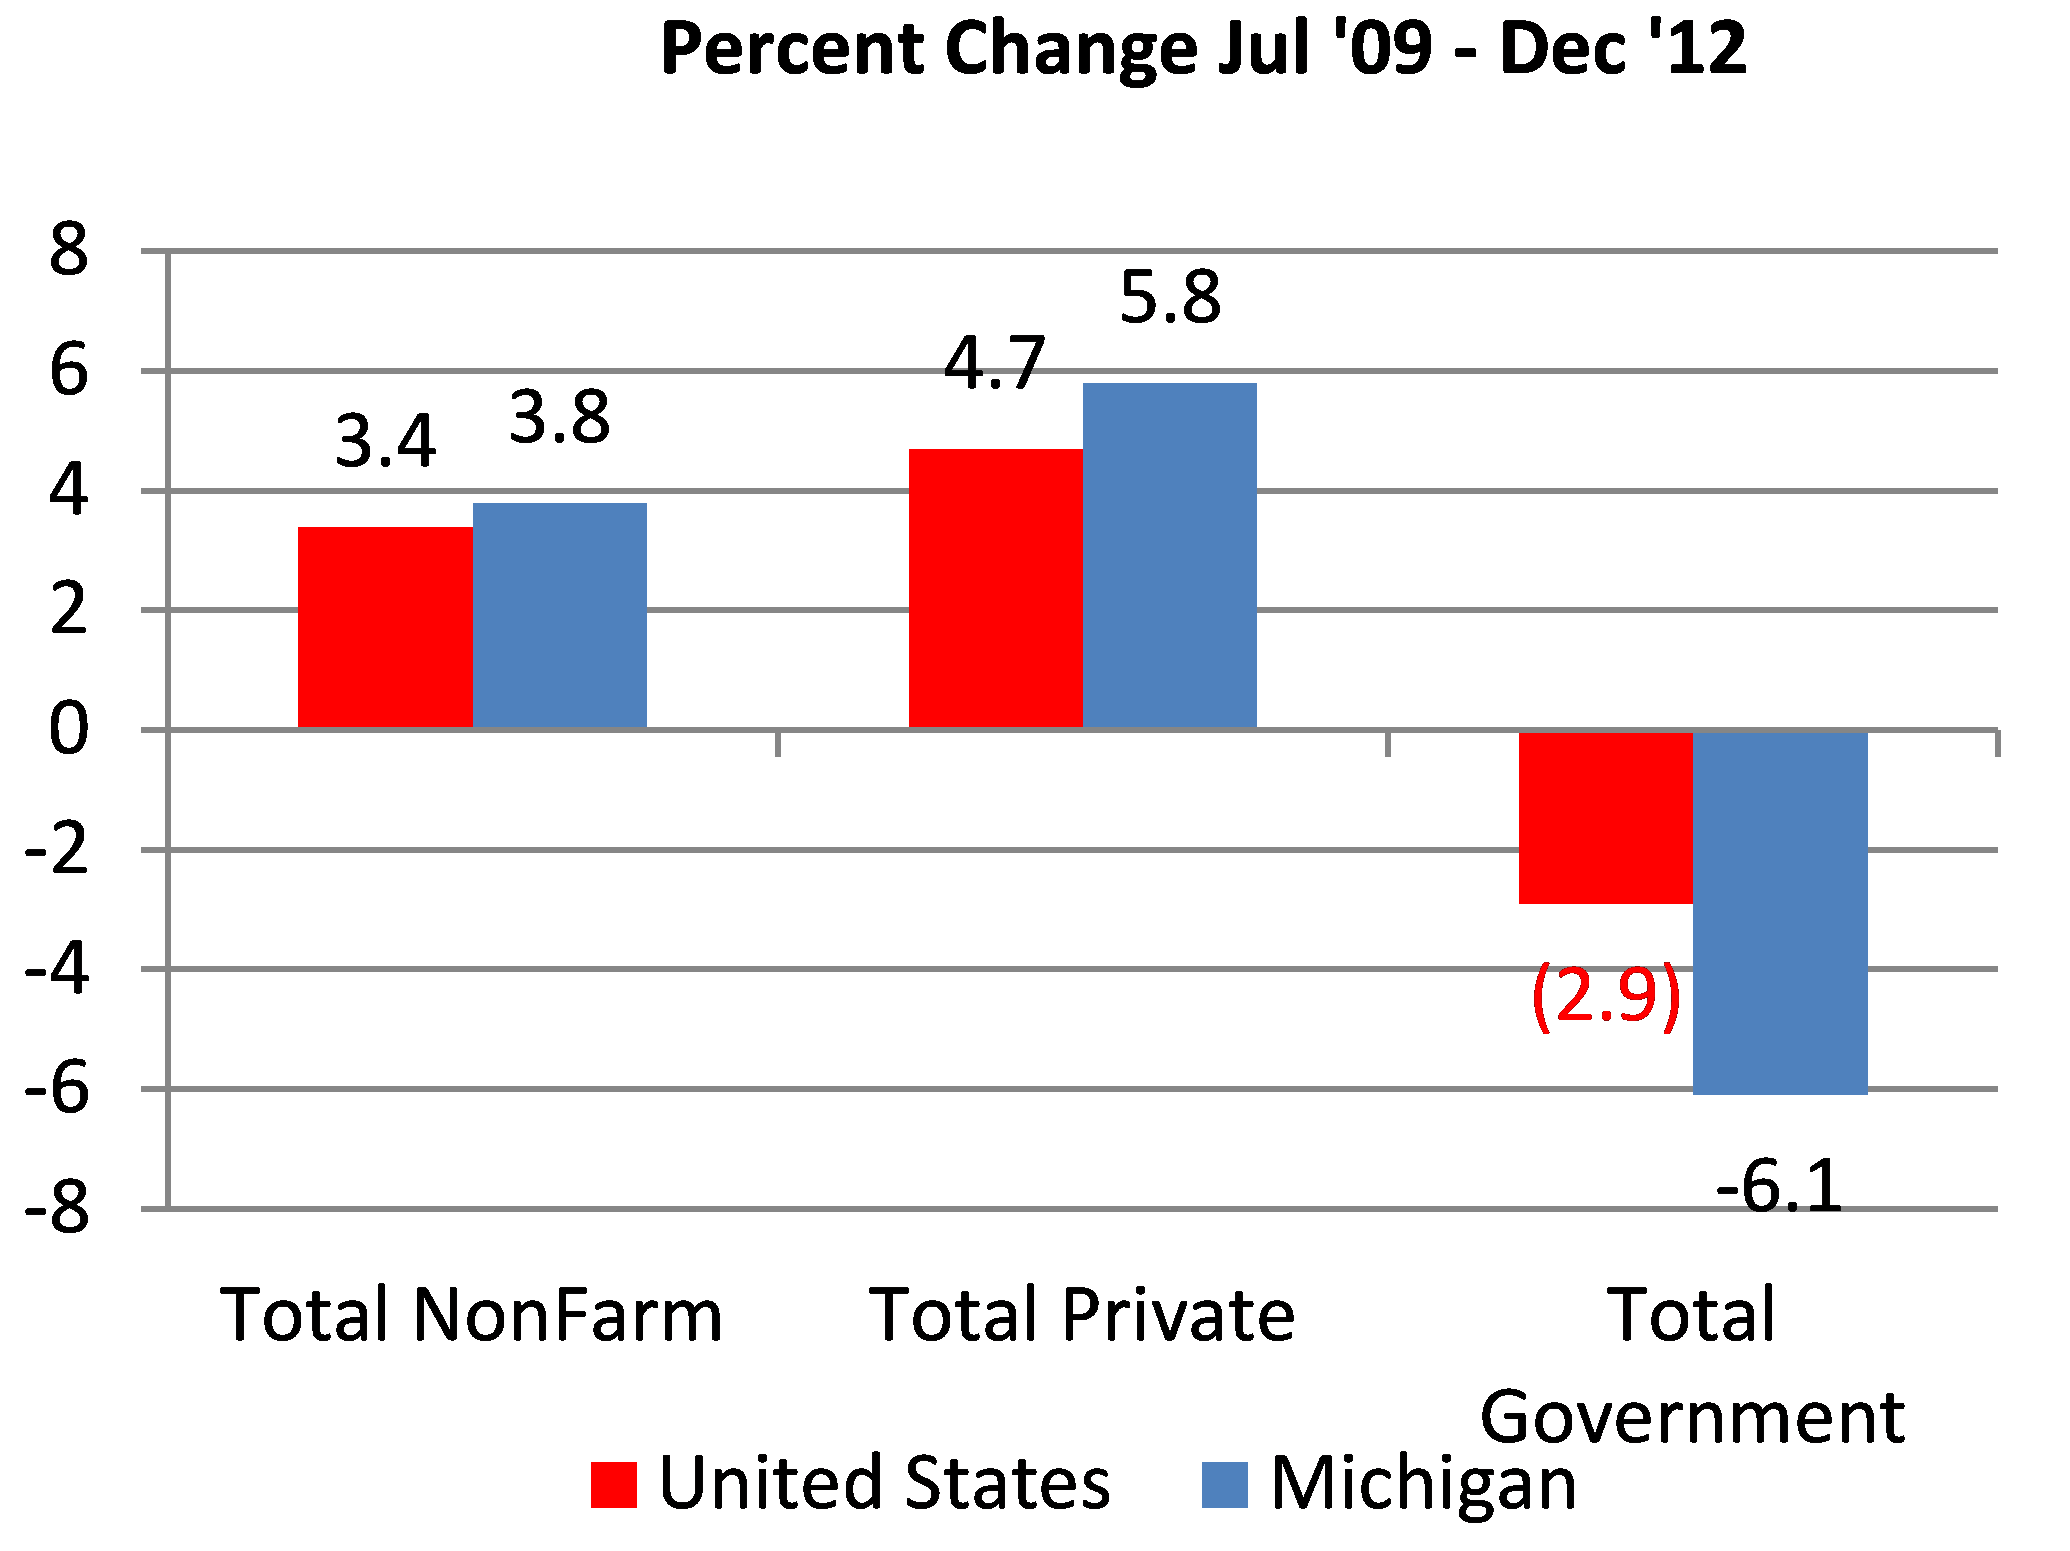
5. Nonfarm payroll jobs percent change
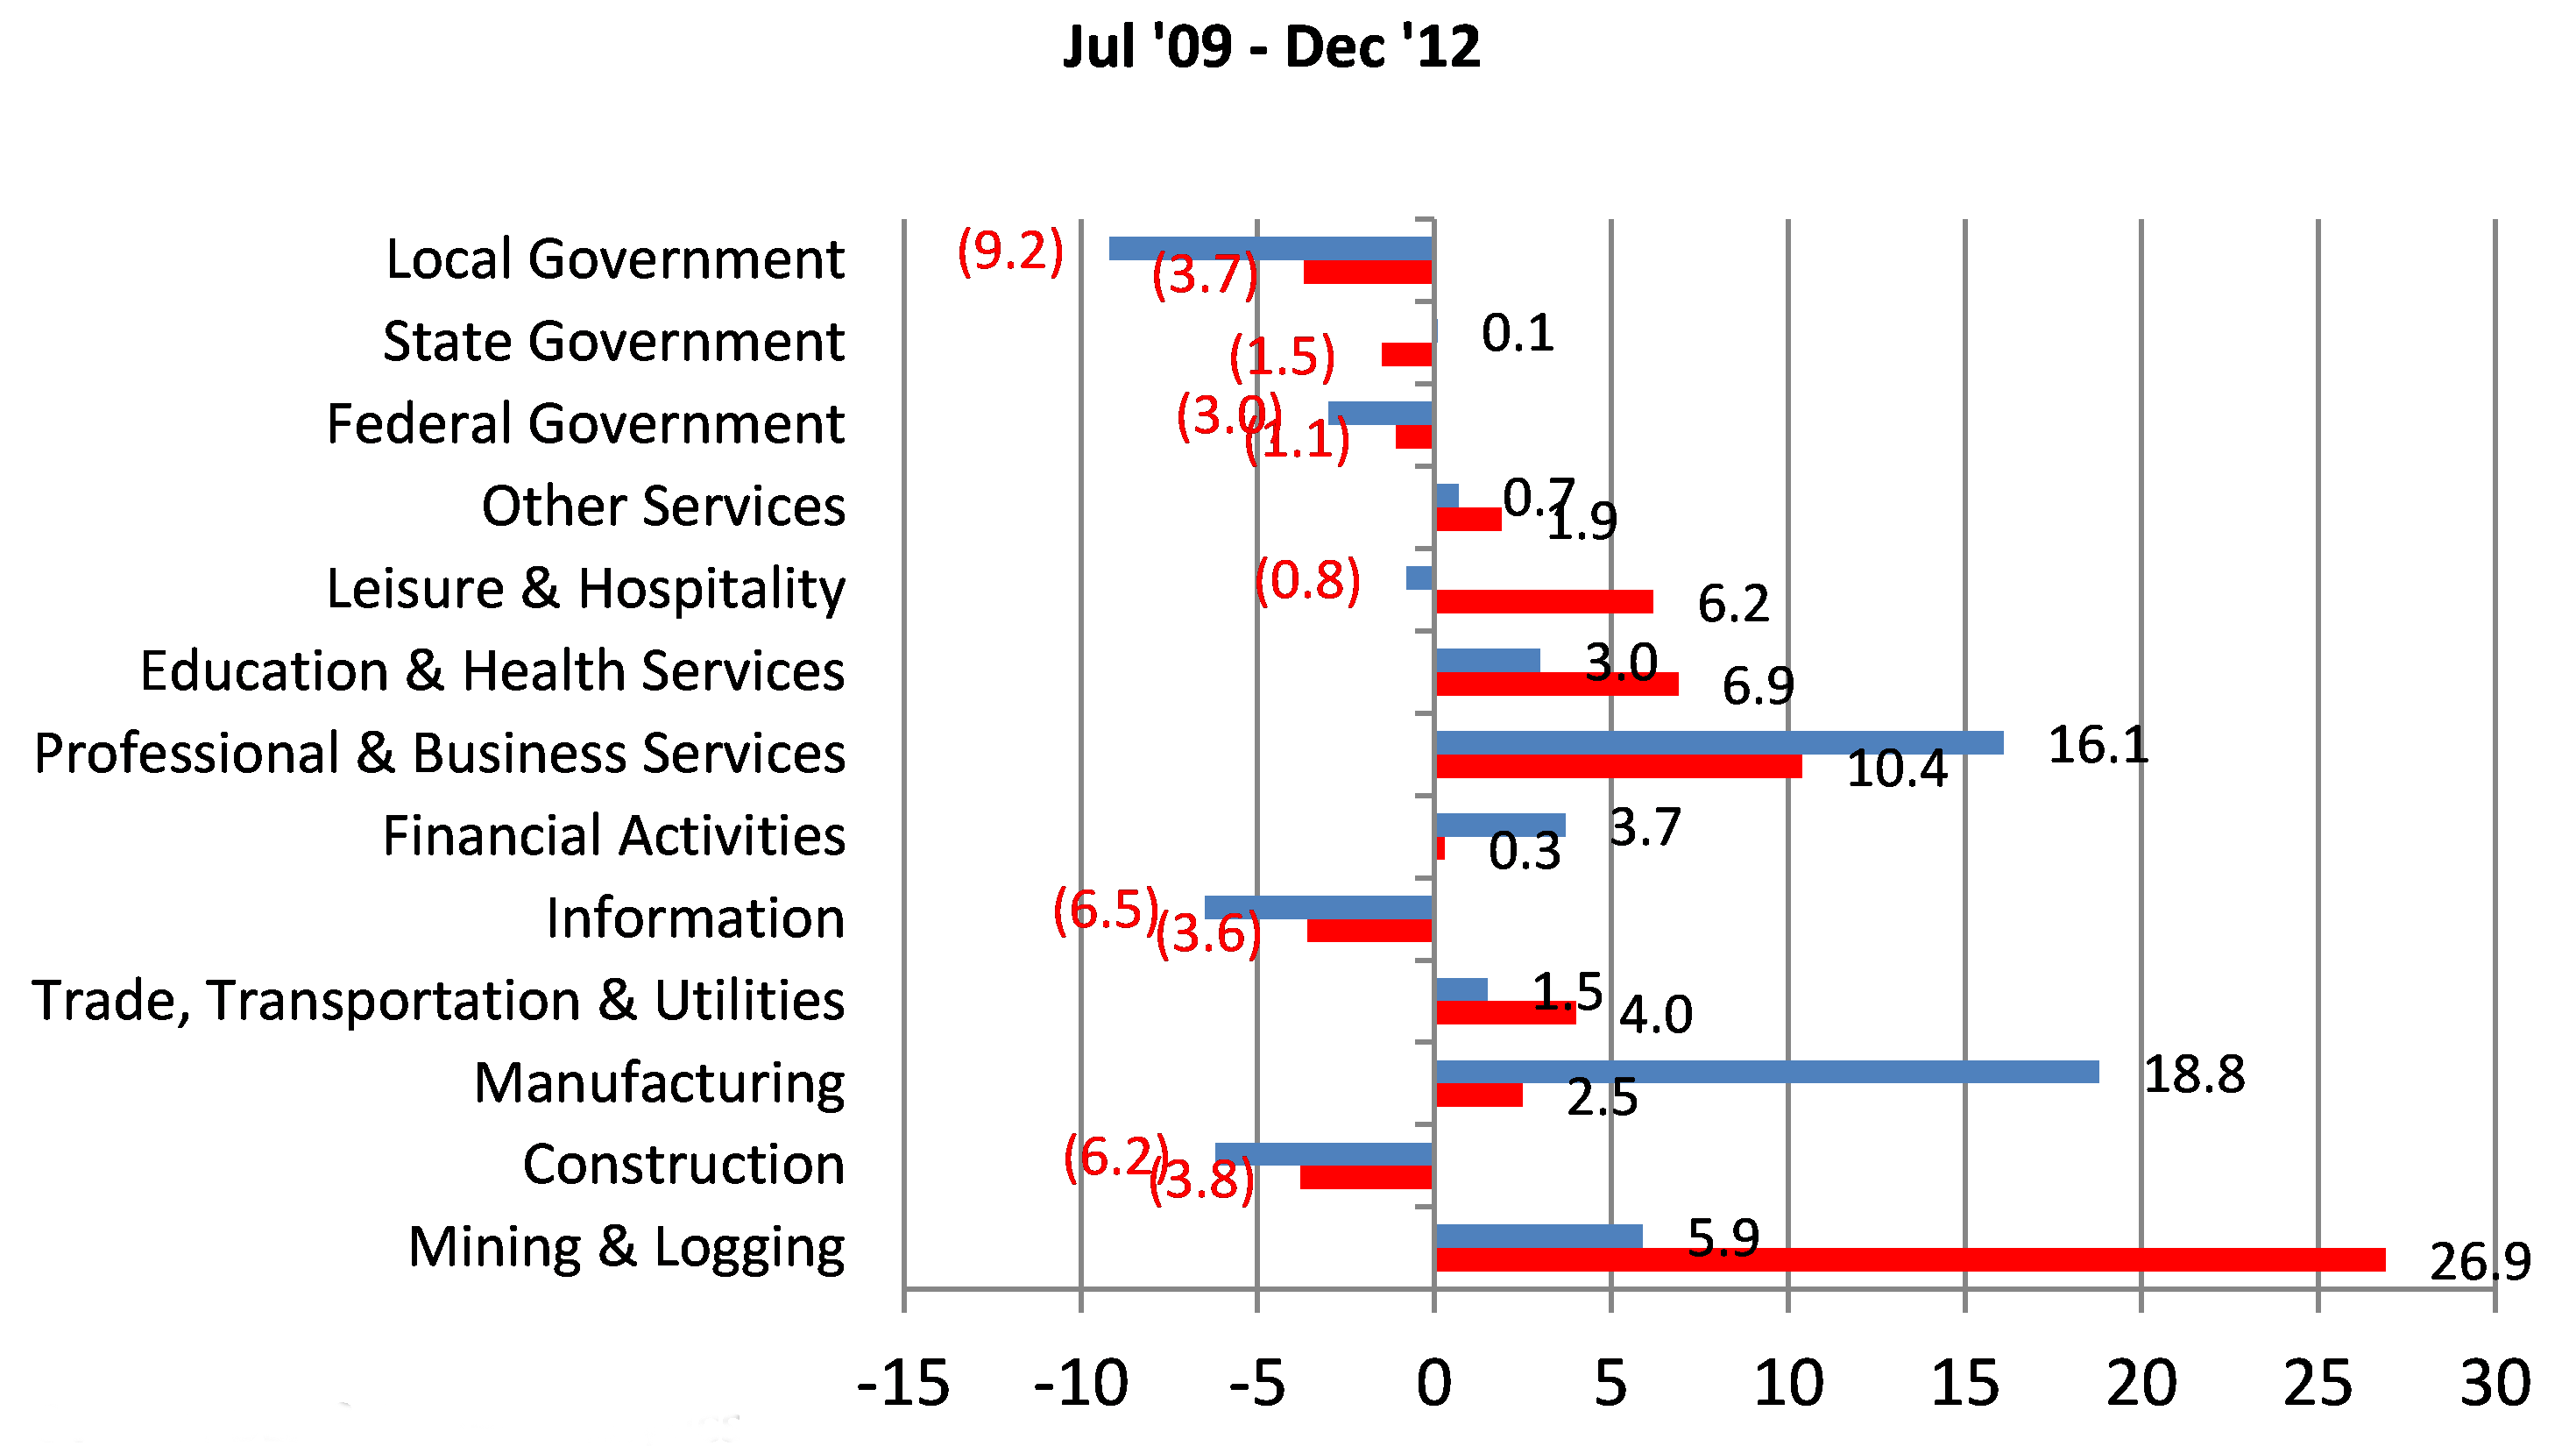
As these data indicate, Michigan has seen stronger total growth than the nation since the start of the recovery, with private sector job growth overshadowing losses in the public sector. The auto recovery also shows up better in these charts, as Michigan is shown posting an 18.8% increase in manufacturing jobs compared with only 2.5% for the nation. The question is whether this trend will continue. Chart 6 shows total U.S. manufacturing employment by month from January 1960 to January 2013.
6. U.S. manufacturing employment
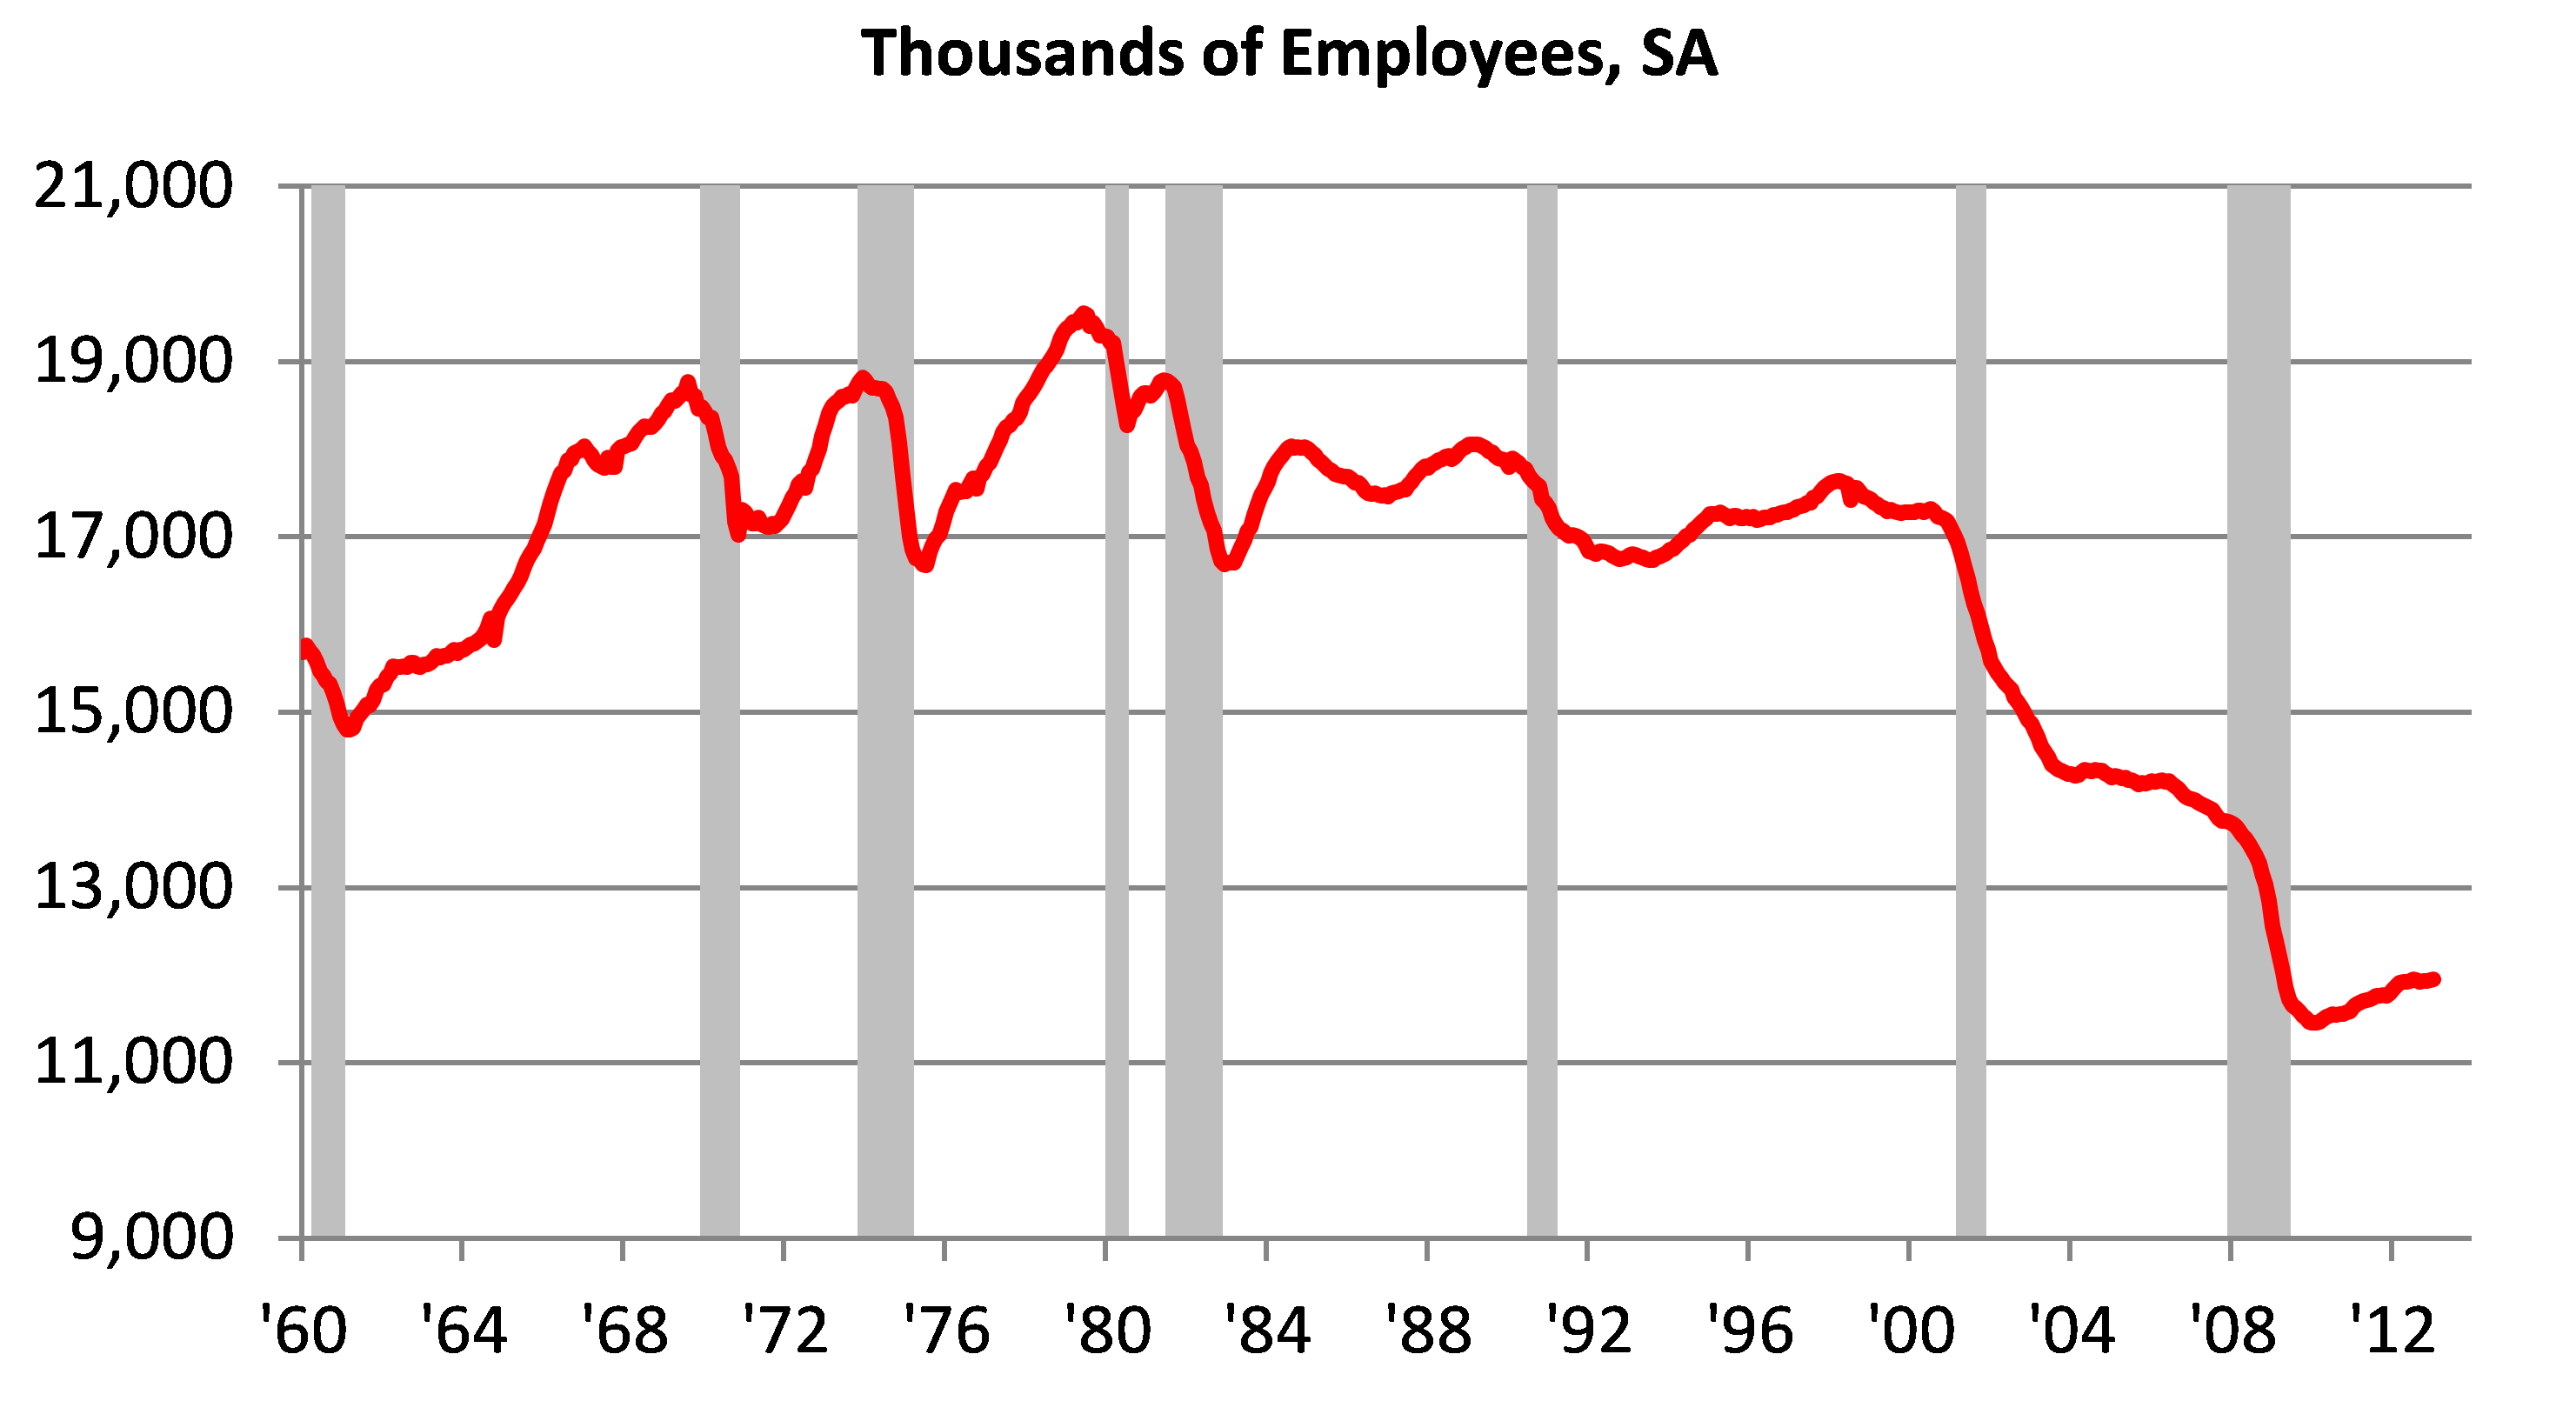
Here we see that, even taking into account the cyclicality of the 1960s and 1970s, manufacturing employment remained fairly stable through the end of the 20th century. However, since the beginning of the 21st century, manufacturing employment has fallen by about 5.3 million jobs. More recently there has been talk about a manufacturing resurgence in the United States. This discussion started following the Japanese earthquake and tsunami when supply chains for some industries experienced major disruptions to production throughout the world. The debate centered on the need to minimize risk, even if it meant higher prices for some commodities and component parts. More recently, new technologies for extracting natural gas and petroleum products from shale rock have led some to argue that the availability of low-cost energy could make the U.S. more competitive and lead to the return of some manufacturing jobs. This debate is ongoing.
On April 8–9, 2013, the Chicago Fed’s Detroit Branch will host an event to discuss the impact of enhanced domestic recovery of natural gas and other fuels on industries and regional economies. The conference will focus on the shifting markets, development opportunities, and economic outcomes resulting from increasing shale gas and oil extraction in the United States.
For further details on the conference, including a complete agenda and information on registration, location, and accommodation, please visit our conference webpage.
Note: Michigan’s employment data will be revised on March 16. We do not expect significant changes, but I will provide a review of the revisions in a subsequent blog.


