The Importance of Manufacturing to the Seventh District and Michigan
There has been a lot written about manufacturing returning to the United States from abroad, and there are data to suggest that this is happening. Rising wages abroad, falling energy prices in the U.S., and declining willingness of domestic manufacturers to suffer the delays and poorer quality of overseas supply chains are conspiring to shift some production back to the U.S., a trend called onshoring. At a Federal Reserve Bank of Chicago conference last April, Justin Rose of the Boston Consulting Group (BCG) attested that the U.S. still makes over 70% of the manufactured goods it consumes, while its prospects remain bright as global trends are conspiring to encourage onshoring. However, while U.S. manufacturing output remains hefty and onshoring is undoubtedly taking place, there is some debate as to whether manufacturing jobs are returning to the U.S. in a meaningful way. A recent Forbes article, “Reports Of America’s Manufacturing Renaissance Are Just a Cruel Political Hoax,” makes the case that even though “some reshoring has taken place,” there hasn’t been enough to offset the continued offshoring of manufacturing jobs. This debate is of great importance to the Seventh District and Michigan.
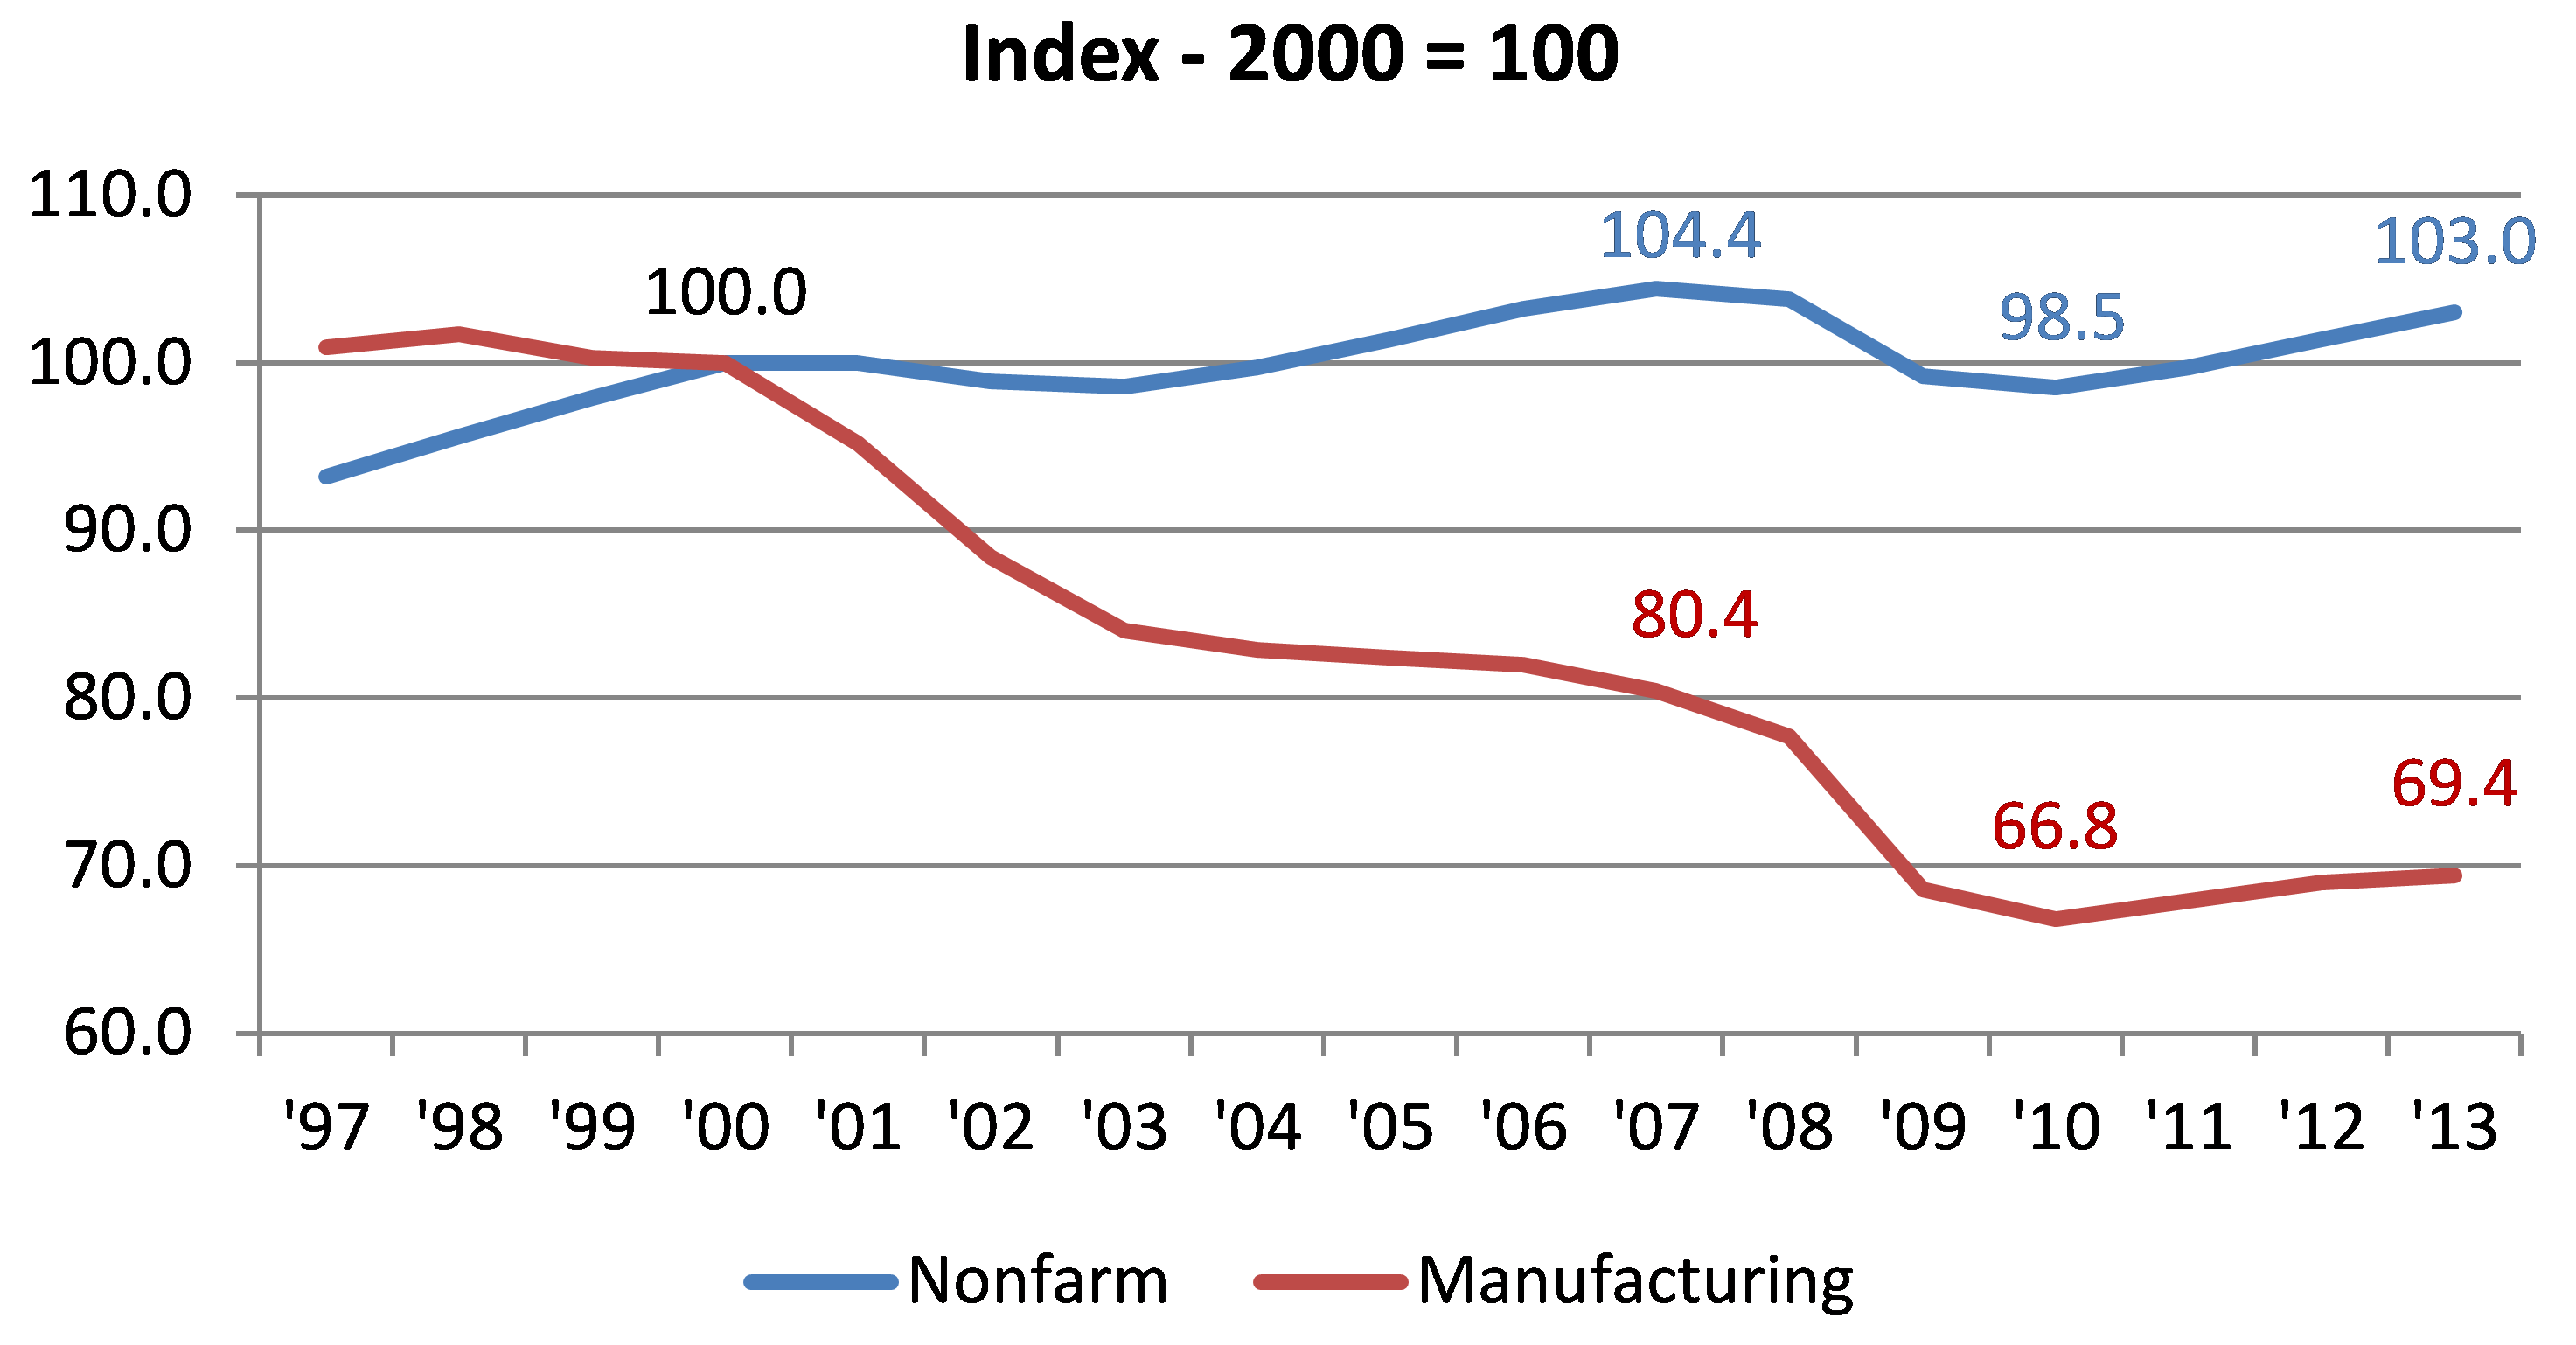
As Chart 1 shows, the United States lost about 33.2% of its manufacturing jobs between 2000 and 2010 compared with a 1.5% decline in total nonfarm payroll jobs. Given the extent of manufacturing job decline during the recession, it wasn’t surprising to see growth in manufacturing jobs exceed total nonfarm payroll growth through 2012 even though that pace of growth slowed somewhat in 2013. In addition, while nonfarm employment is now close to its prerecession peak, manufacturing employment is still down by more than 30% from its 2000 level and 11.0% below its 2007 level.
1. U.S. employment
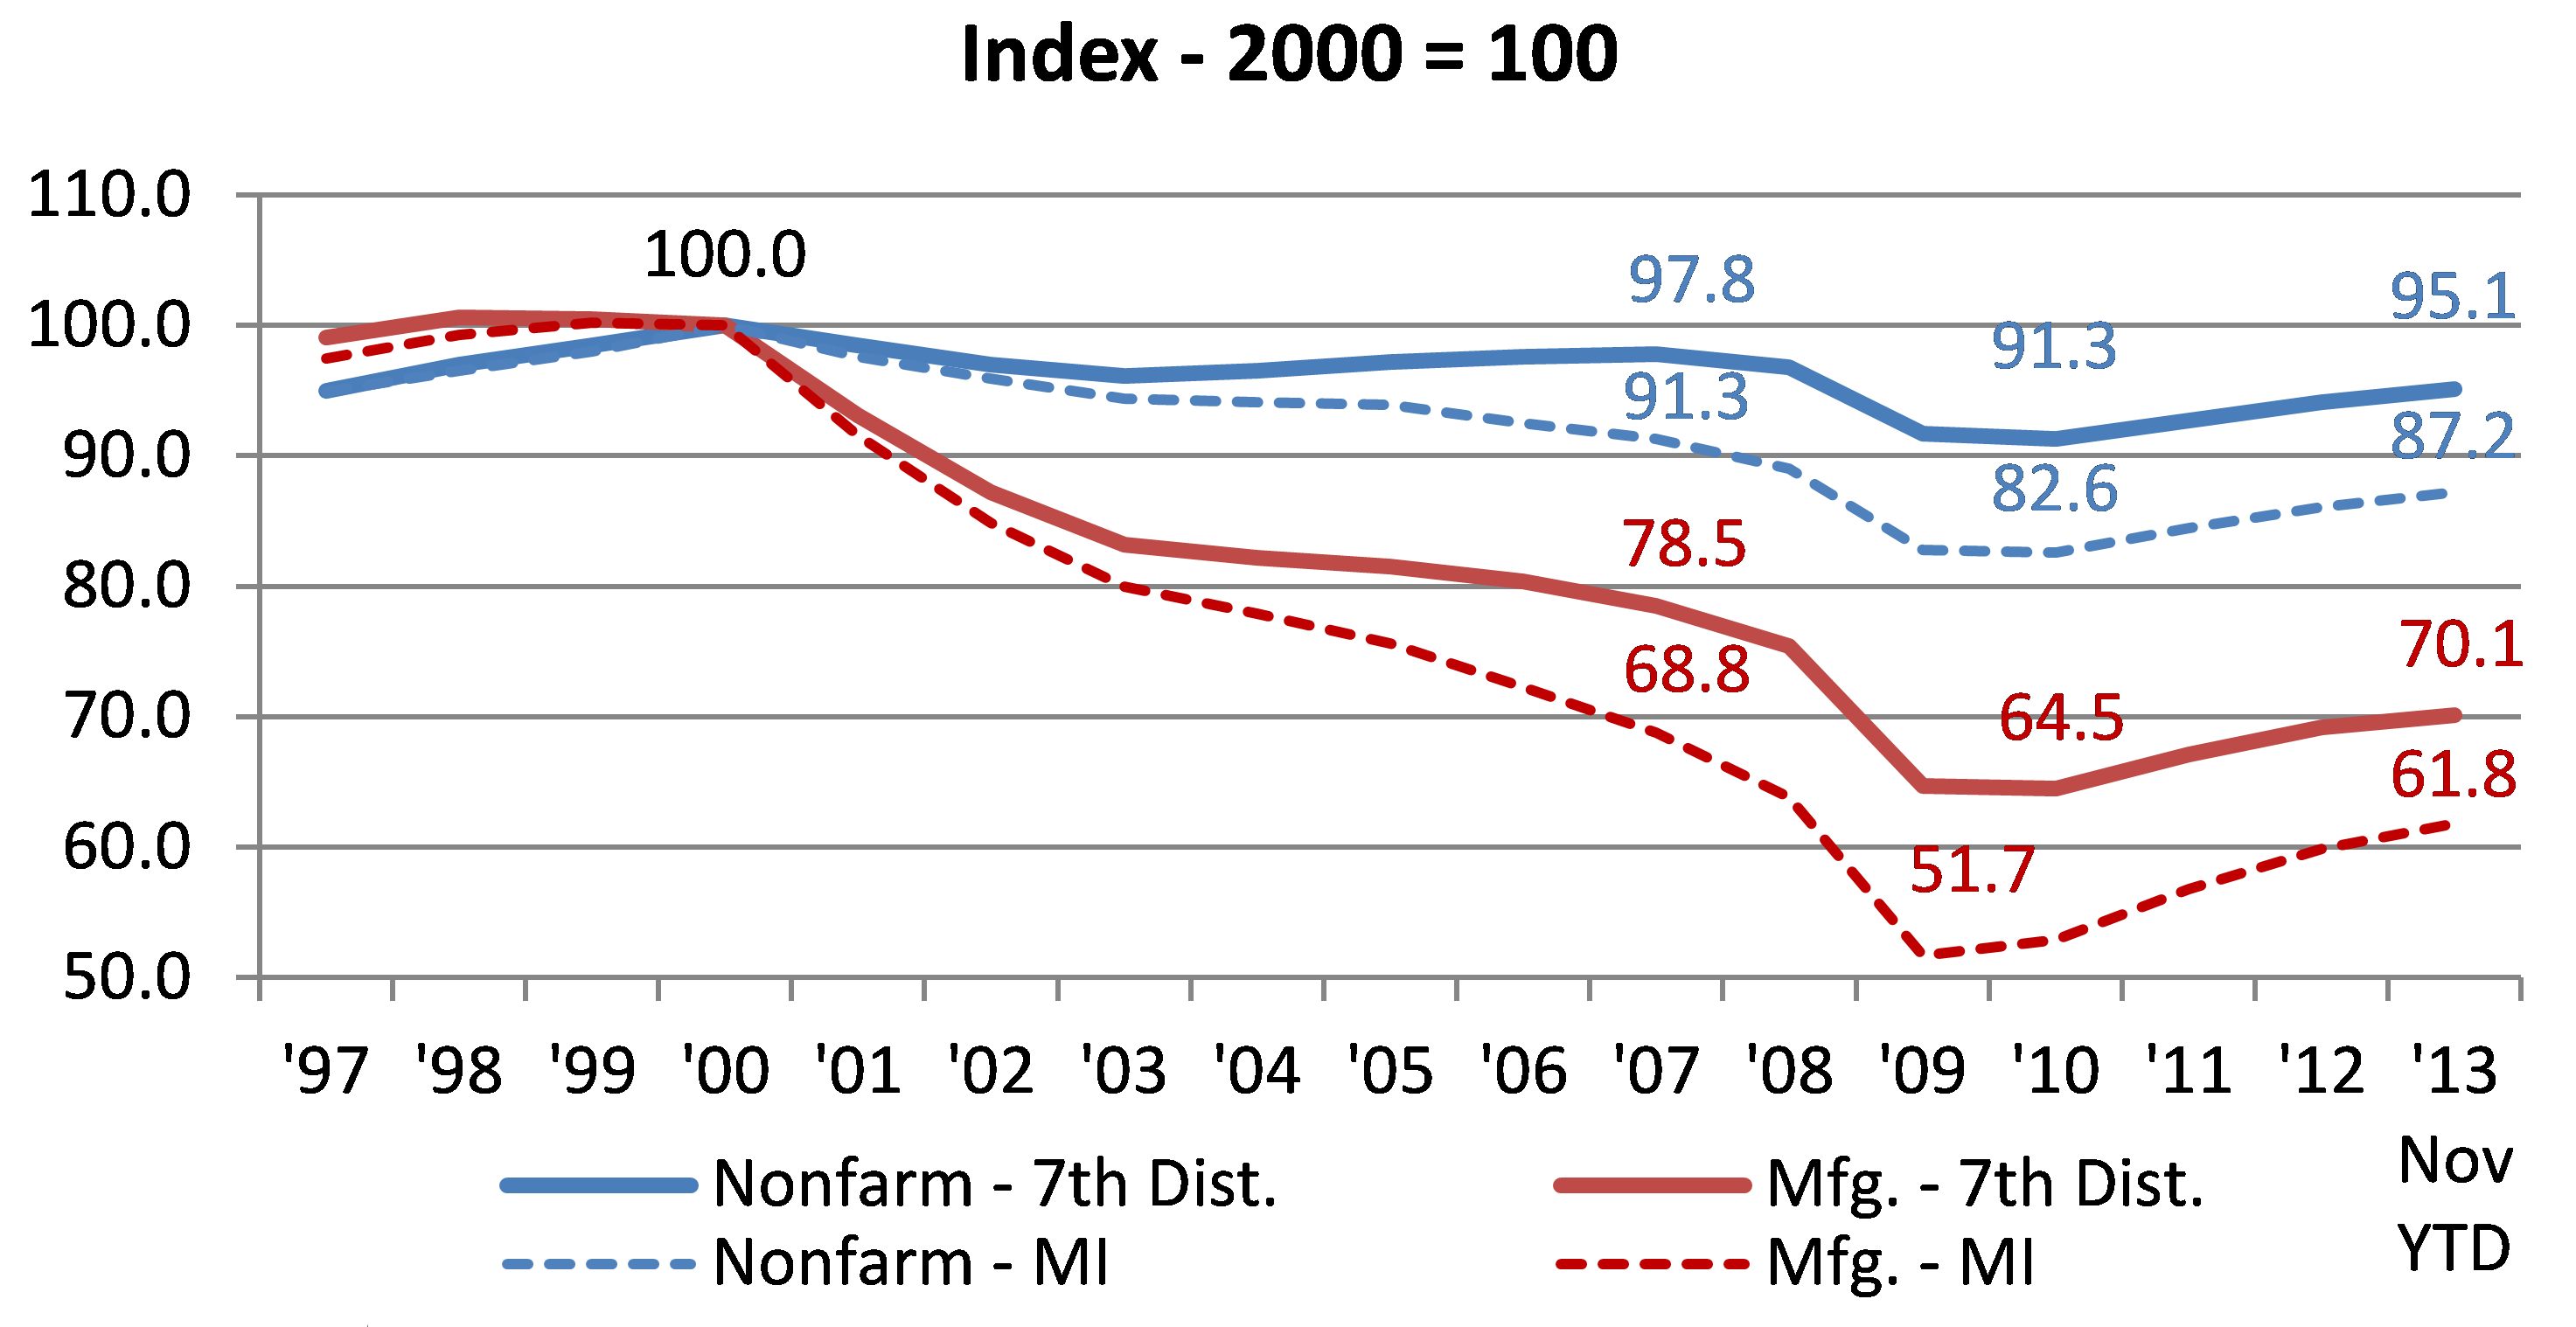
Comparing U.S. employment with that of the Seventh District and Michigan (Chart 2), we see a slightly different picture. While total nonfarm employment for the District has improved, it is still 4.9% below its 2000 level and Michigan is still down 12.8%. Manufacturing employment is well below 2000 levels in both the District and Michigan, –28.9% and –38.2%, respectively. However, there has been some progress in the District since the recession, especially in manufacturing jobs. While the District has seen total nonfarm jobs grow by 4.2% since 2010, manufacturing jobs have improved by more than twice that rate, increasing by 8.7%. Michigan has seen total nonfarm employment grow by 5.5% for the same period, with manufacturing jobs increasing an astonishing 17.0%.
2. Seventh District employment
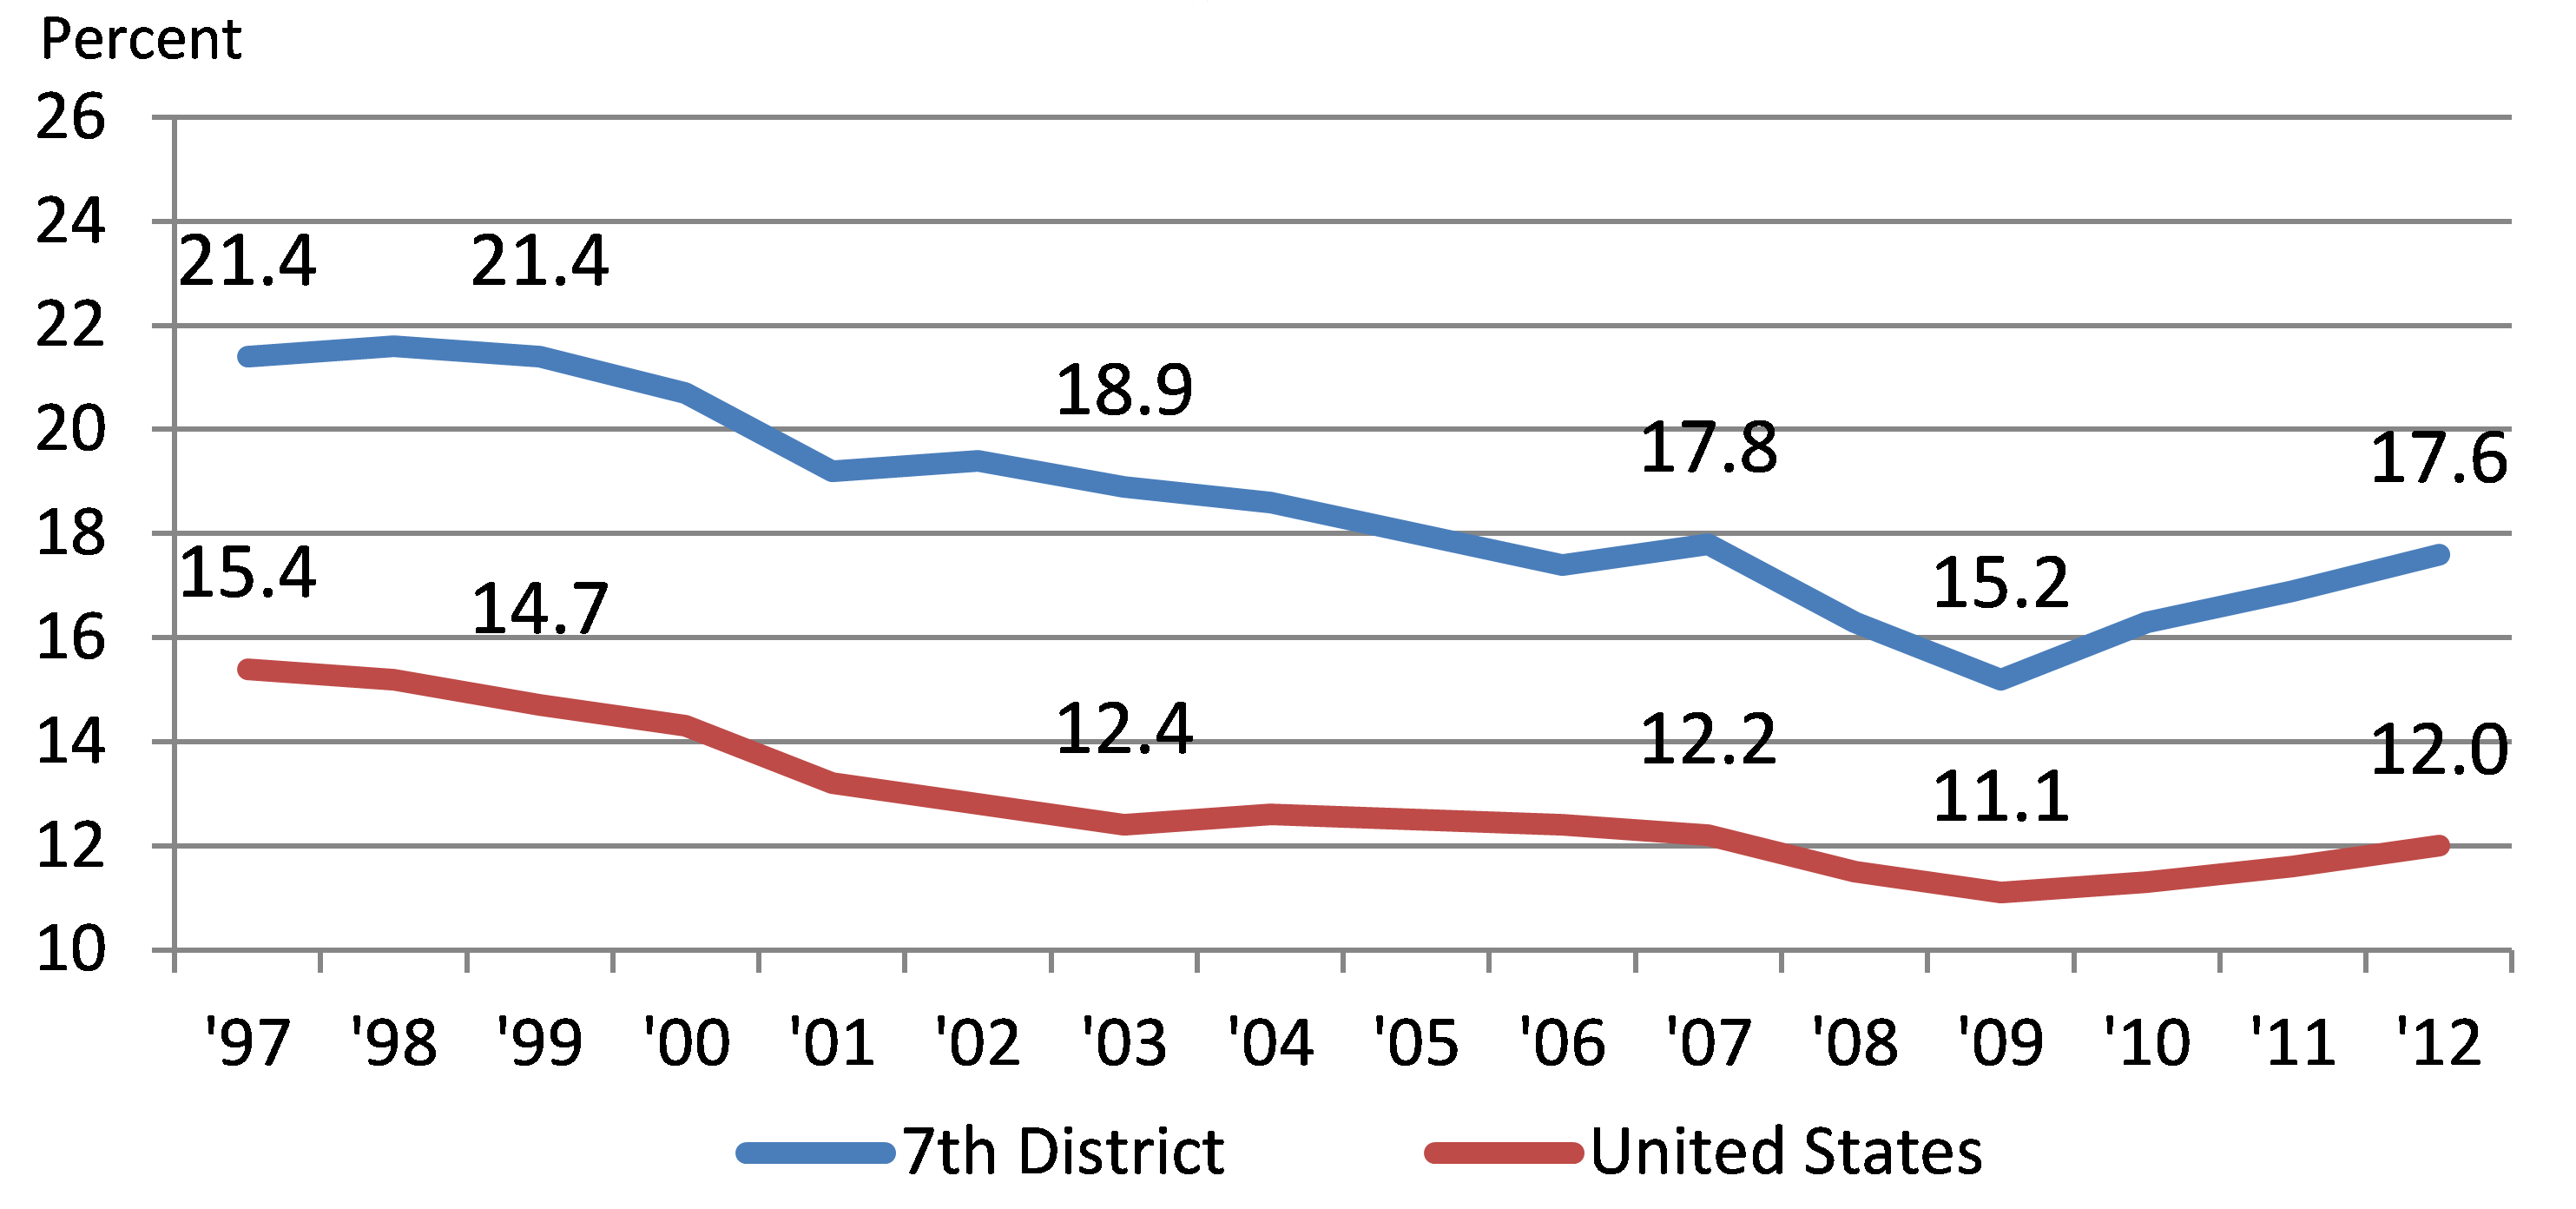
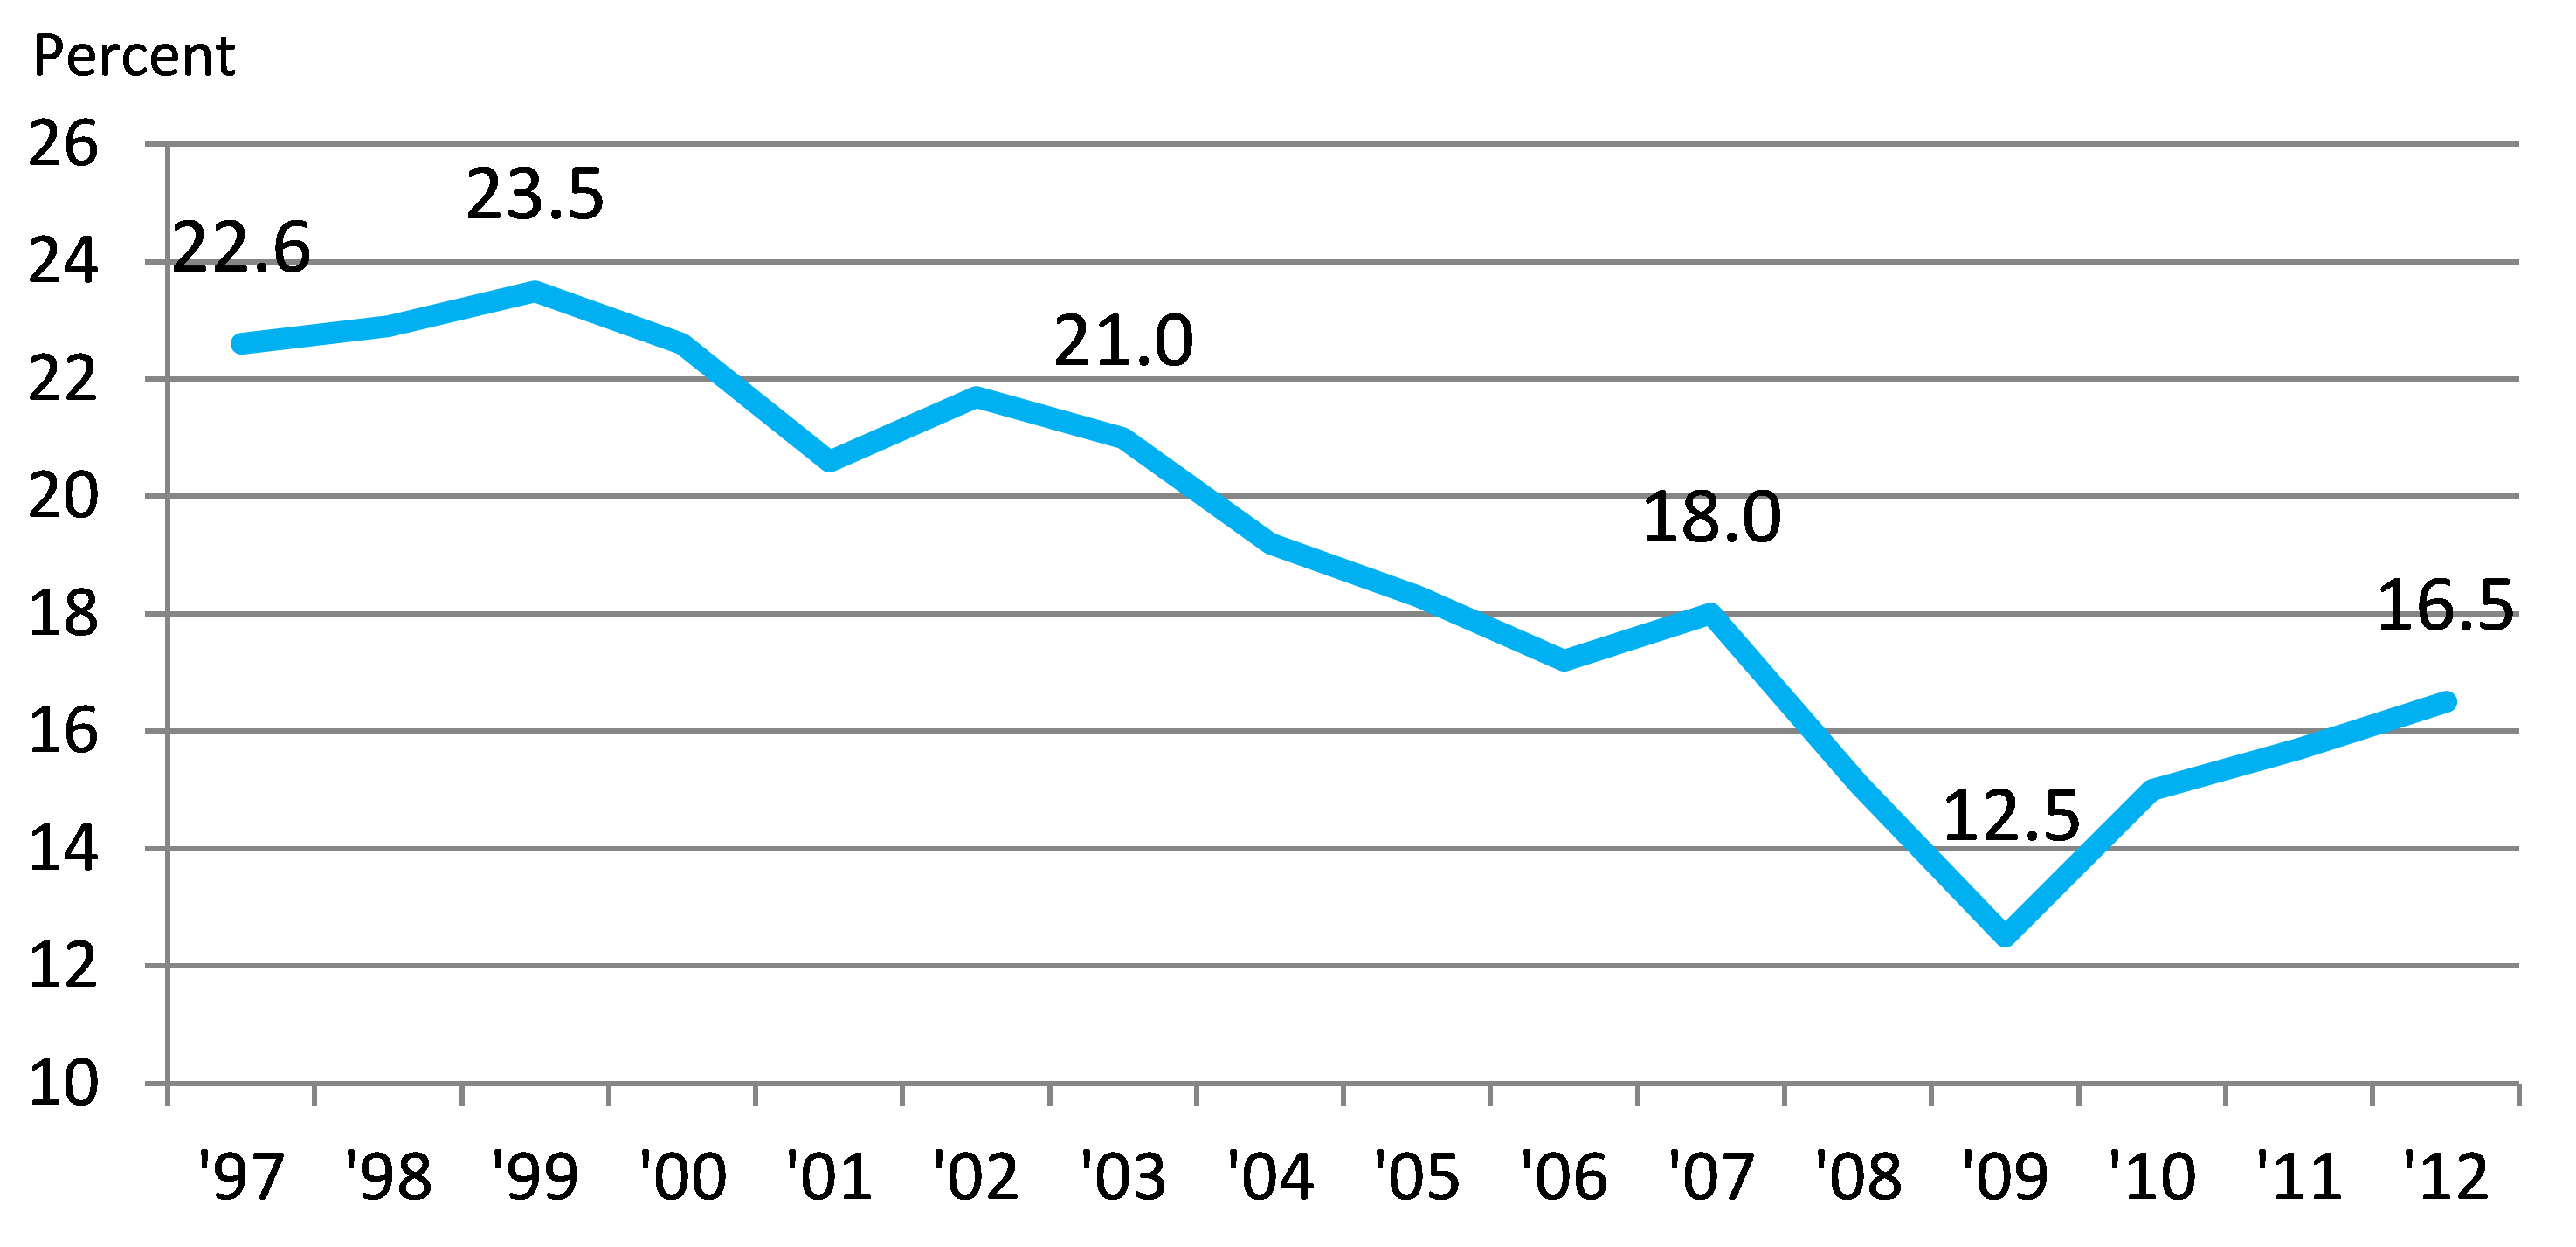
Obviously, this is important to the Seventh District and Michigan economies, given the relative heft of the manufacturing sector in the region. Charts 3 and 4 use nominal data to create manufacturing’s share of total output for the United States, the Seventh District, and Michigan. The charts show that while manufacturing has been declining steadily since 1997, the District and Michigan remain more dependent on manufacturing than the nation as a whole. The charts also illustrate that manufacturing has made somewhat of a rebound since the end of the recession. In fact, the manufacturing shares of both the U.S. and the district are very close to where they were just prior to the recession.
3. U.S. & Seventh District manufacturing as a percent of total output
4. Michigan manufacturing as a percent of Michigan's output
Much of the District’s growth in manufacturing output is related to growth in light vehicle sales, which reached their lowest levels in almost three decades during the 2008 recession. Still, the growth is quite impressive. Chart 5, which uses data from the Bureau of Economic Analysis (BEA), shows how the District accounts for almost half of the nation’s motor vehicle and parts manufacturing and this share has remained fairly constant over the last 15 years. Michigan accounts for more than half of the District’s and about 25% of the nation’s motor vehicle and parts output.
5. Seventh District & Michigan motor vehicle output as a percent of U.S. motor vehicle output
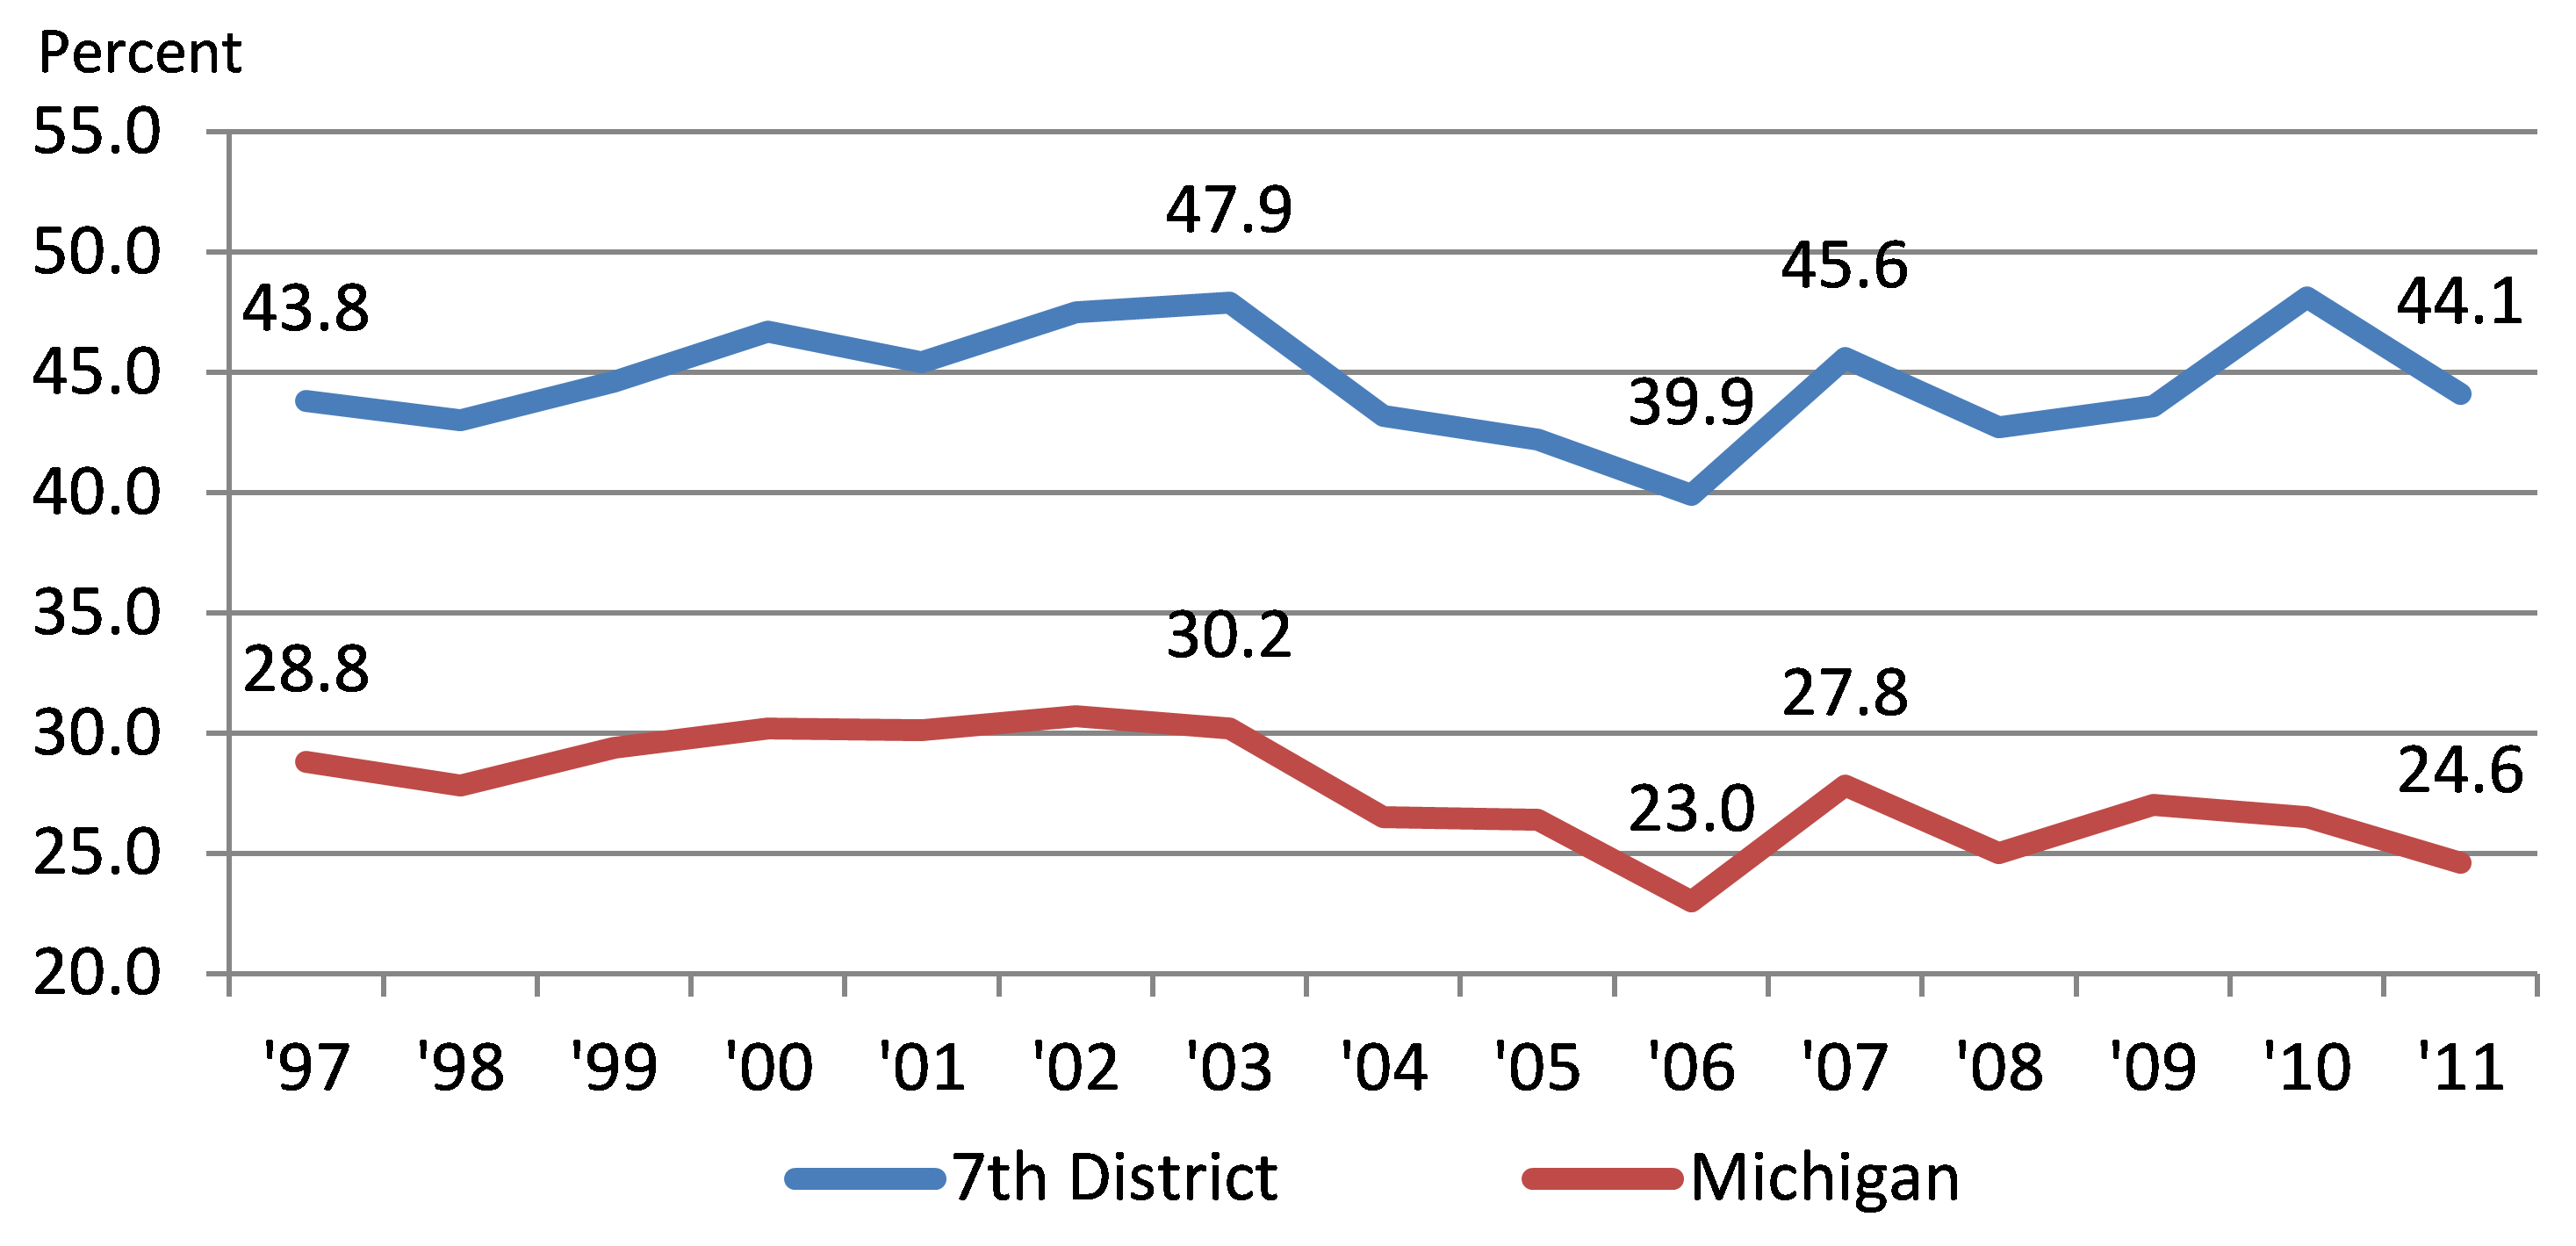
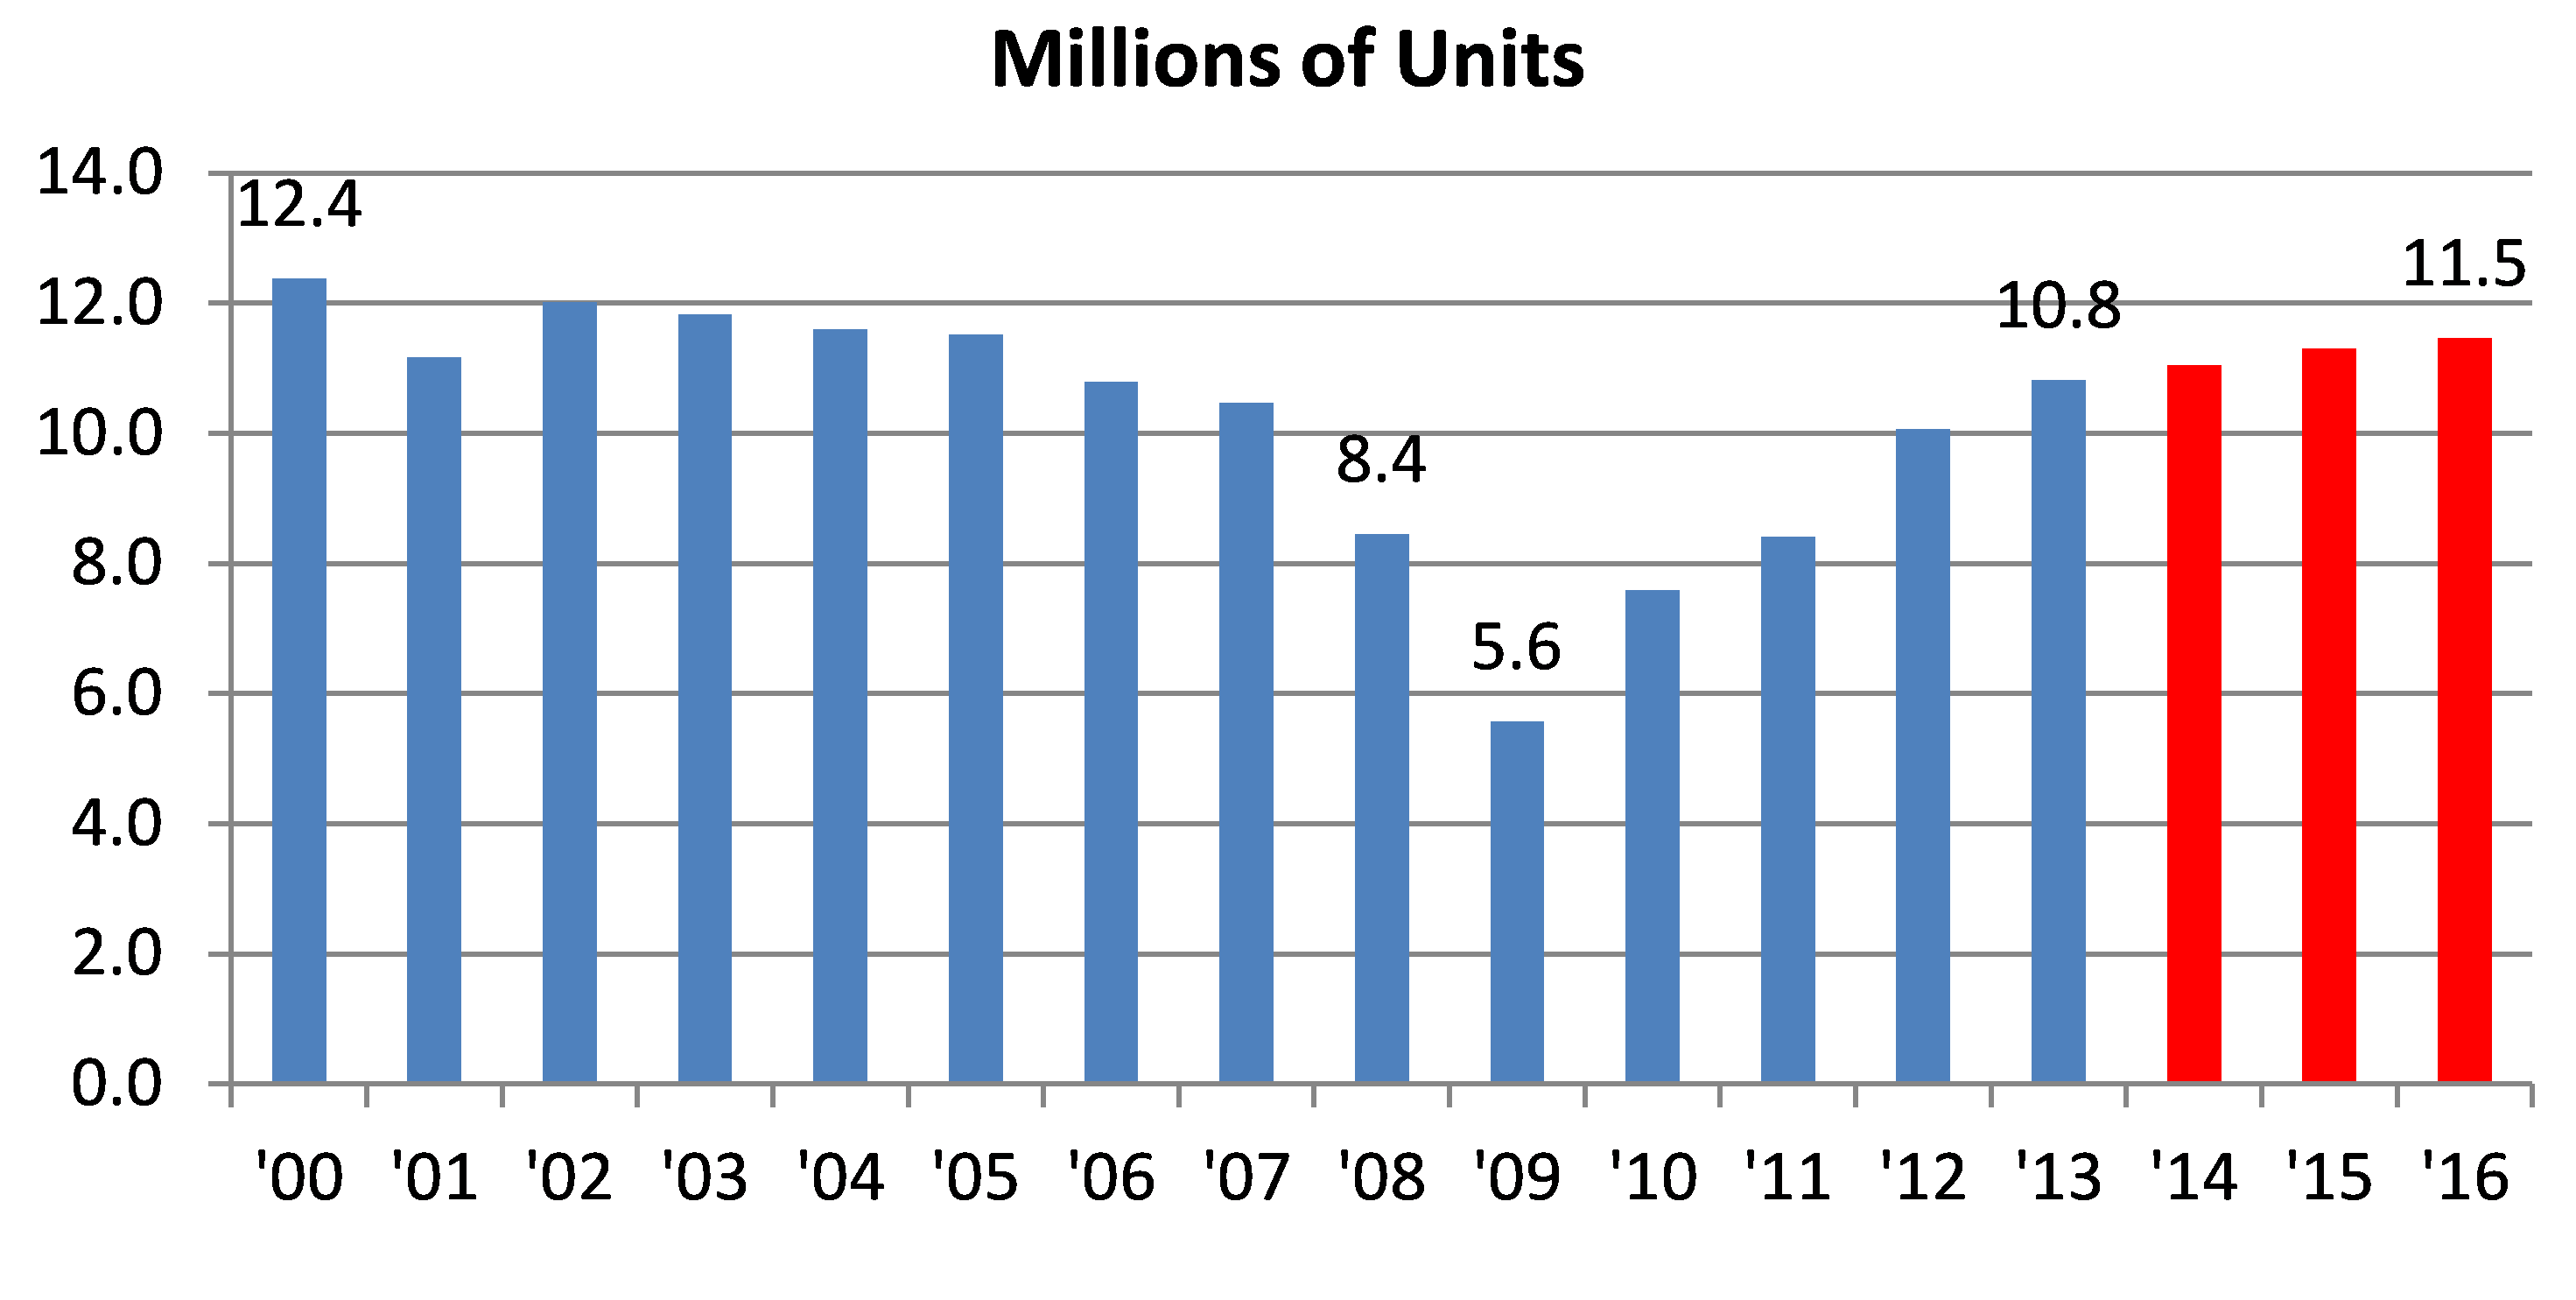
Chart 6 shows that U.S. light vehicle production fell about 6.0 million units from the peak in 2000 to just 5.6 million units in 2009. Between 2009 and 2013, light vehicle production rebounded by 5.2 million units or 94%. This would do a lot to explain the District’s manufacturing growth over the past four years.
6. U.S. light vehicle production
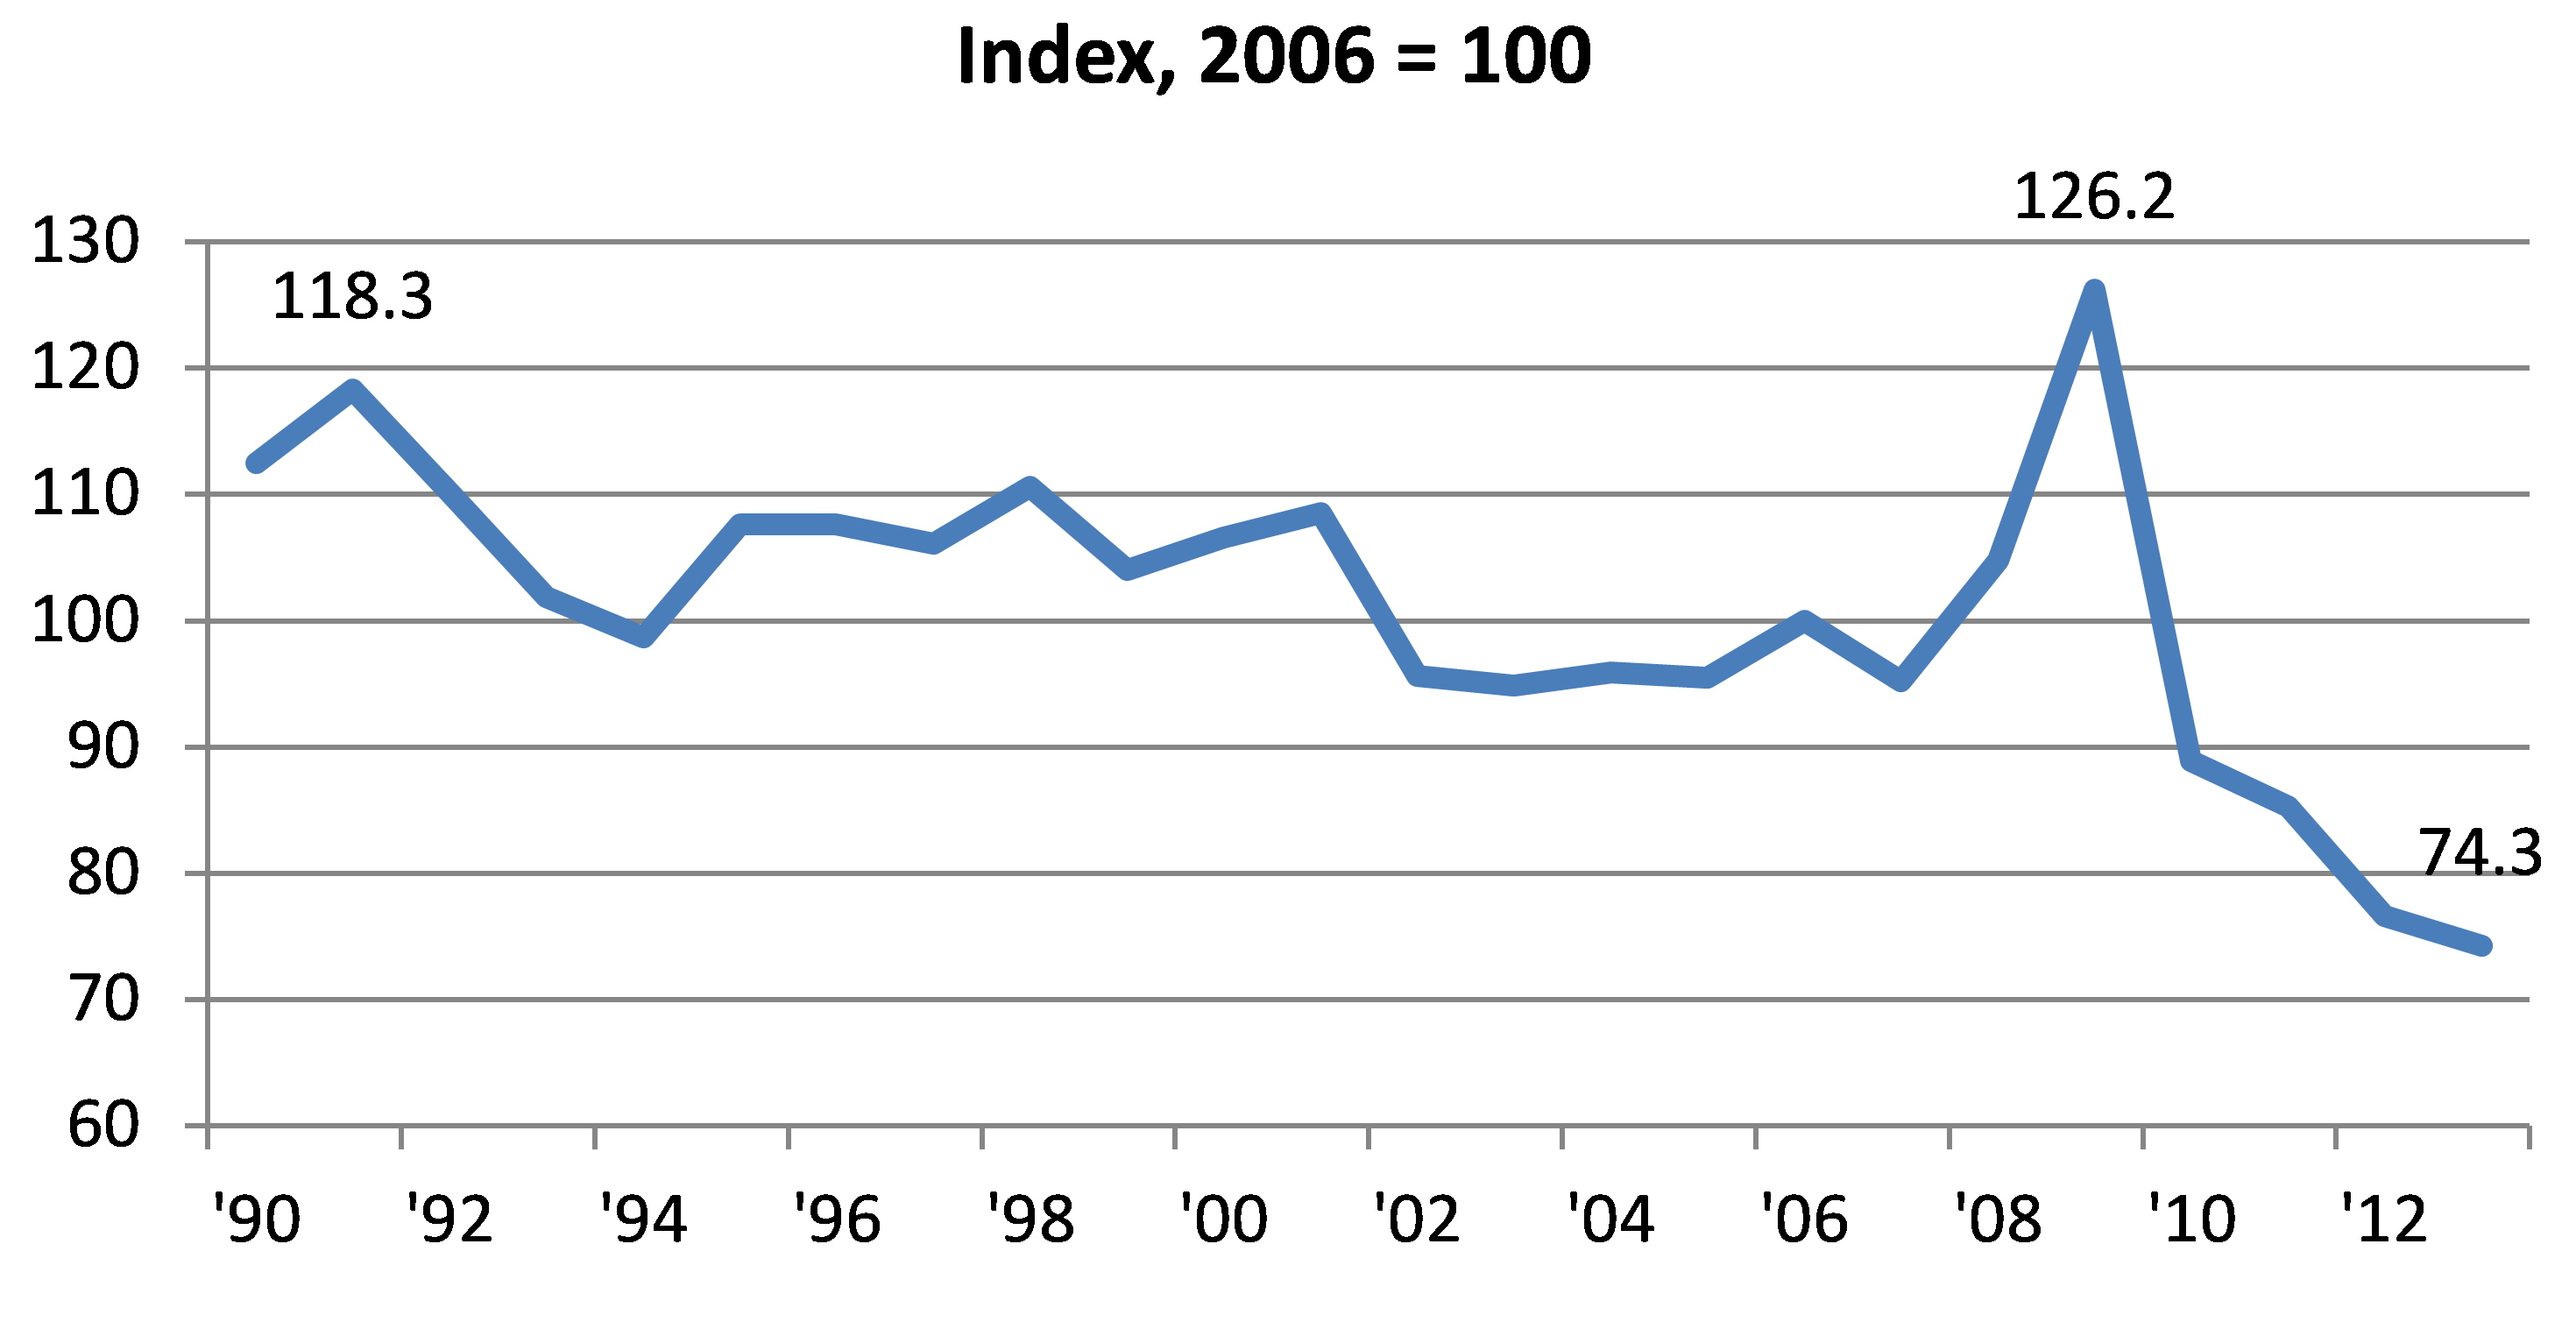
Motor vehicle and parts employment has been declining for a number of years, due to outsourcing and increased use of automation in vehicle assembly plants. As Chart 7 shows, a simple calculation of dividing the total U.S. motor vehicle and parts employment by the number of light vehicles produced in the U.S. reveals that in 2013, there were only about 74% of the number of employees it took to produce the same number of vehicles in 2006. Since the economy started to recover in 2009, the motor vehicle and parts sector has seen an increase of about 140,000 employees, while increasing total vehicle production by 5.2 million units.
7. Employees per vehicle produced
Based on projections from Ward’s Automotive, light vehicle production is expected to increase another 800,000 units by 2015. If these projections are achieved, this will certainly help the District’s overall economic output, but its impact on total employment will be more modest than that seen from 2009 to 2013. Still, we can expect the overall economic impact from the growth in production to be positive for the Seventh District and Michigan.


