The Energy Industry’s Positive Contribution to the U.S. Economy
The U.S. Census Bureau announced in August in its U.S. International Trade in Goods and Services Report for June 2013 that the petroleum deficit had fallen to its lowest level ($17.4 billion) since August 2009 ($17.9 billion).1 This decline was the result not only of declining imports but also of an increase in exports. The petroleum trade deficit was reported to be down $34 billion dollars, year over year, through June. The use of new technology and techniques to extract natural gas and other petroleum products has allowed the U.S. to go from being a net importer of refined petroleum to being a net exporter. What impact will this new technology have on U.S. economic growth in the years to come?
According to an August 18, 2013, Financial Times article, “the value of petroleum and coal exports more than doubled from $51.5 billion in the year to June 2010 to $110.2 billion in the year to June 2013.” To look deeper into the role the U.S. will play in the future in the global energy markets, we constructed a combined energy trade category using U.S. Census Bureau’s trade data by North American Industry Classification System (NAICS), among other sources.2 Chart 1 shows just how much the balance in energy related trade has changed since 2002 by quarter.
Chart 1. Total energy trade balance
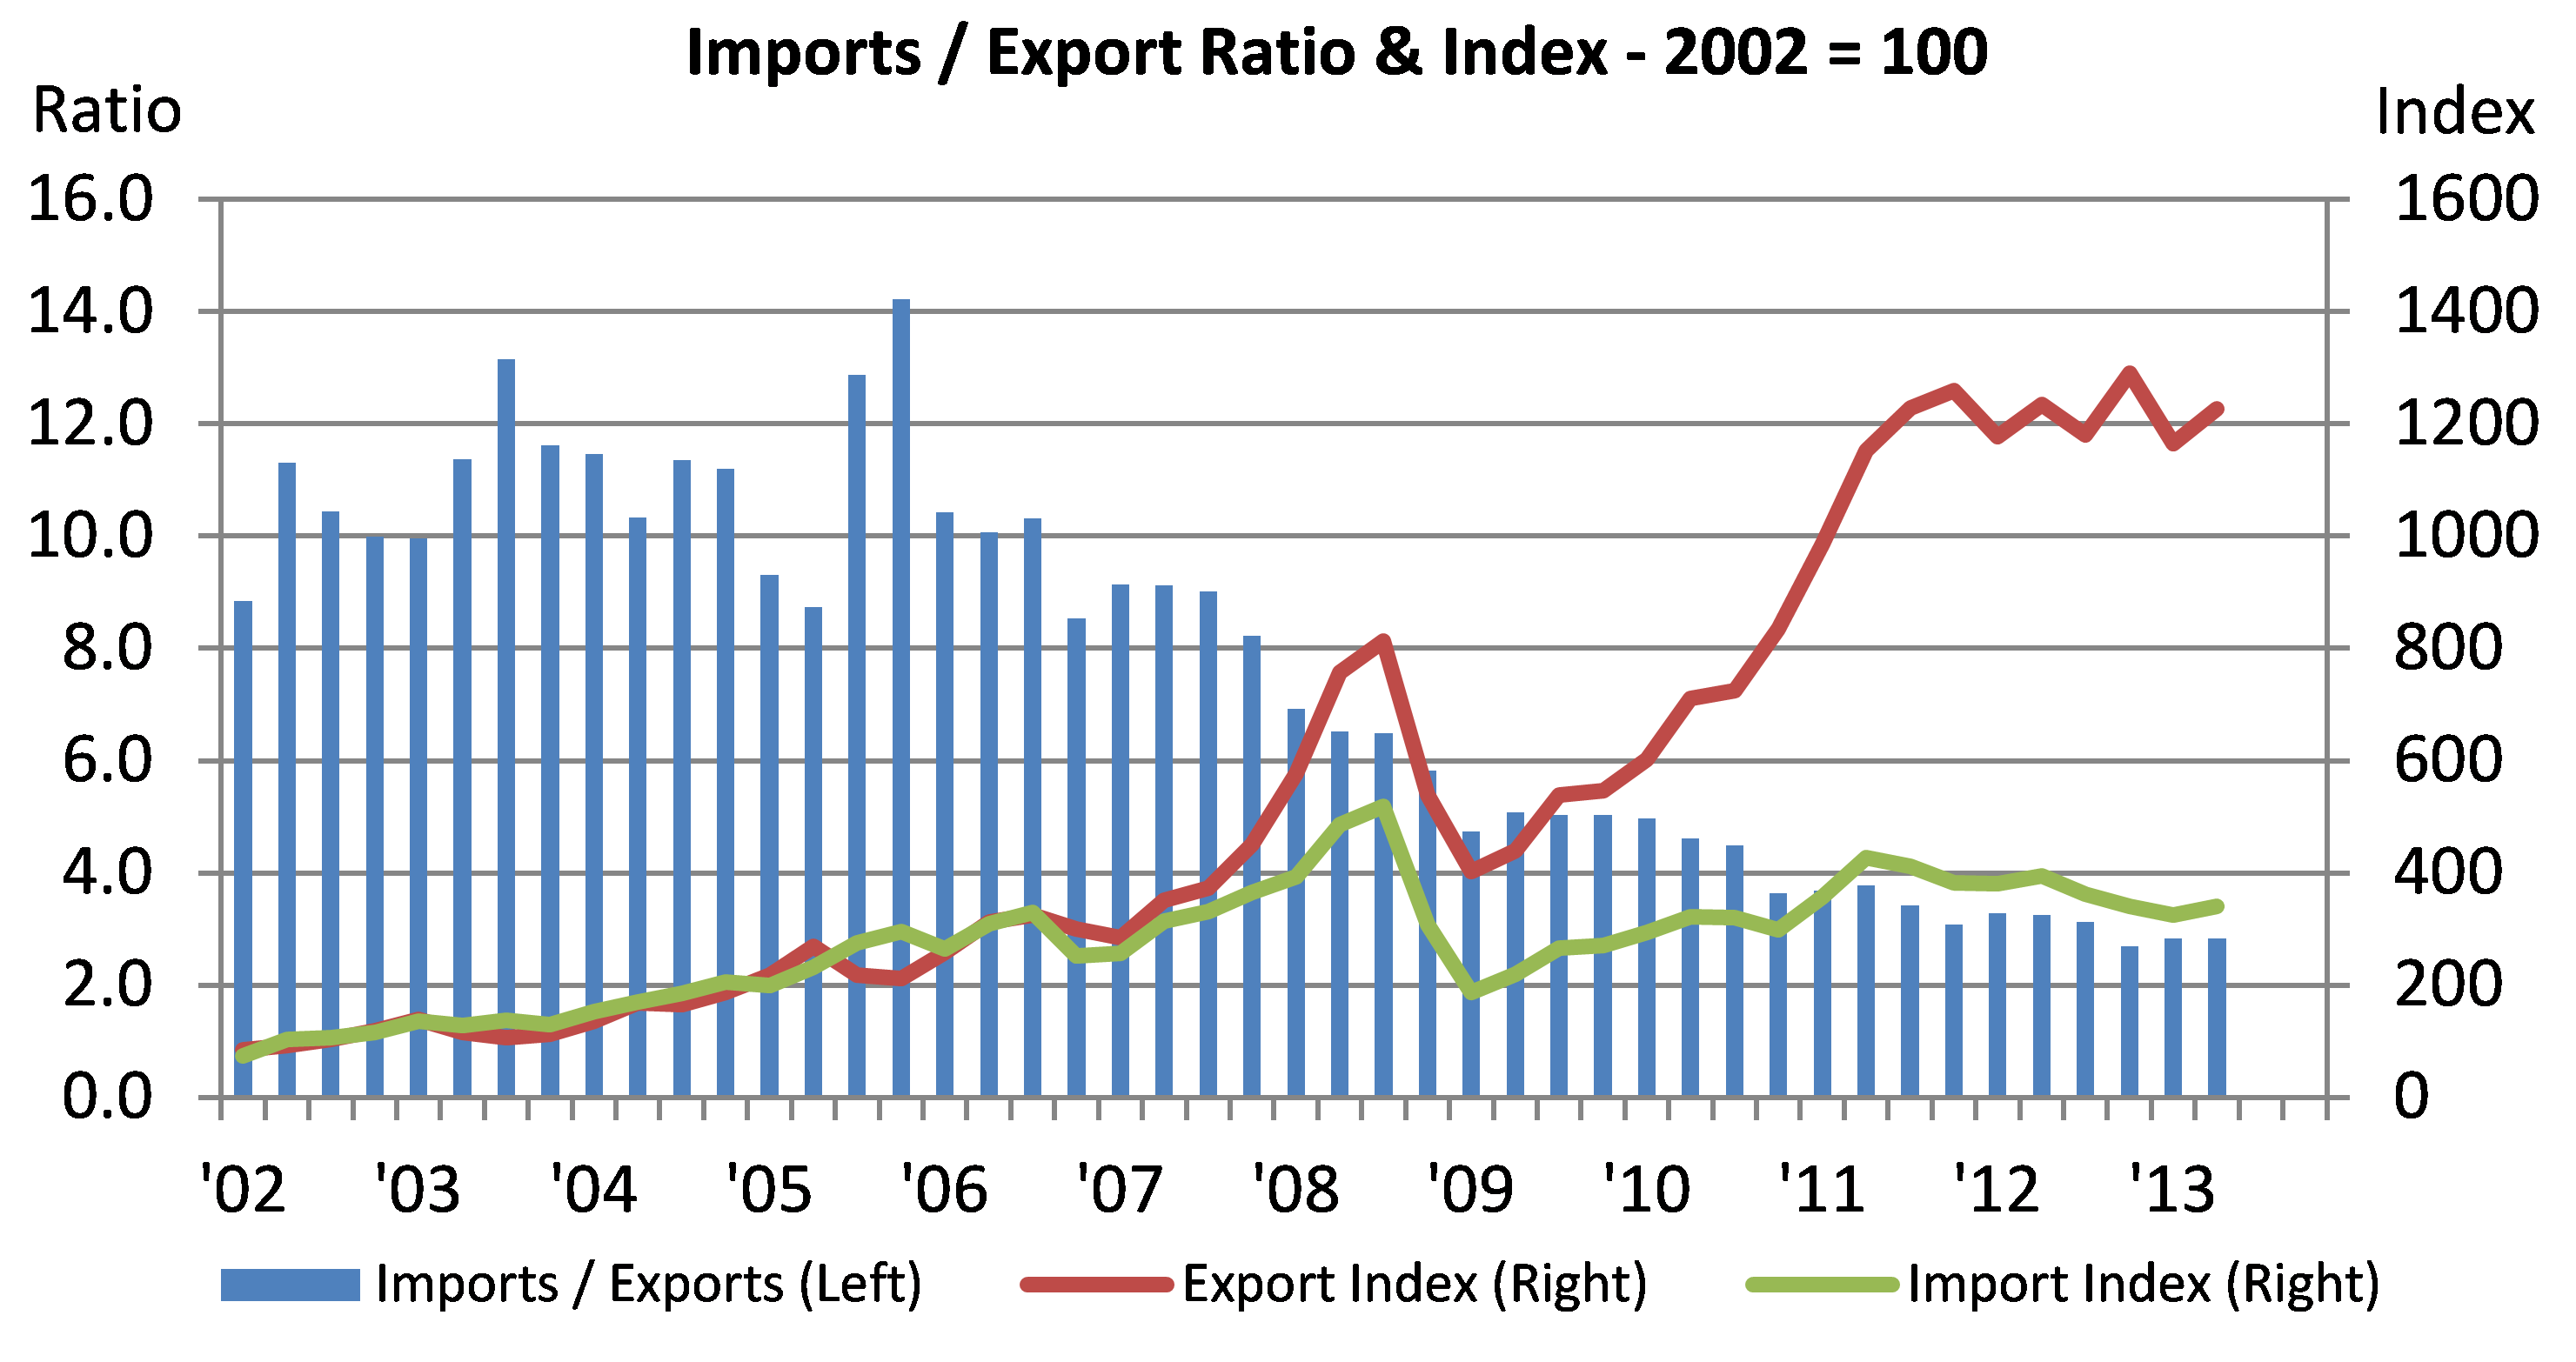
Based on this total energy trade category, the United States imported about 10 times more petroleum related products than it exported in 2002, as indicated by the bars in the chart. This ratio of imports to exports grew to as high as 14 in the fourth quarter of 2005. The lines in the chart show that this happened while exports and imports grew by relatively the same ratio compared with 2002. However by 2006:Q4, this relationship started to change. Even with the sharp decline in both imports and exports during the recession in 2008, the ratio of imports to exports continued to decline. The latest data for 2013:Q2 indicate that the U.S. is exporting about 12 times more energy related products than it did in 2002, bringing the import to export ratio down to 2.8. This represents a 360% reduction in the trade deficit for these combined categories, with almost all of that achieved in the past six years.
According to the U.S. Energy Information Administration (EIA), the U.S. is one of the world’s leading producers of crude oil and petroleum products. Table 1 below shows the total value of exports and imports by NAICS classification and their share by category for calendar years 2002 and 2012.
Table 1. Total value of exports and imports by NAICS classification
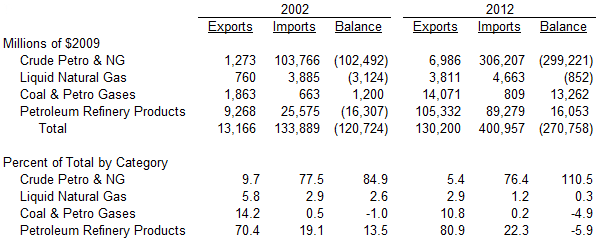
Source: U.S. Census Bureau USA Trade Online database.
Although the deficit did grow from 2002 to 2012, in 2002 crude petroleum and natural gas accounted for almost 85% of the total trade deficit, while petroleum refinery products accounted for about 70% of exports. Also in 2002, coal was the only product of the four NAICS classifications that made a positive contribution to the trade balance.3 By 2012, crude petroleum accounted for almost the entire energy-related trade deficit, while the contribution to the deficit from liquid natural gas had fallen to just 0.3%. In addition, petroleum refinery products’ positive contribution to the trade balance jumped past coal’s to reach 81% of the total energy-related export products.
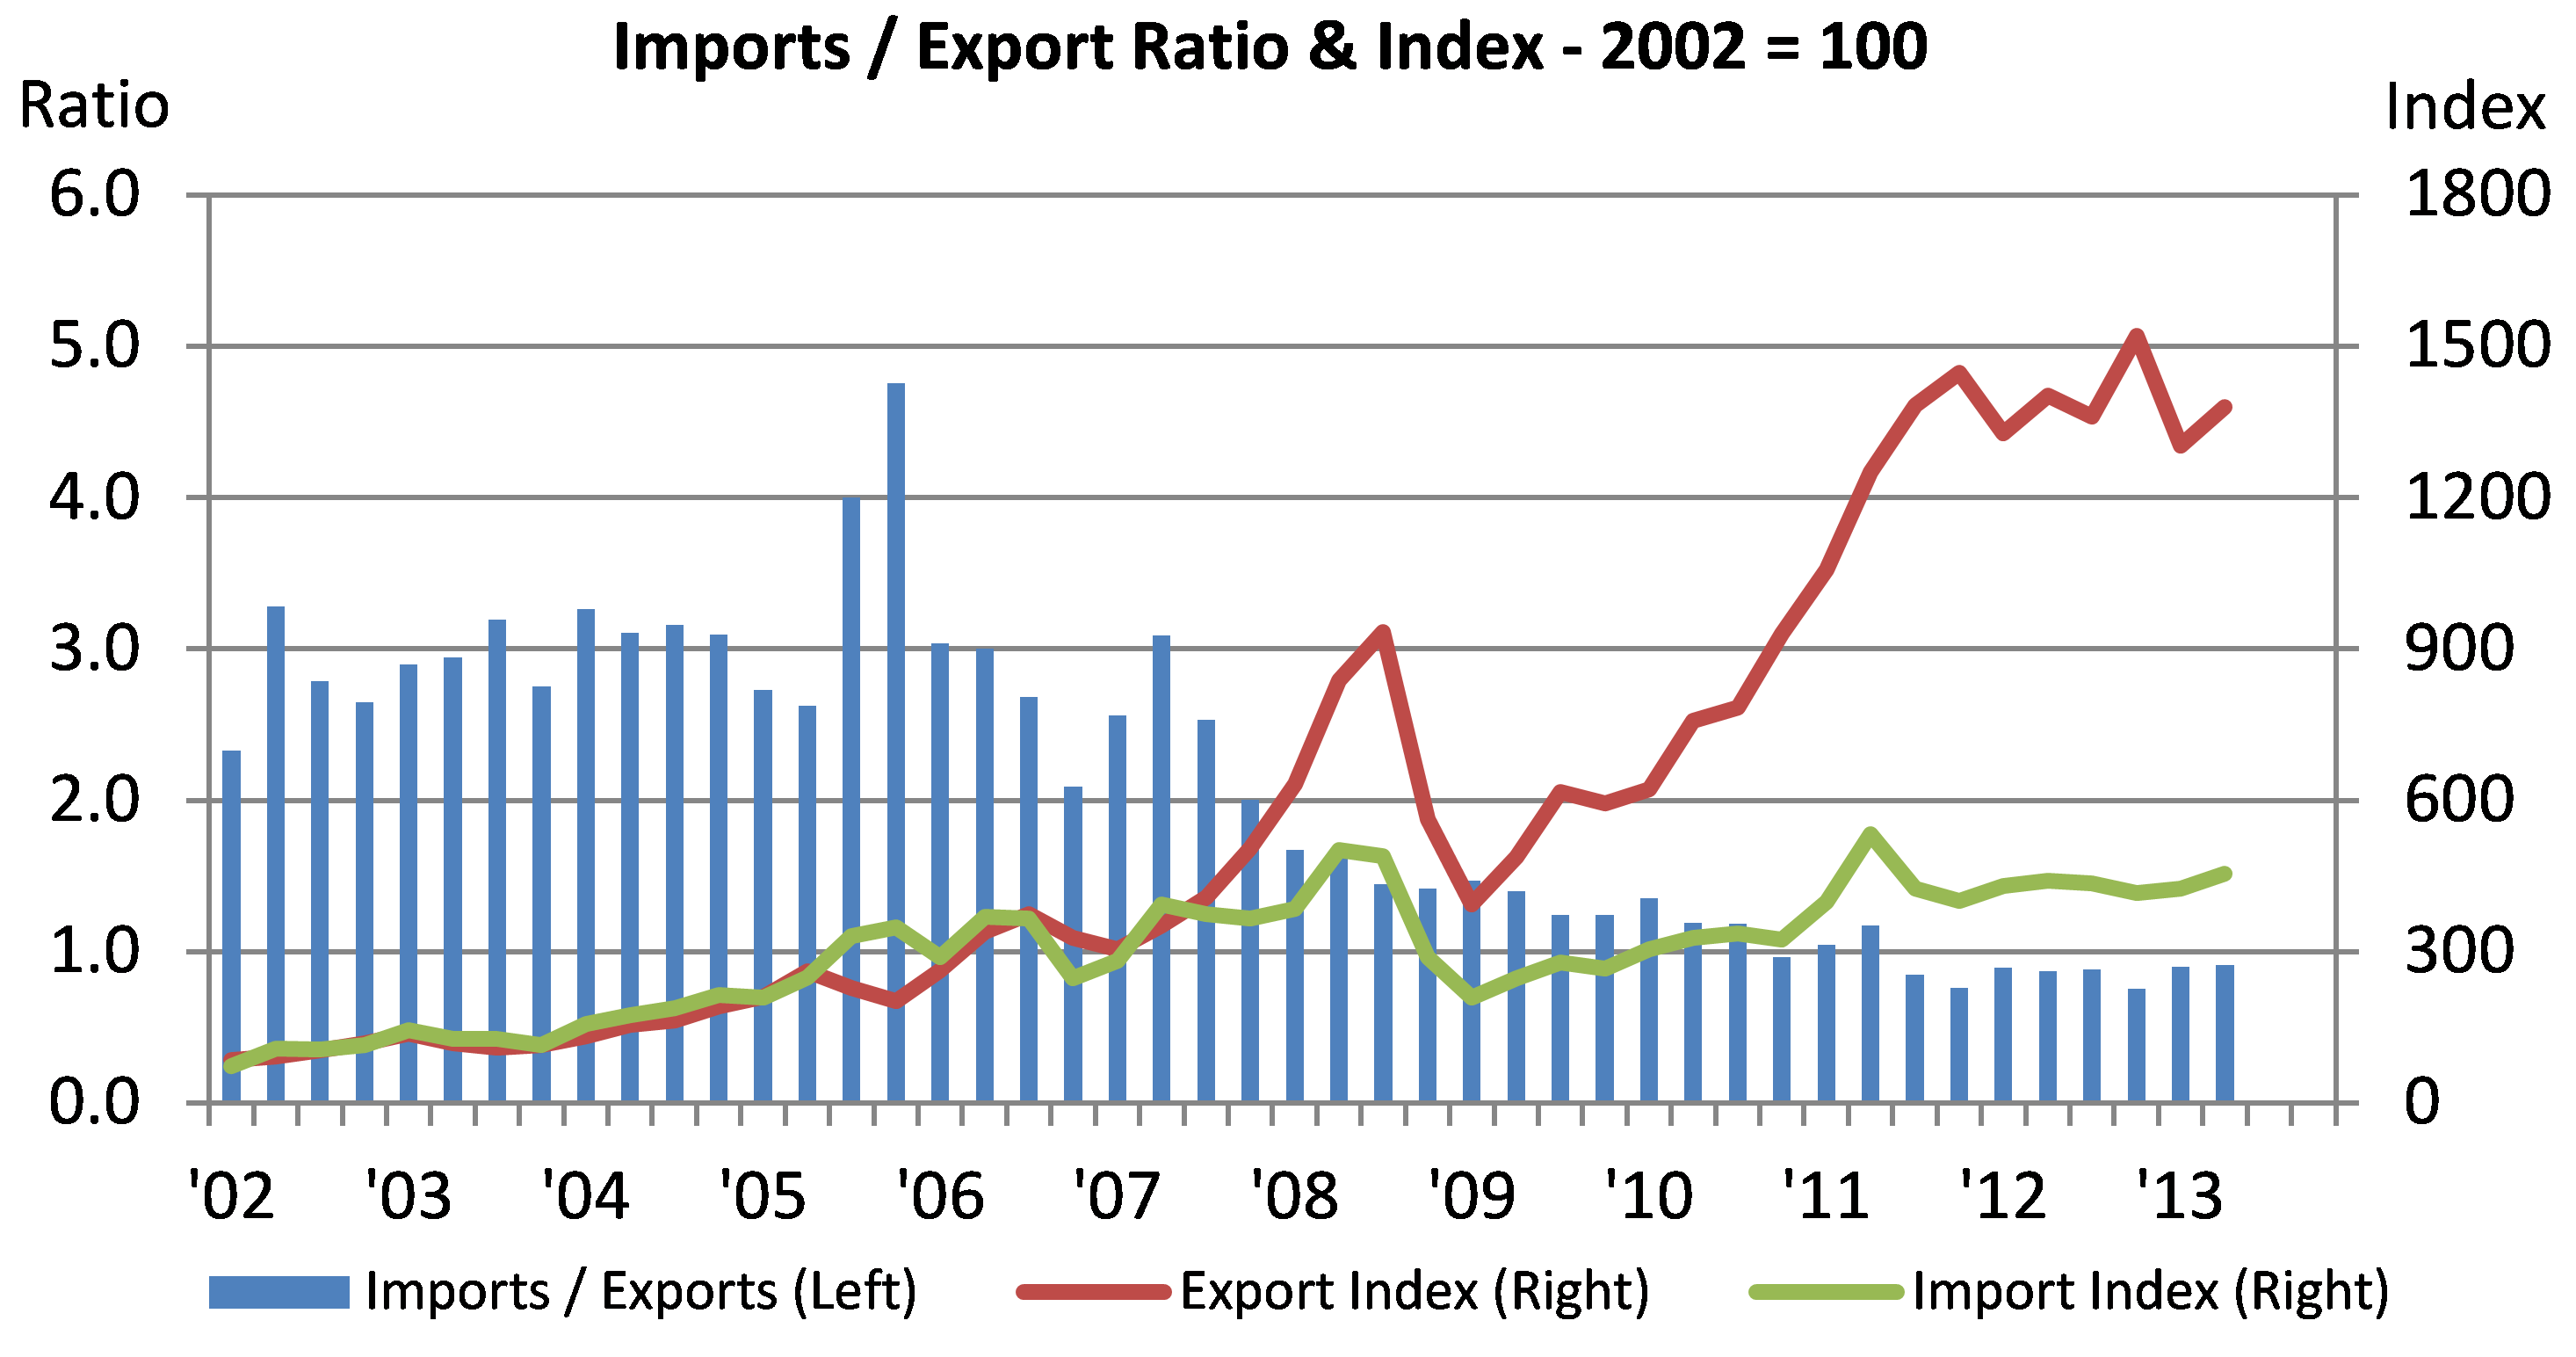
So far in 2013 the picture has improved even more. The following charts show just how much faster the exports of each of these energy-related products have grown relative to imports to the degree that three of the four categories shown here had a positive contribution to the trade balance in Q2 2013 evidenced by the exports to imports ratio of less than one. In fact, in Q2 2013 the U.S. exported three times more liquefied natural gas than it imported. In addition, the exports of petroleum refinery products have grown by an astonishing 1,380% since 2002.
Chart 2. Crude petroleum and natural gas
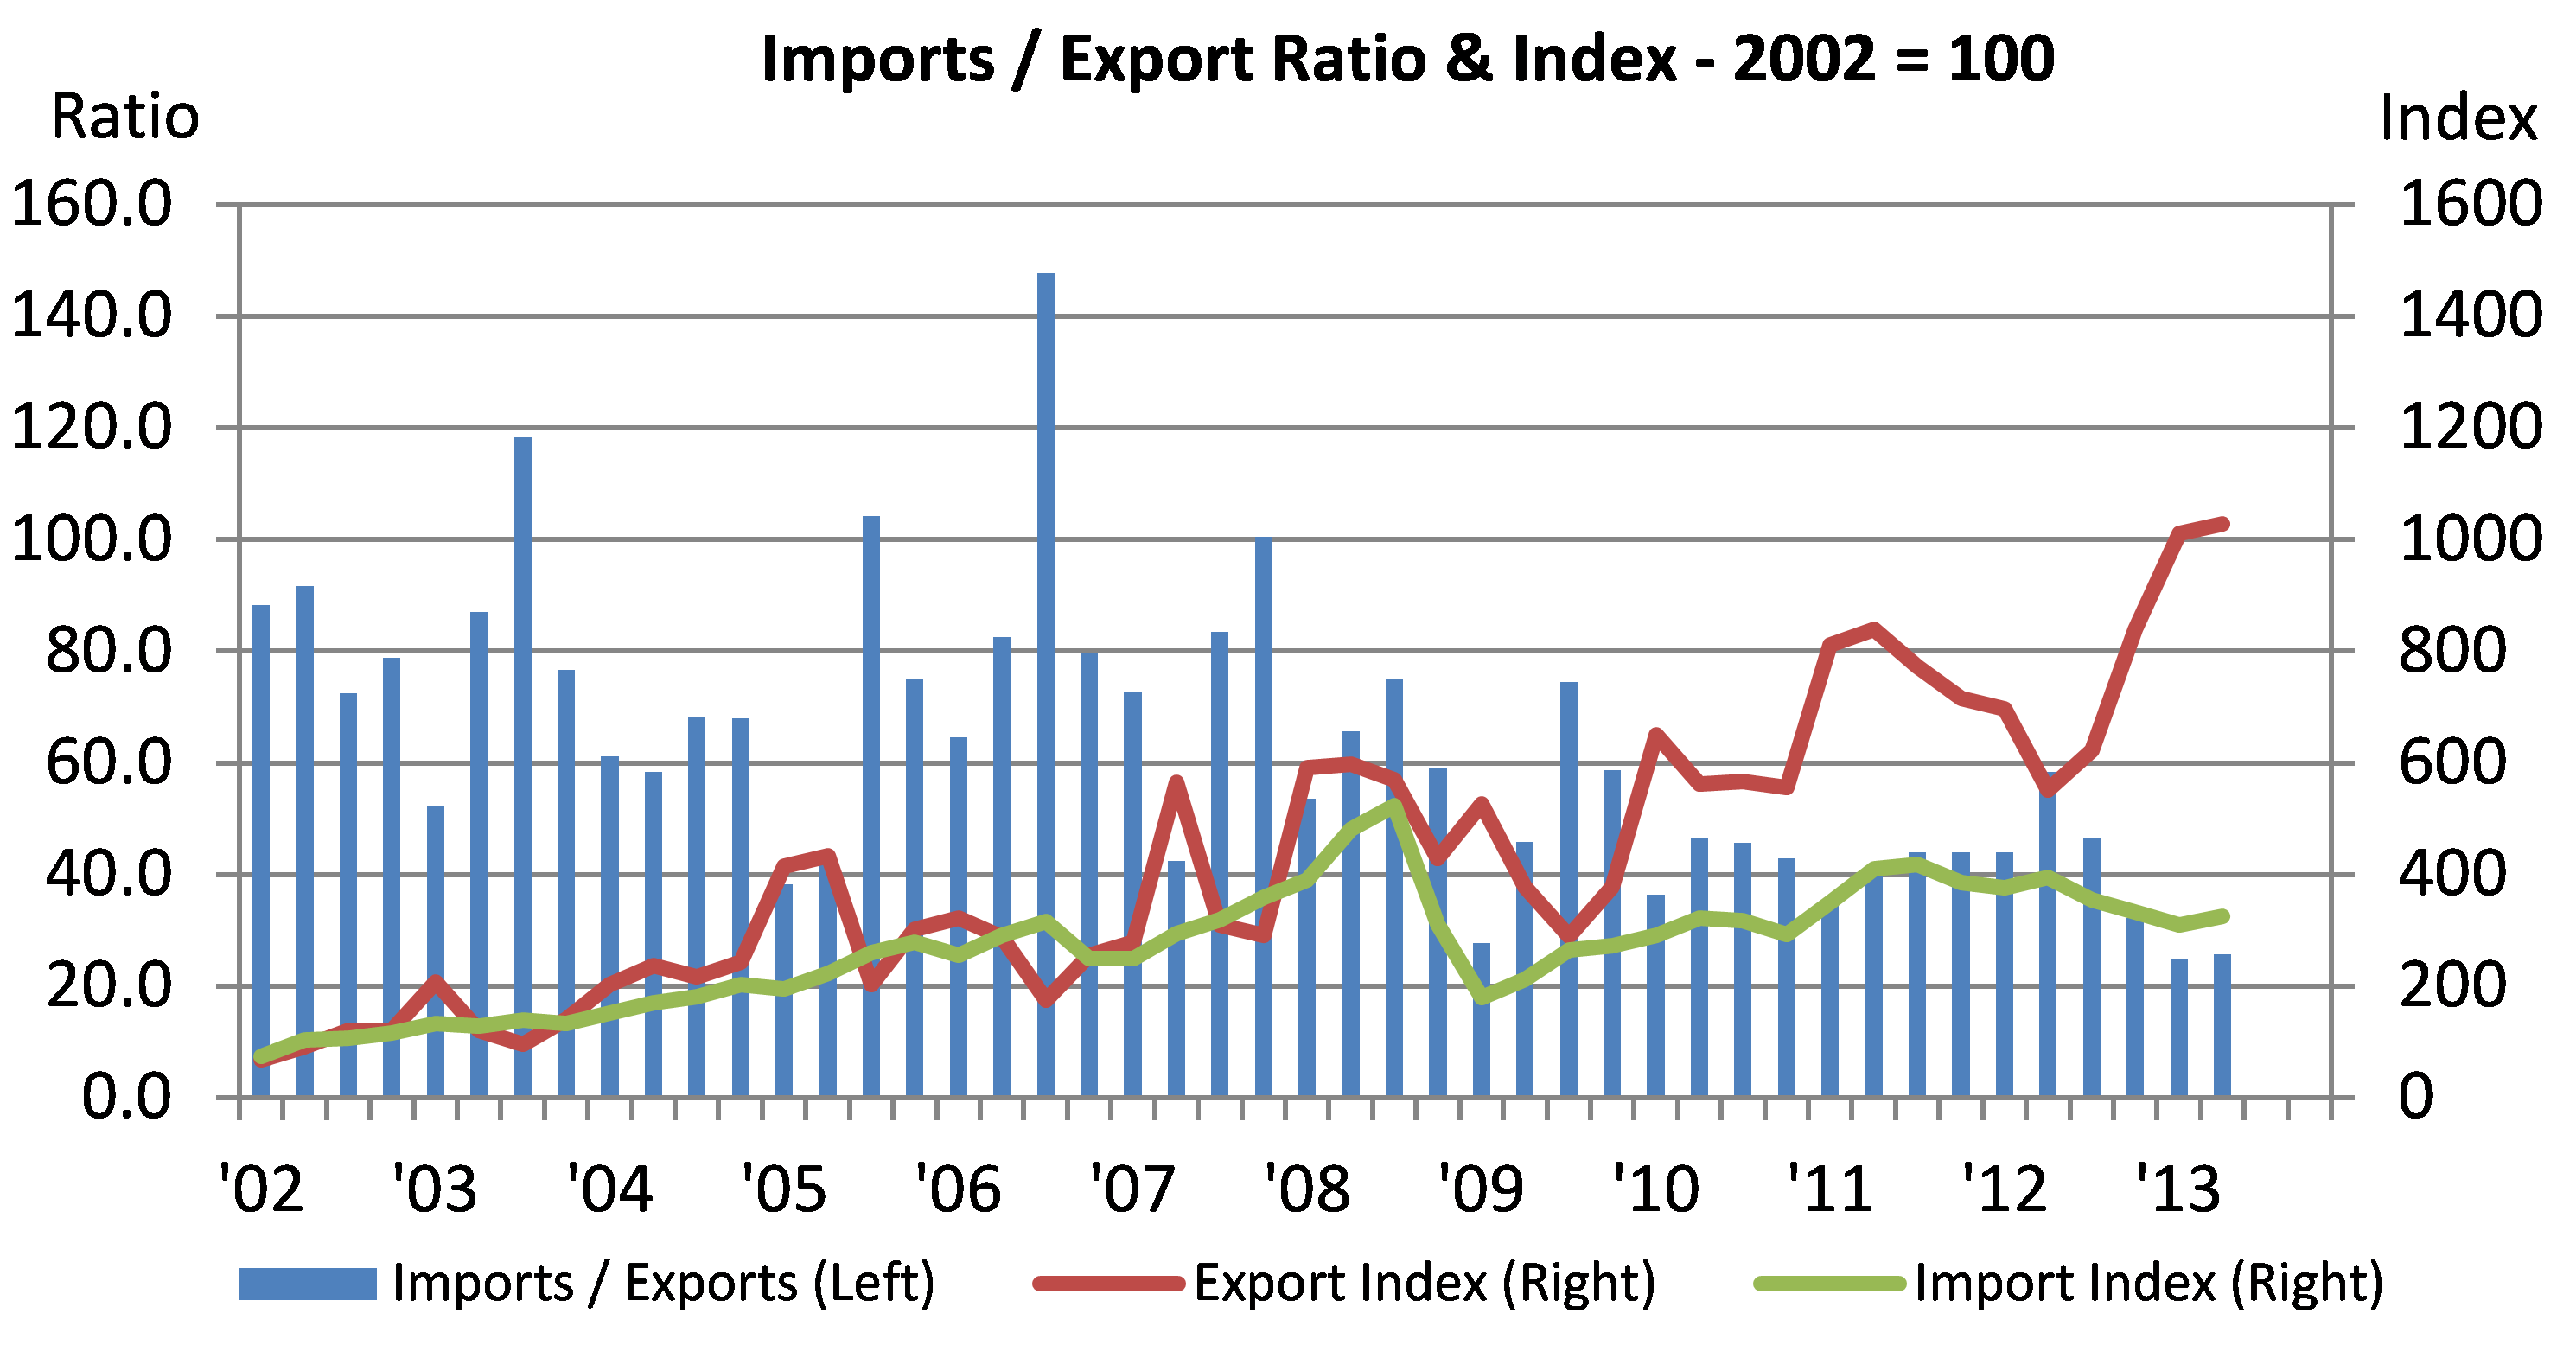
Chart 3. Liquefied natural gas
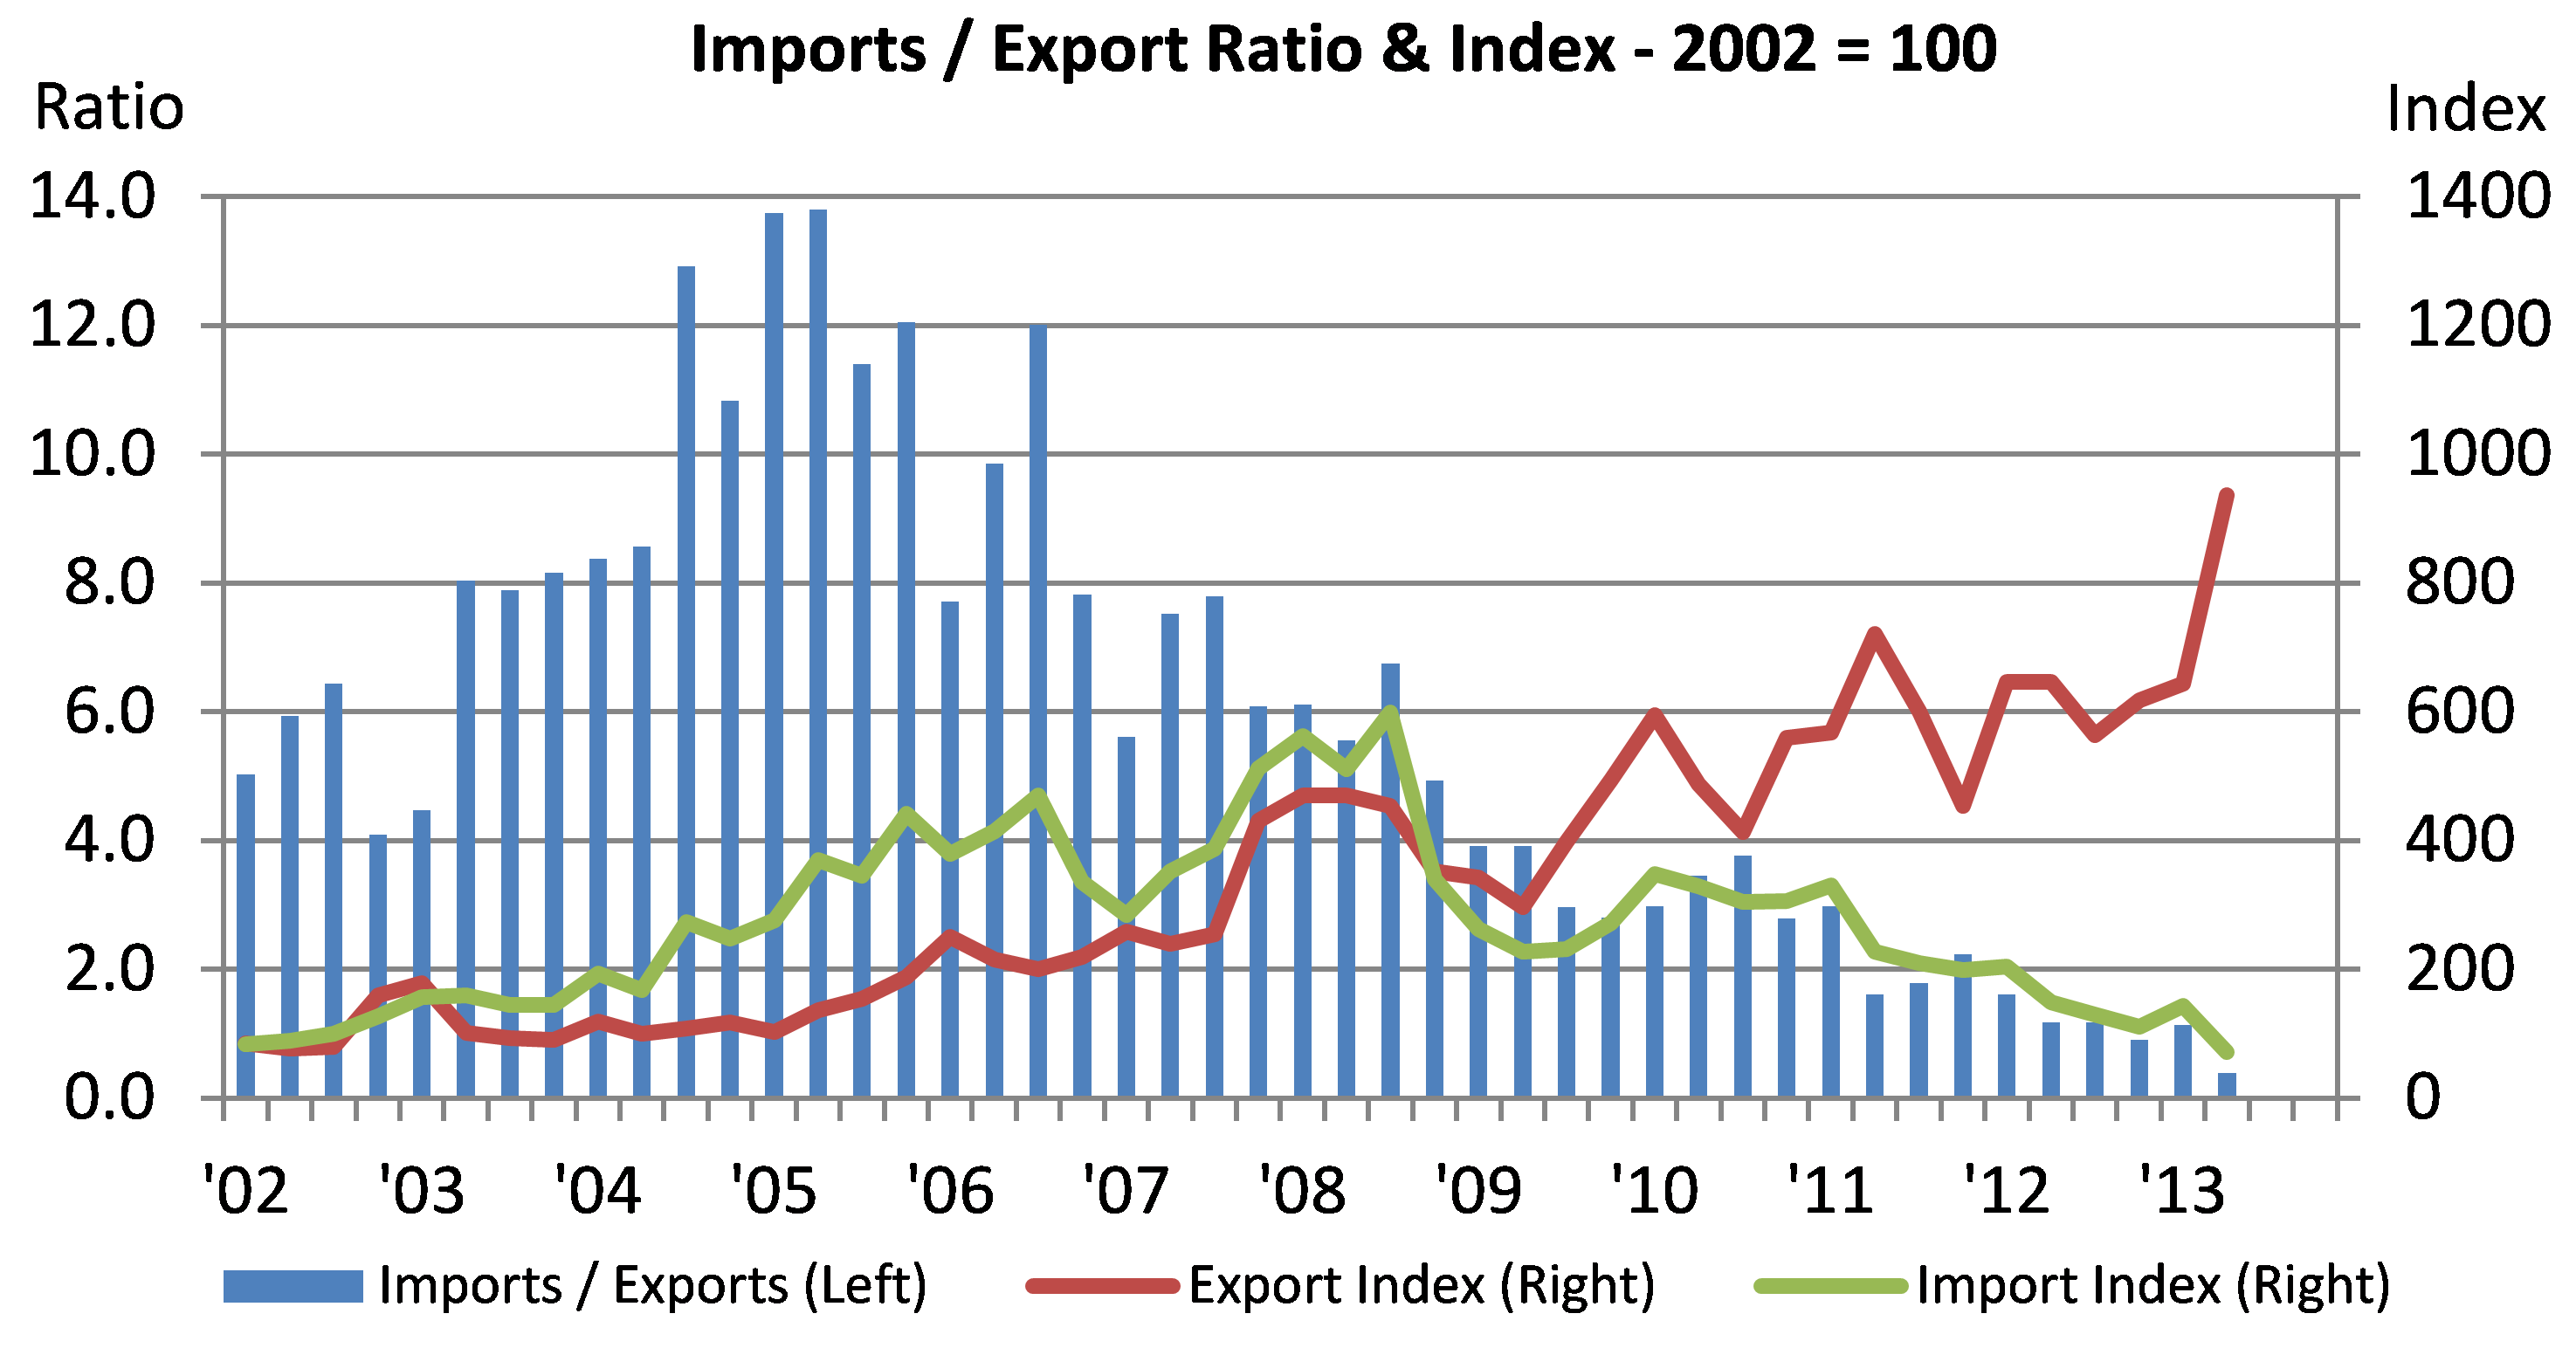
Chart 4. Coal (excluding Anthracite) and petroleum gases
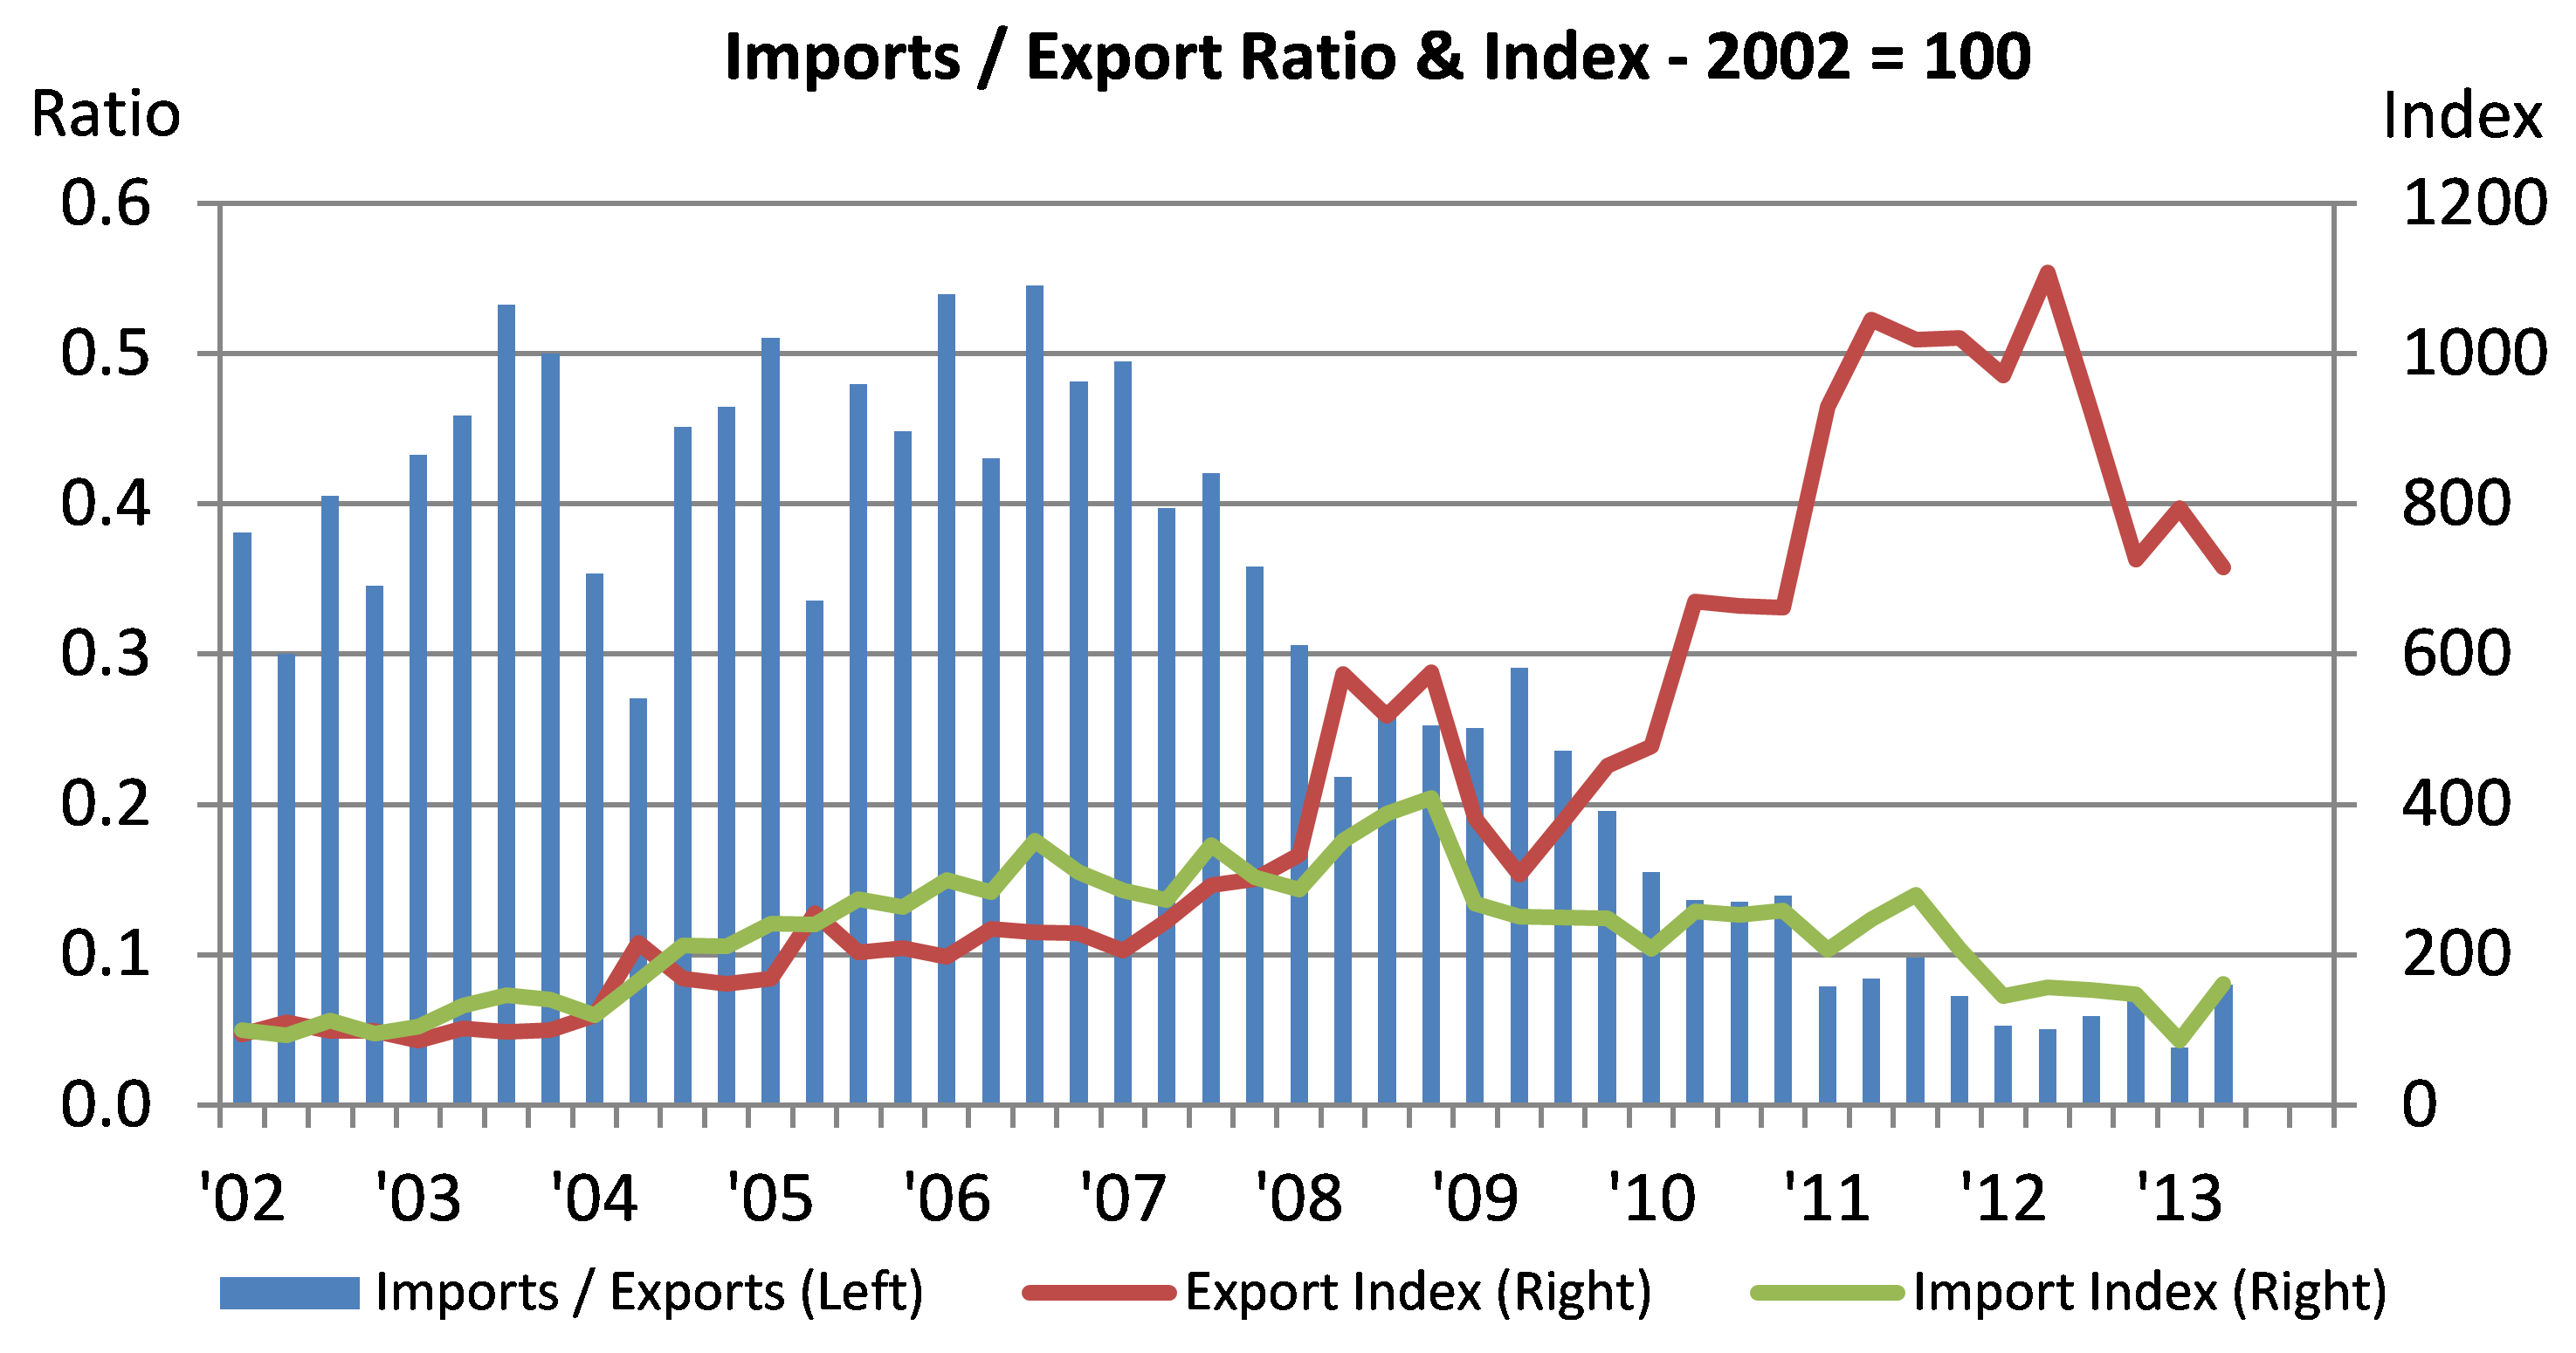
Chart 5. Petroleum refinery products
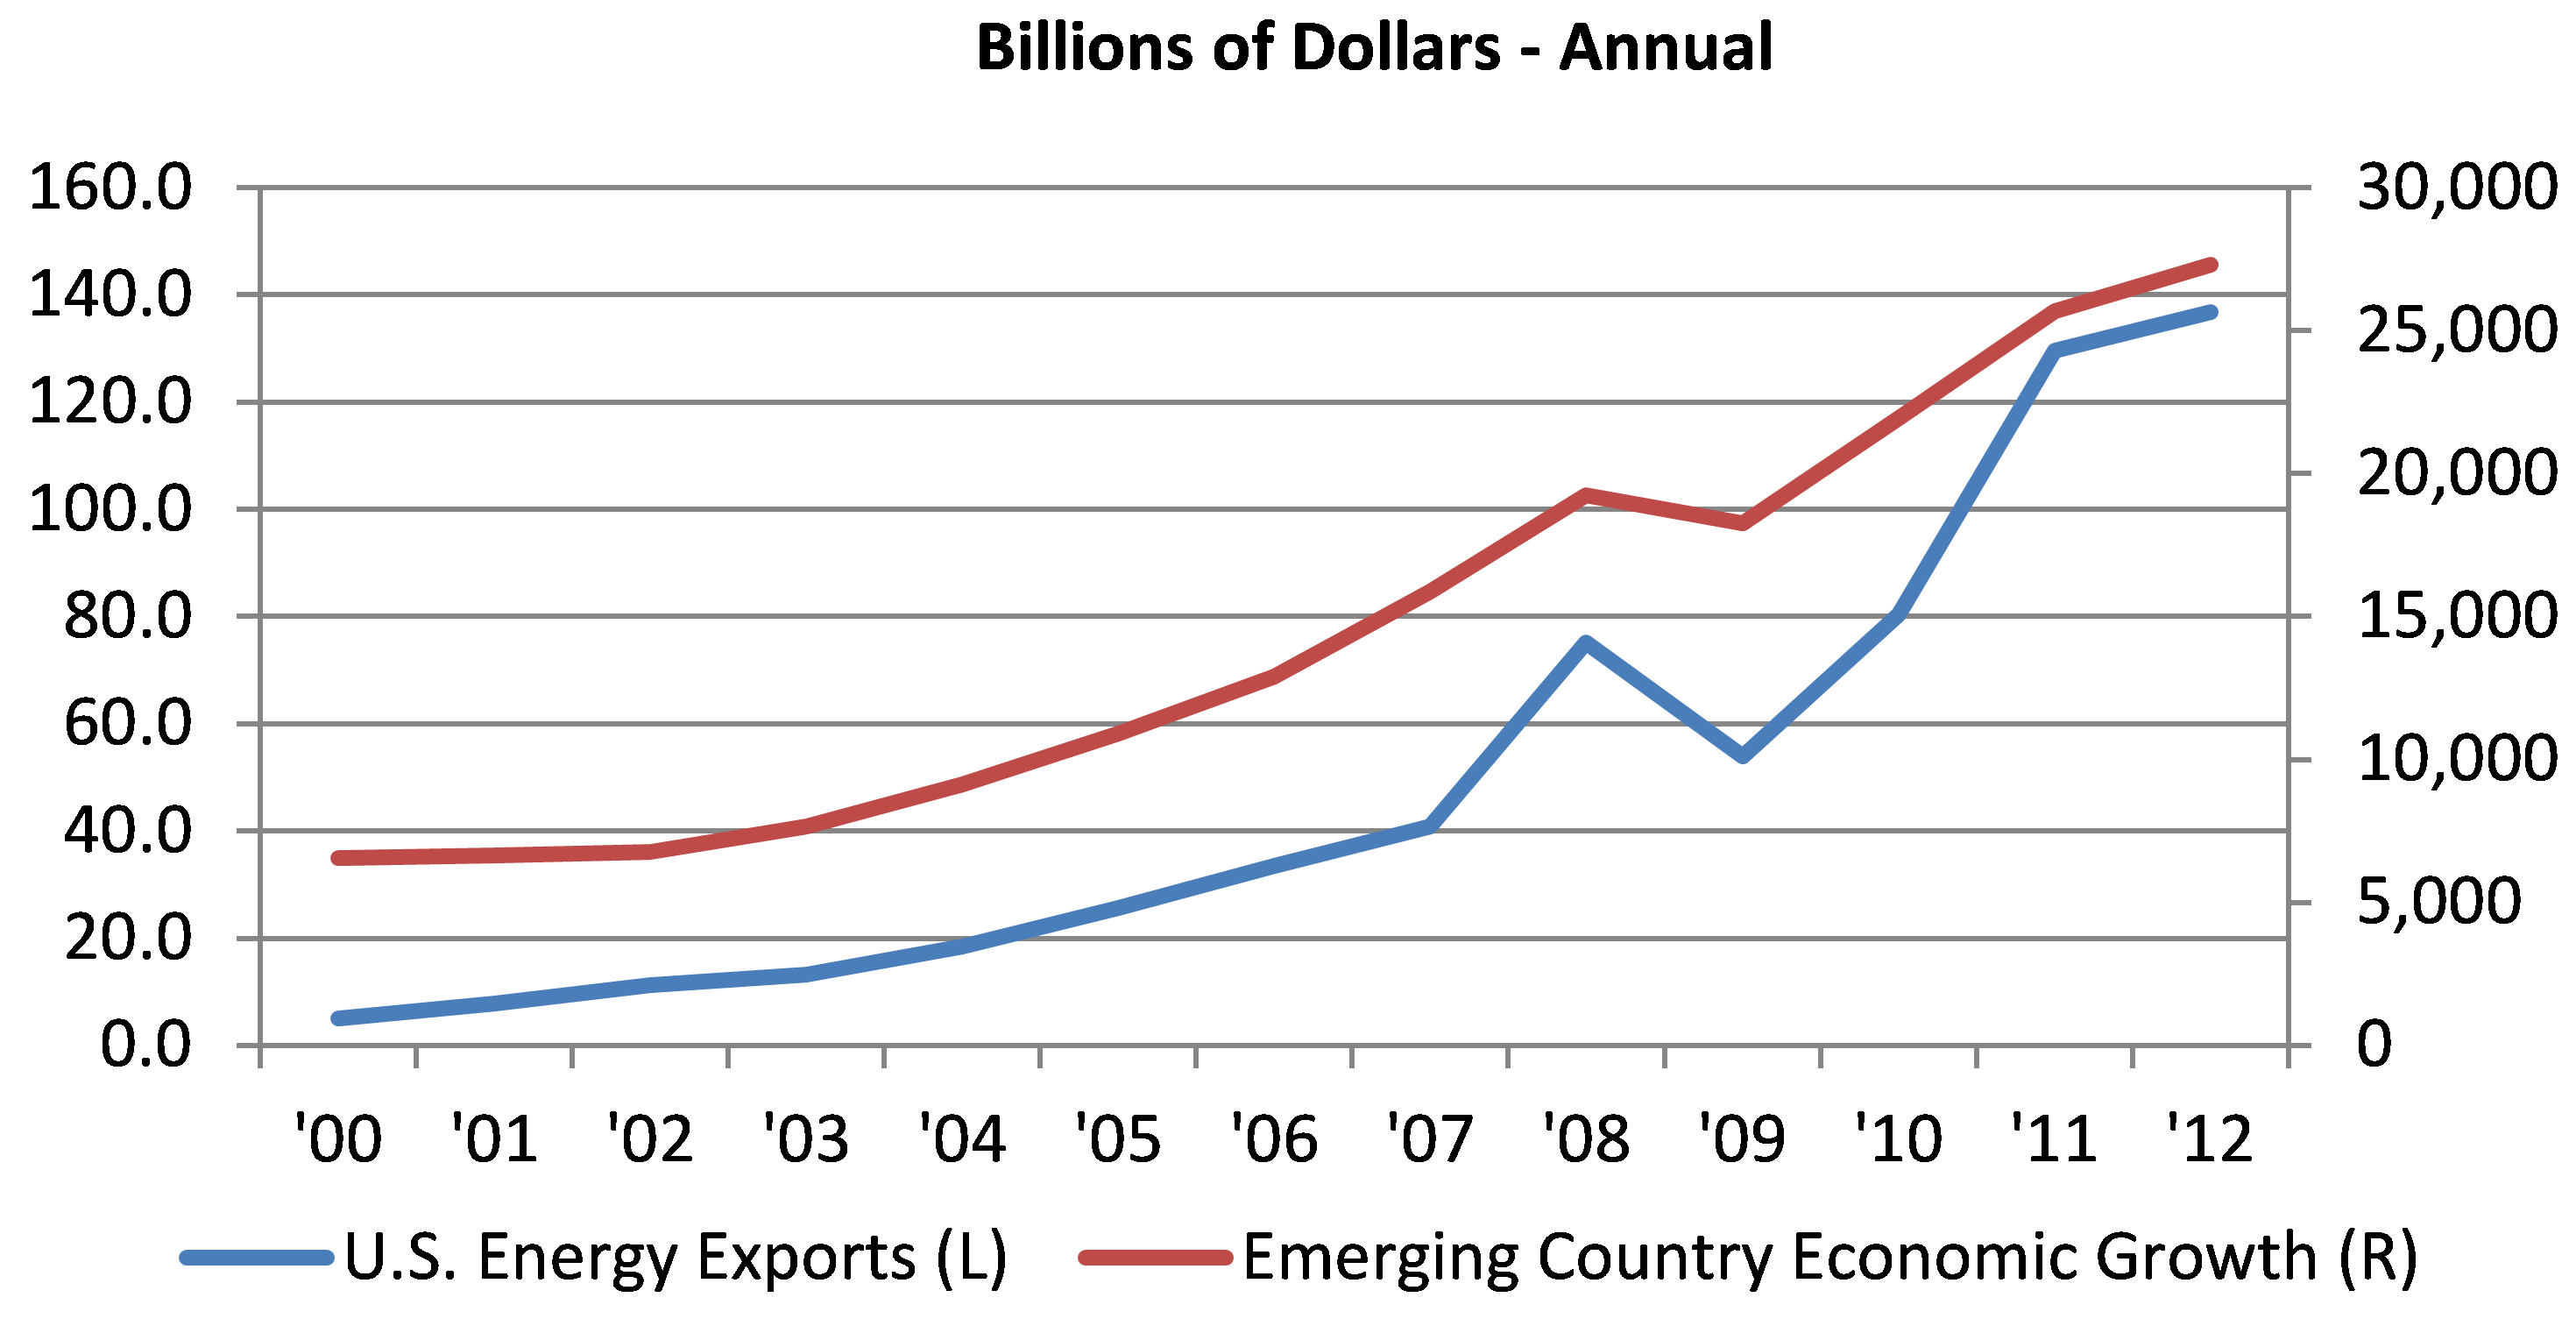
Coal exports, which had grown 1,000% by 2011, around 700%have slowed more recently, likely reflecting slowing economic growth in China and falling prices in Asian markets.4 As the chart 6 suggests, U.S. energy exports and the pace of emerging market growth have gone hand in hand in the past.
Chart 6. Emerging country growth and U.S. energy exports
Given the somewhat slower global growth expectations for this year and next, it is reasonable to assume that U.S. energy exports are being somewhat limited, by the global slowdown of emerging economies, in particular, implying that the U.S. trade deficit reduction might otherwise have been even greater this year.
For January through June 2013, the petroleum trade deficit was reported to be down $34 billion dollars, year over year. If we include coal and refined petroleum products, the trade deficit decline was somewhat smaller at $31 billion, when adjusted for inflation, mostly due to a slowing global demand for coal. However, this trend is expected to reverse itself in the near future, according to the EIA International Energy Outlook for 2013. The EIA forecasts that global demand for all types of energy will continue to grow at an annual rate of 1.5% for the next 30 years; and that, by 2015, the world’s demand for energy will increase by 9.1% compared with 2010 and an additional 10.1% by the year 2020.5 Also, by 2015, global demand for natural gas and coal is expected to increase by 9.3% over 2010 levels and an additional 9.5% by 2020. All of this is good news for the U.S. trade balance, because most of the growth in demand is expected to come from other countries. Based on EIA’s 2013 projections, non-OEDC countries will account for 86% of the total increase in energy consumption between 2015 and 2040.
Through the first two quarters of 2013, the U.S. economy is thought to have grown by just $227.2 billion compared with the first half of last year, while energy trade accounted for a $31 billion reduction in the trade deficit for the same period. This means that through the first half of 2013, while the total U.S. economy is estimated to have grown by just 1.5%, the increase in energy exports accounted for 13.6% of total growth in this period by significantly reducing the trade deficit.
Since 2008, the global demand for energy has continued to increase; it is presently expected to grow by 1.2% in 2013 compared with just 0.7% in 2012. This projected increase in global demand for energy should contribute further to economic growth in the U.S. through additional reductions in the trade deficit.
Footnotes
1 The petroleum products aggregated in the end-use commodity classification system include virtually the same energy related products as those aggregated in the Standard International Trade Classification (SITC). The end-use petroleum products, however, include some products such as ethane, butane, benzene, and toluene which are included in “Manufactured Goods” in the SITC.
2 The “Total Energy Trade” category contains the following NAICS series: Crude Petroleum and Natural Gas (211111), Liquid Natural Gas (211112), Coal (excluding Anthracite) and Petroleum Gases (212112), and Petroleum Refinery Products (324110).
3 Coal (excluding Anthracite) and petroleum gases will be referred to as coal throughout the remainder of the article.
4 Chen, Sarah. “China Coal Prices Fall to a Four-Year Low Amid Economic Slowdown” Bloomberg.com, Bloomberg News, 29 July 2013. Web. 28 Aug. 2013.
5 EIA Energy classifications are defined as liquids, natural gas, coal, nuclear and other.


