Are Baby Boomers and Millennials Moving Back into Michigan’s Cities?
Currently, the two most often talked about demographic groups in the U.S. are baby boomers, those born from 1948 to 1964, and millennials, those born from 1981 to 1999. Even though they’re separated by Generation X, baby boomers and millennials have at least one thing in common: their increasing desire to live in cities. Some baby boomers who are also empty nesters feel the best way to stay active is to partake in city life where there’s always something happening. Many millennials prefer city life for the chance to live near a large group of young singles, in effect continuing their college experience.
Michigan offers three urban experiences that rival any in the U.S., with each experience unique in its own way. Detroit is in the midst of looking more like a typical U.S. big city with a light rail line and entertainment district featuring the new Detroit Red Wings arena set to begin operation next year. Also, the construction of additional bikeways, especially popular with millennials, should complement the city’s riverwalk, thriving restaurant scene, and historically renowned Eastern Market.
On the other side of Michigan lies Grand Rapids, whose comeback is a little further along. The transformation of Grand Rapids’ abandoned furniture plants into apartments helped persuade people to relocate downtown, allowing ventures like the city’s ArtPrize competition to succeed.
Finally, there’s Ann Arbor with its blend of unique restaurants and boutique shops located around the University of Michigan. The university’s reputation of drawing young talent has helped persuade nascent entrepreneurs and firms to locate in the area, leading to a building boom that has significantly increased Ann Arbor’s downtown residential inventory.
Is the renewed interest in Michigan’s downtowns, specifically from baby boomers and millennials, translating into population increases in those three cities? A recent blog by Kolko showed that since 2000, baby boomers and millennials have been moving back into downtowns in significant numbers. This blog will look at how the characteristics of the aforementioned cities’ populations have changed recently.
Population Changes
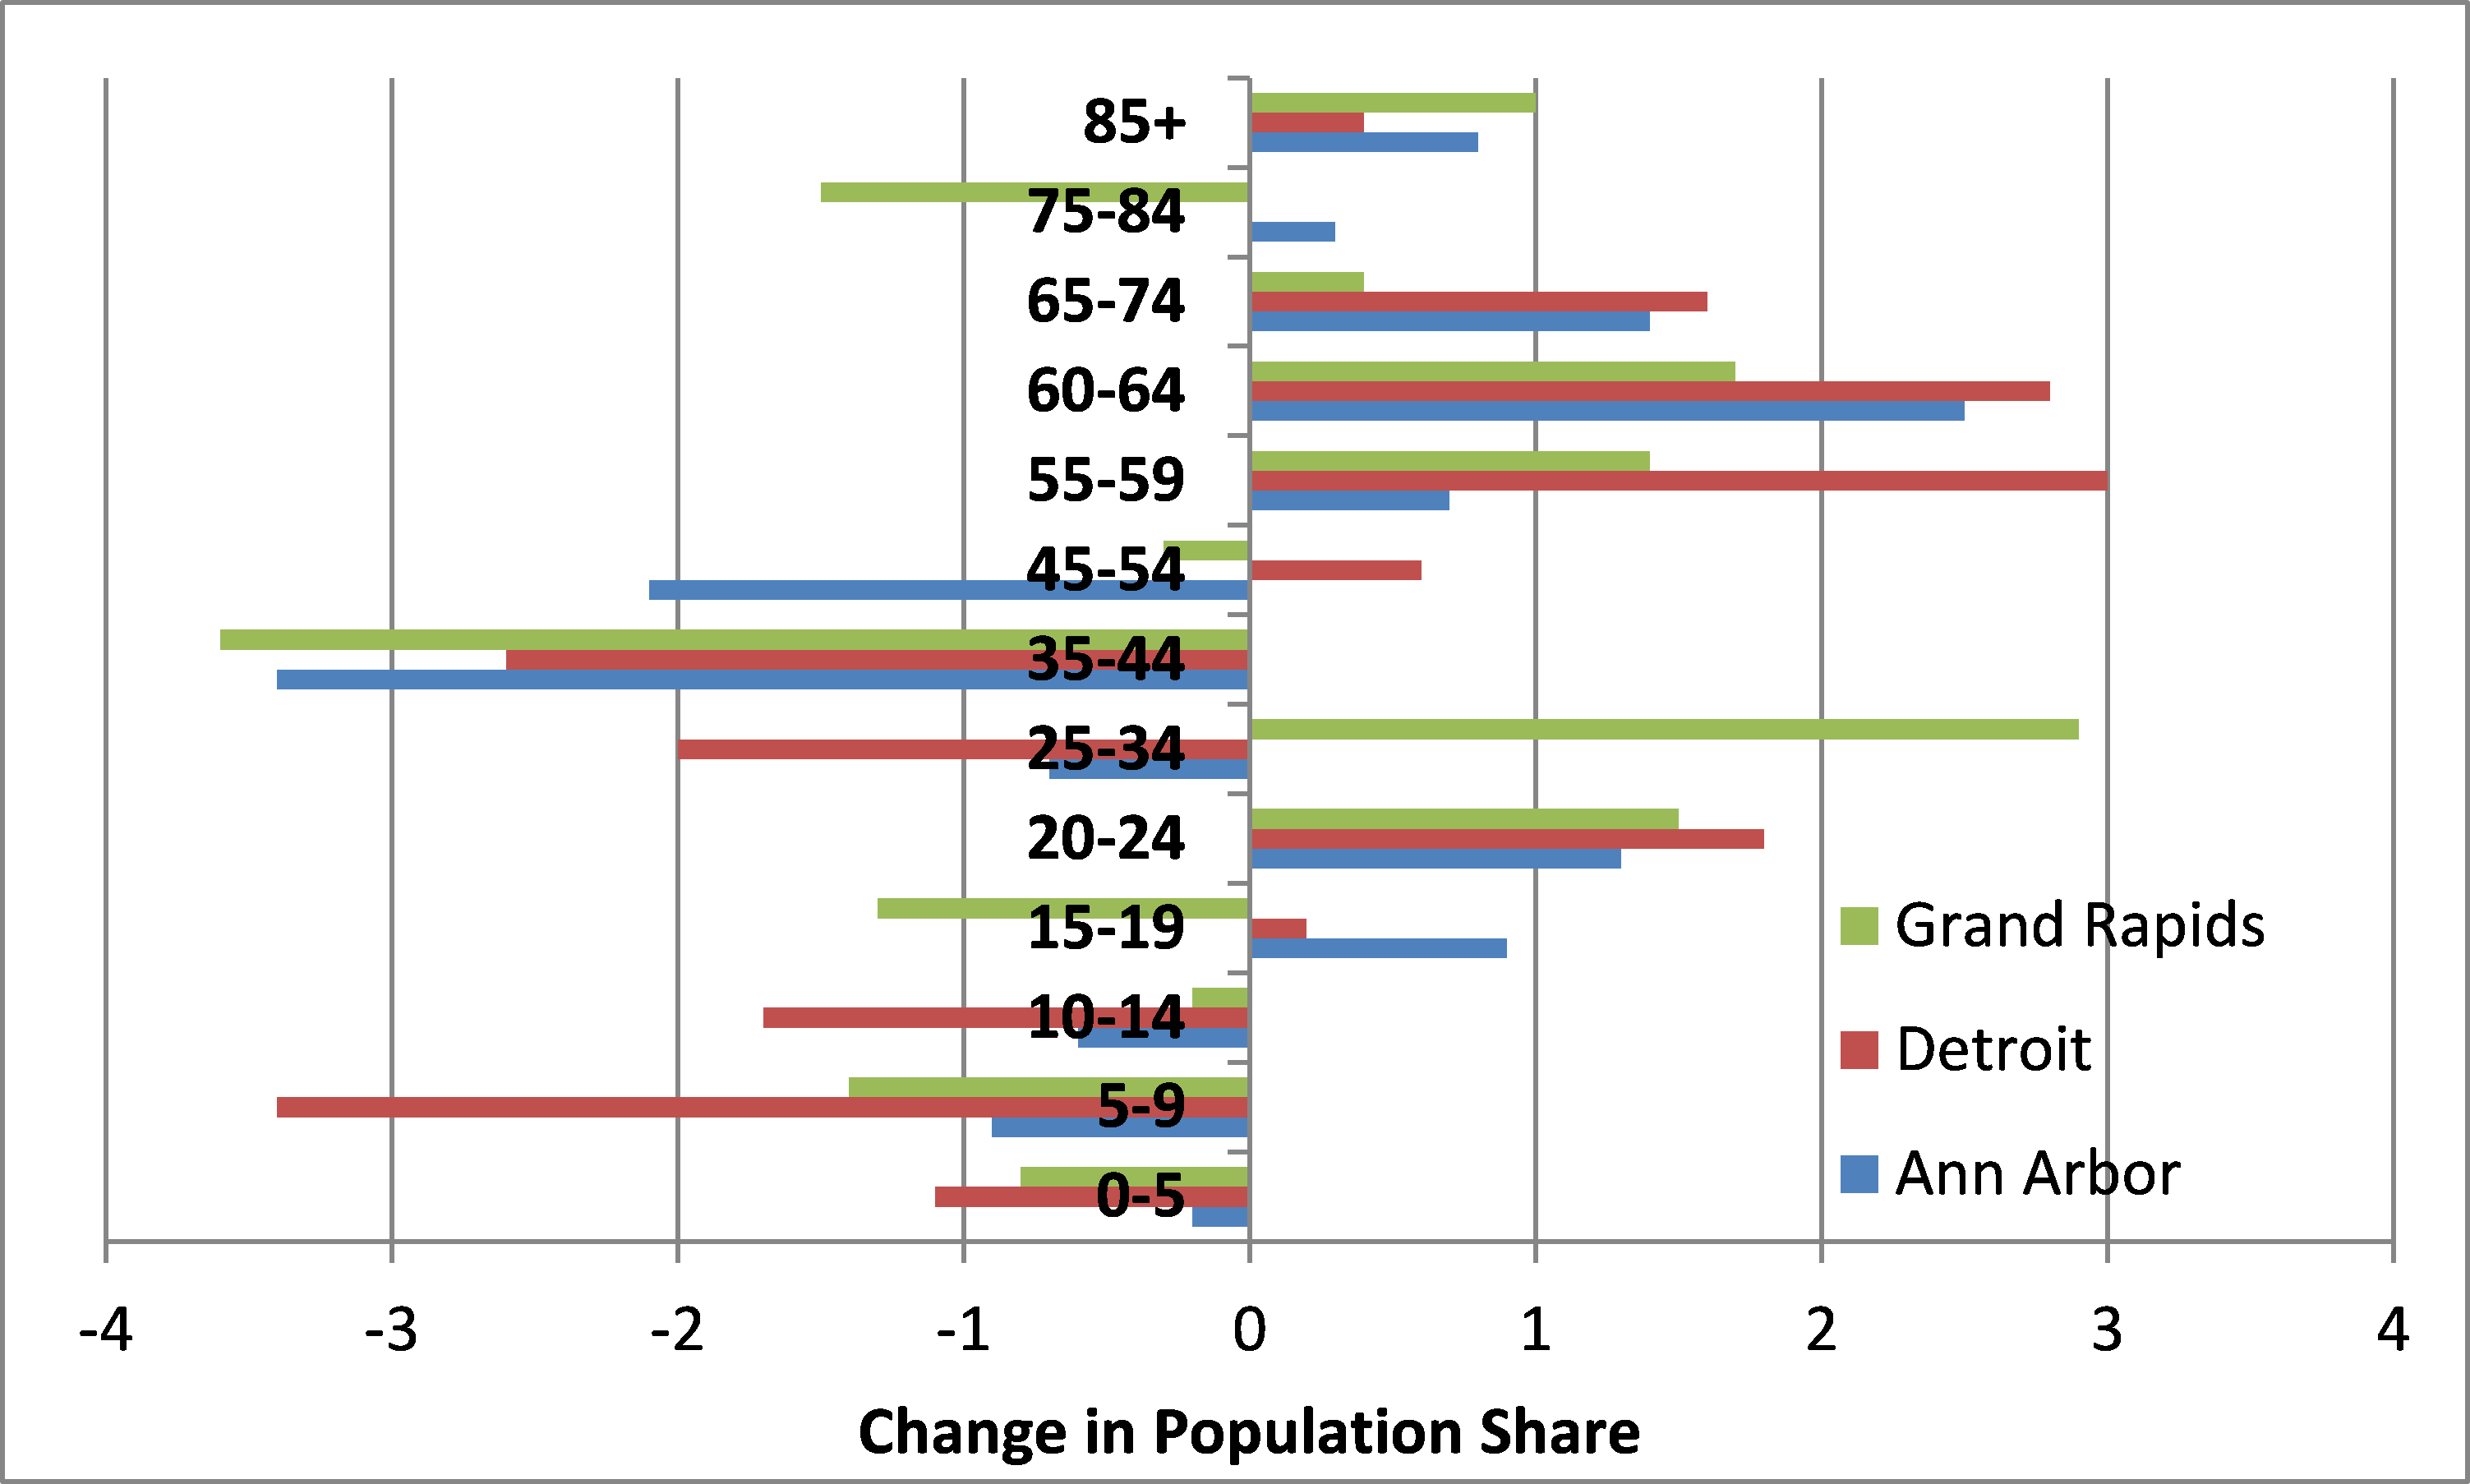
This analysis will compare population changes using Census data from 2000 and 2014. During that time, if we look at the central city area, Ann Arbor saw a small increase (3.3%) in its total population, while Grand Rapids saw a small decrease (-2%); Detroit suffered a substantial decline (-28.5%) in its total population. Looking at each city’s greater metropolitan area, Ann Arbor1 and Grand Rapids2 showed double digit increases of 10.5% and 10.4%, respectively, while Detroit3 experienced a 4.1% decrease in its population. Given the changes in overall population, can we say that baby boomers and millennials (and groups that share their characteristics) are moving back into the cities?In the chart below, population by age group, we see that young adults (15-24) make up an increasing share of Ann Arbor and Detroit’s population. At the other end of the age spectrum, in all three places and in their respective metropolitan areas, the baby boomer and silent (aged 75+) generations experienced increases in both of their population shares.
Chart 1: Change in Population Share by Age Group, 2000-2014: Ann Arbor, Detroit, Grand Rapids
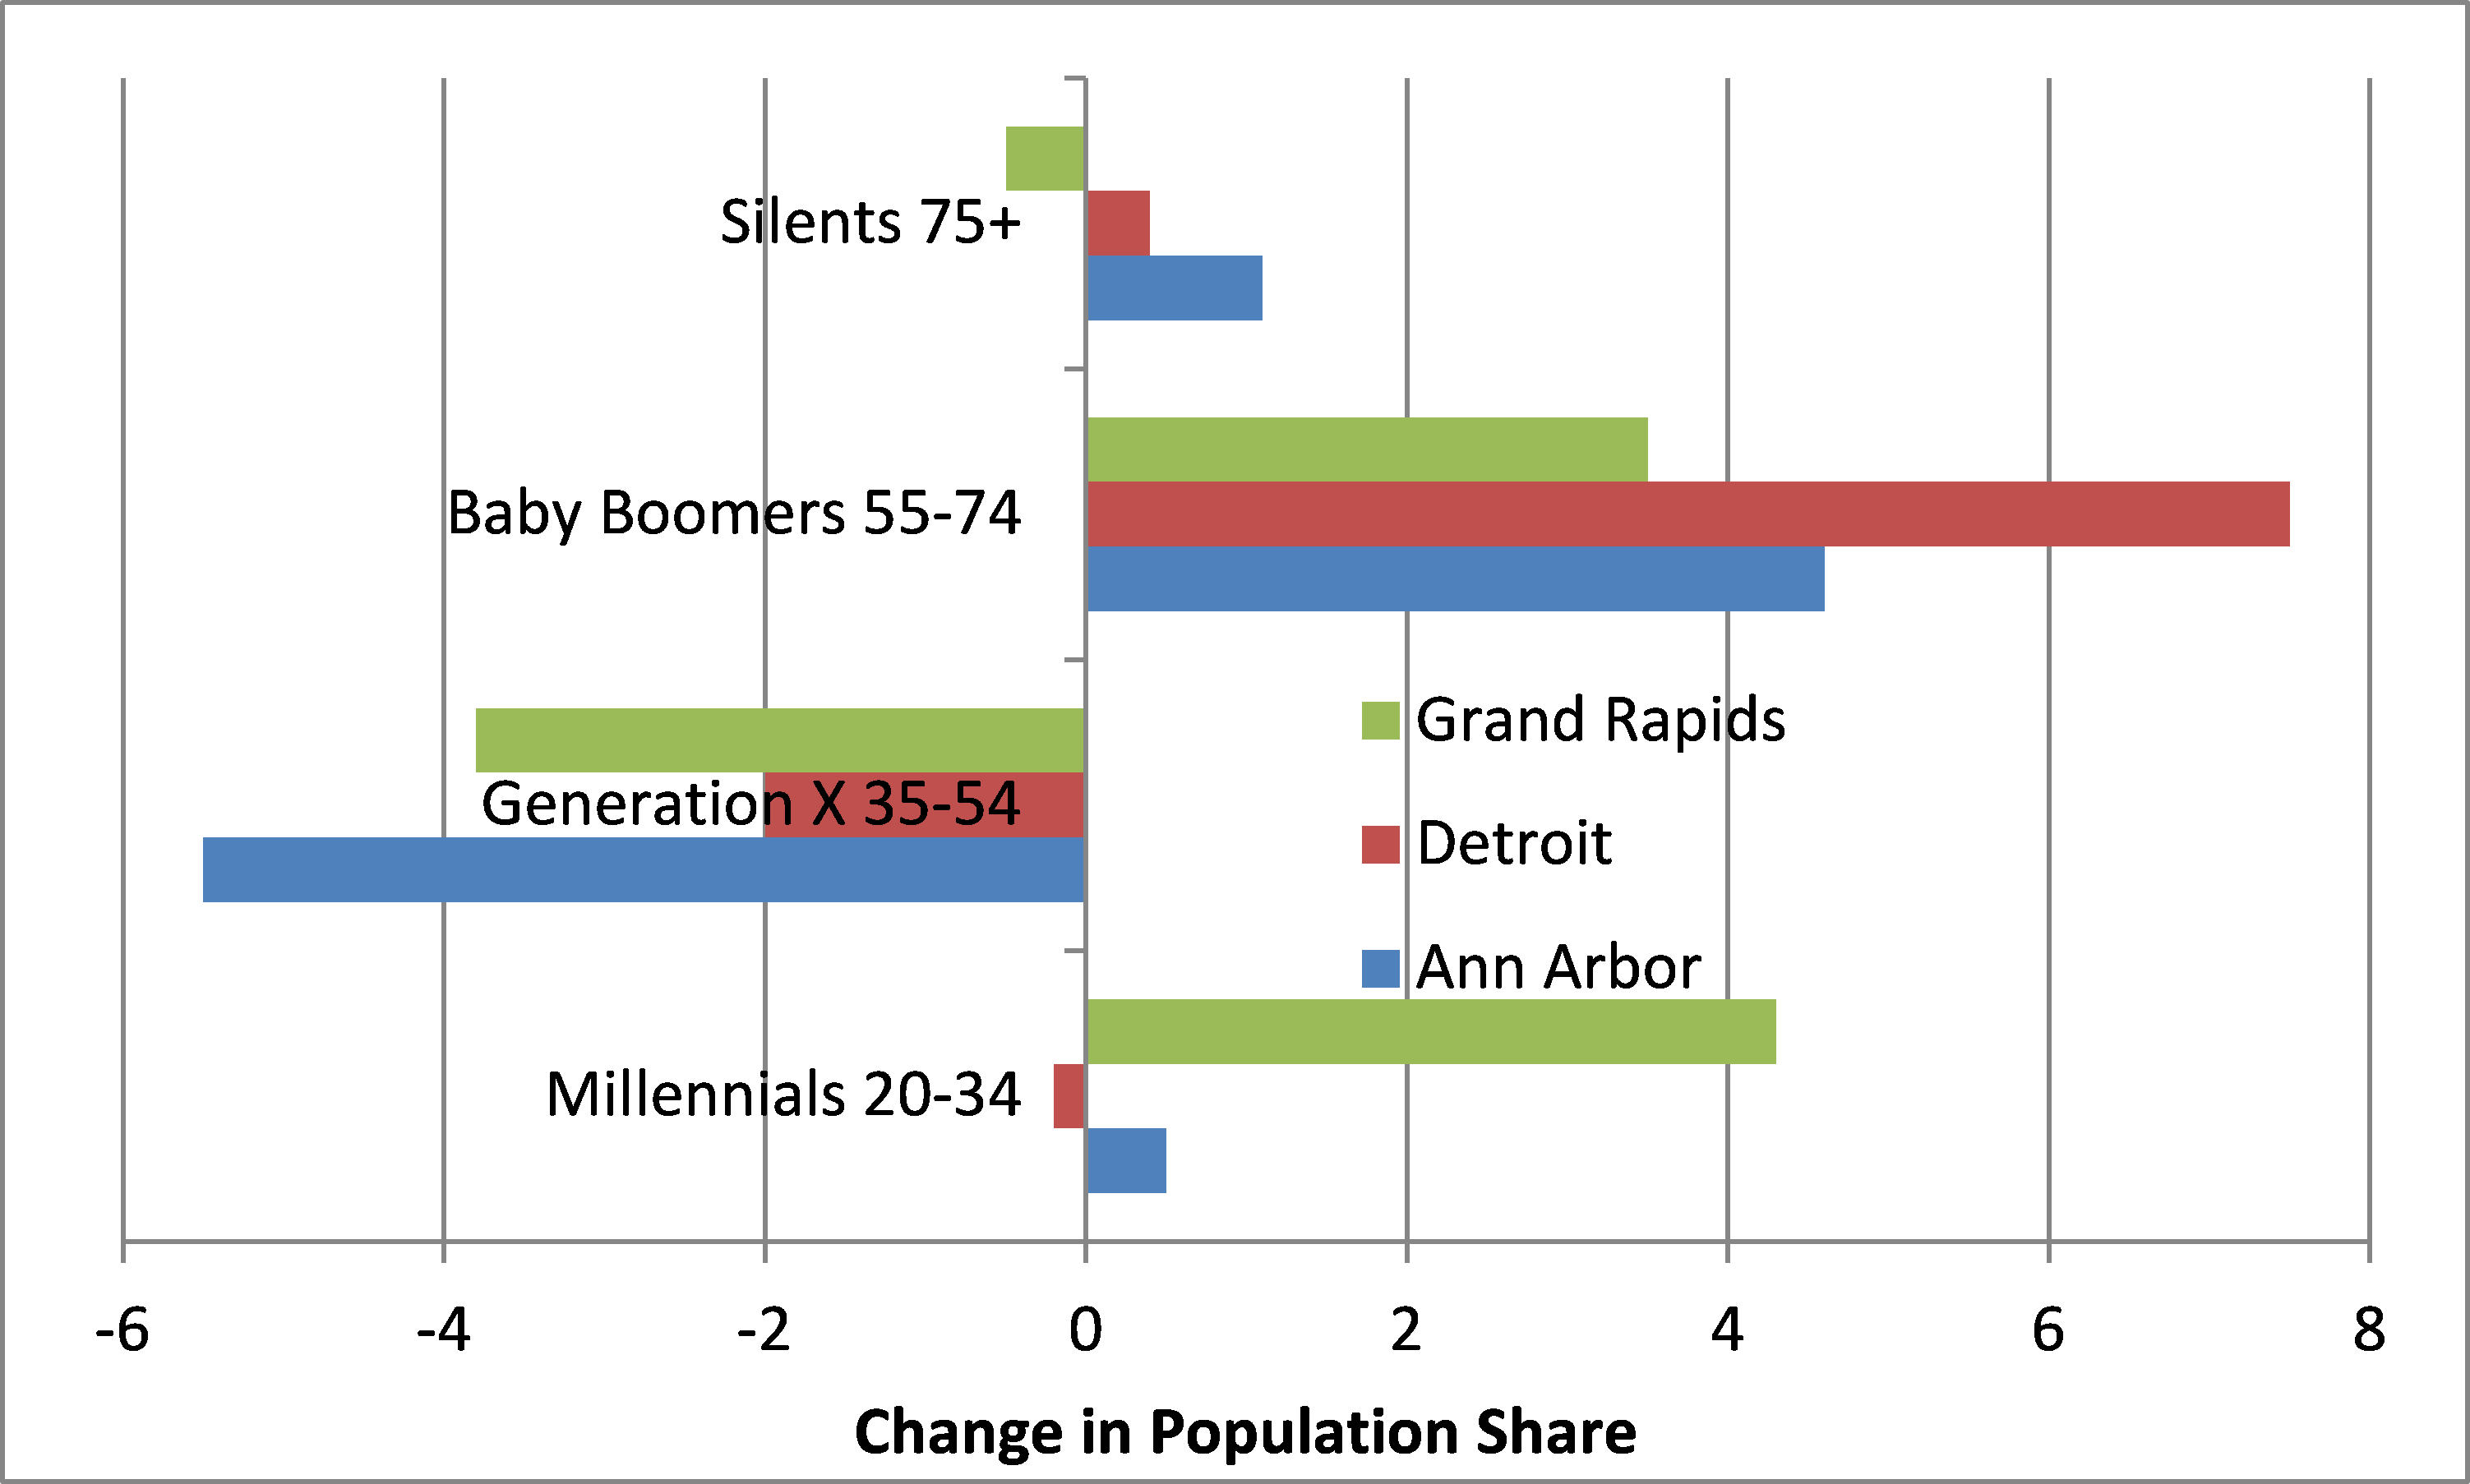
As the next chart indicates, 20-34 year olds (millennials) now comprise a greater share of Grand Rapids’ central city population, the opposite of what’s occurred in the Grand Rapids metropolitan area. Ann Arbor’s population share that consists of millennials registered a small increase, also the opposite of what’s taken place in Washtenaw County. Meanwhile, 55-74 year olds (baby boomers) moved back into all three cities (and metropolitan areas). Ann Arbor and Detroit now have a higher percentage of those from the silent generation within their city borders.
Chart 2: Change in Population Share by Demographic Group, 2000-2014: Ann Arbor, Detroit, Grand Rapids
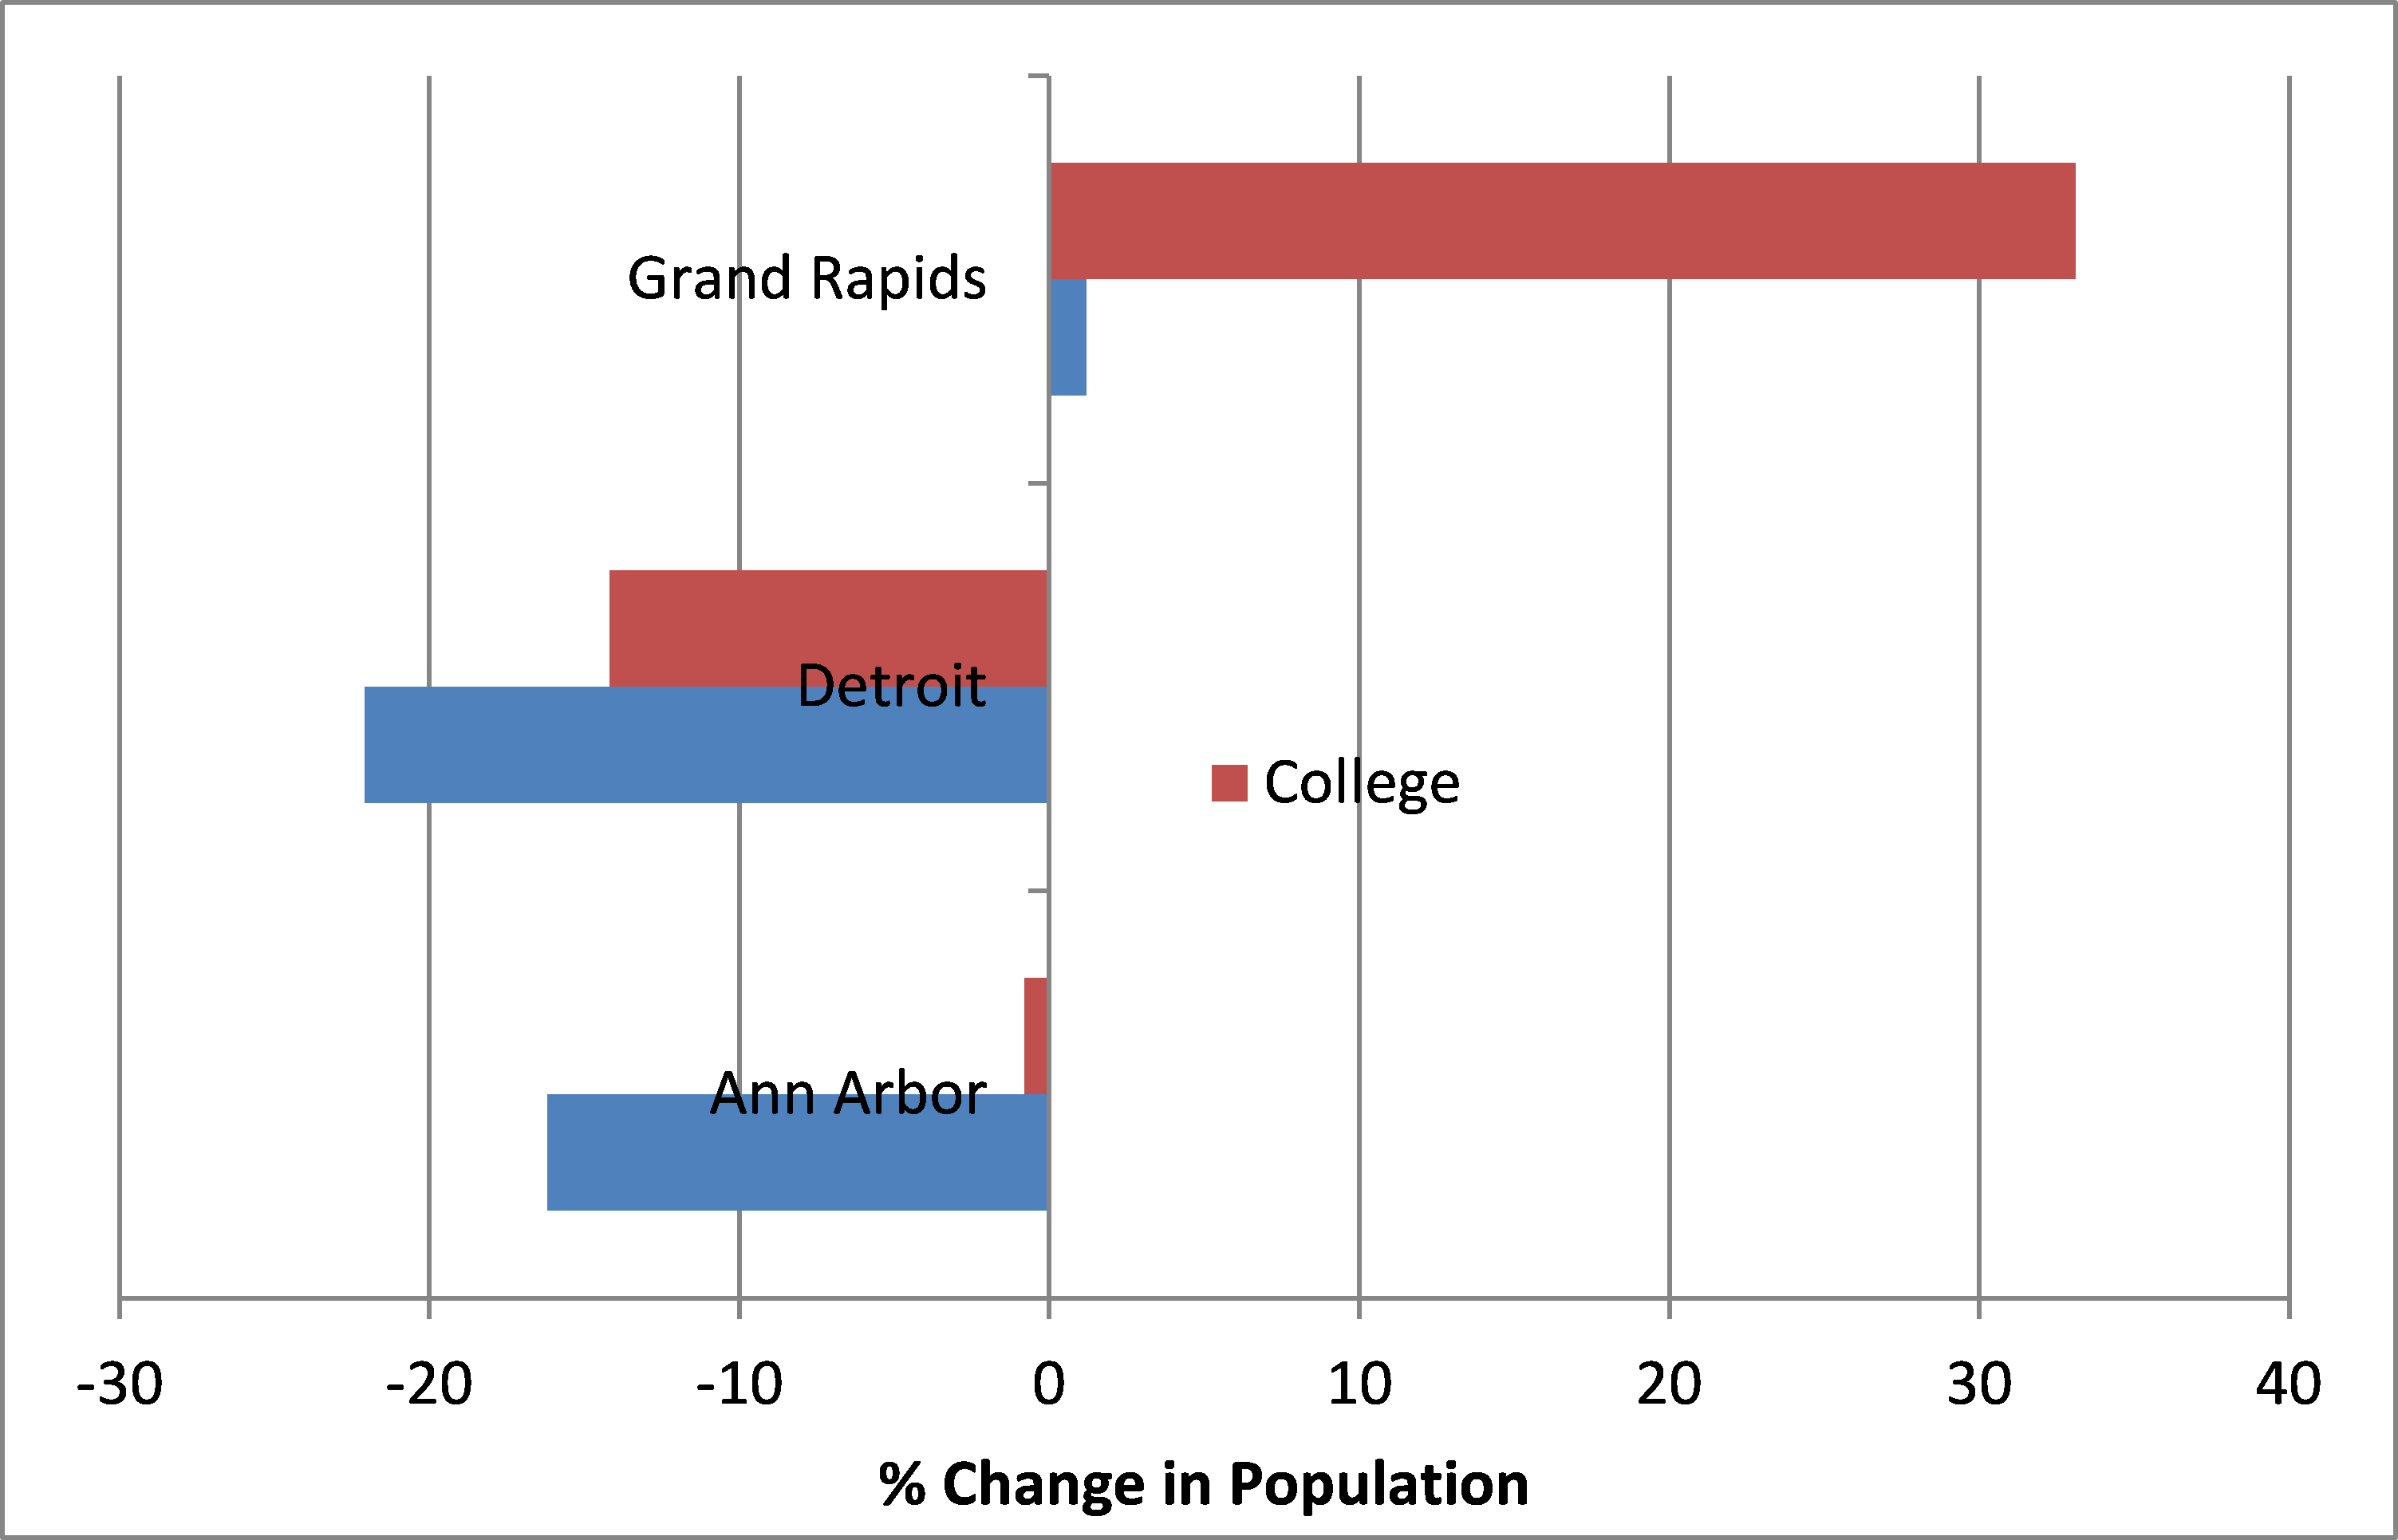
The next chart looks at changes in population by education level. Grand Rapids saw a small increase in those with some college experience and a substantial increase in college graduates. In contrast, Washtenaw County saw a modest increase in those with some college experience and a significant increase in its college-educated population, the opposite of what occurred in the city of Ann Arbor. In Detroit’s central city, there were declines in both categories, whereas the Detroit metropolitan area saw a significant increase in those who had at least obtained their bachelor’s degree.
Chart 3: Change in Population by Educational Attainment, 2000-2014: Ann Arbor, Detroit, Grand Rapids
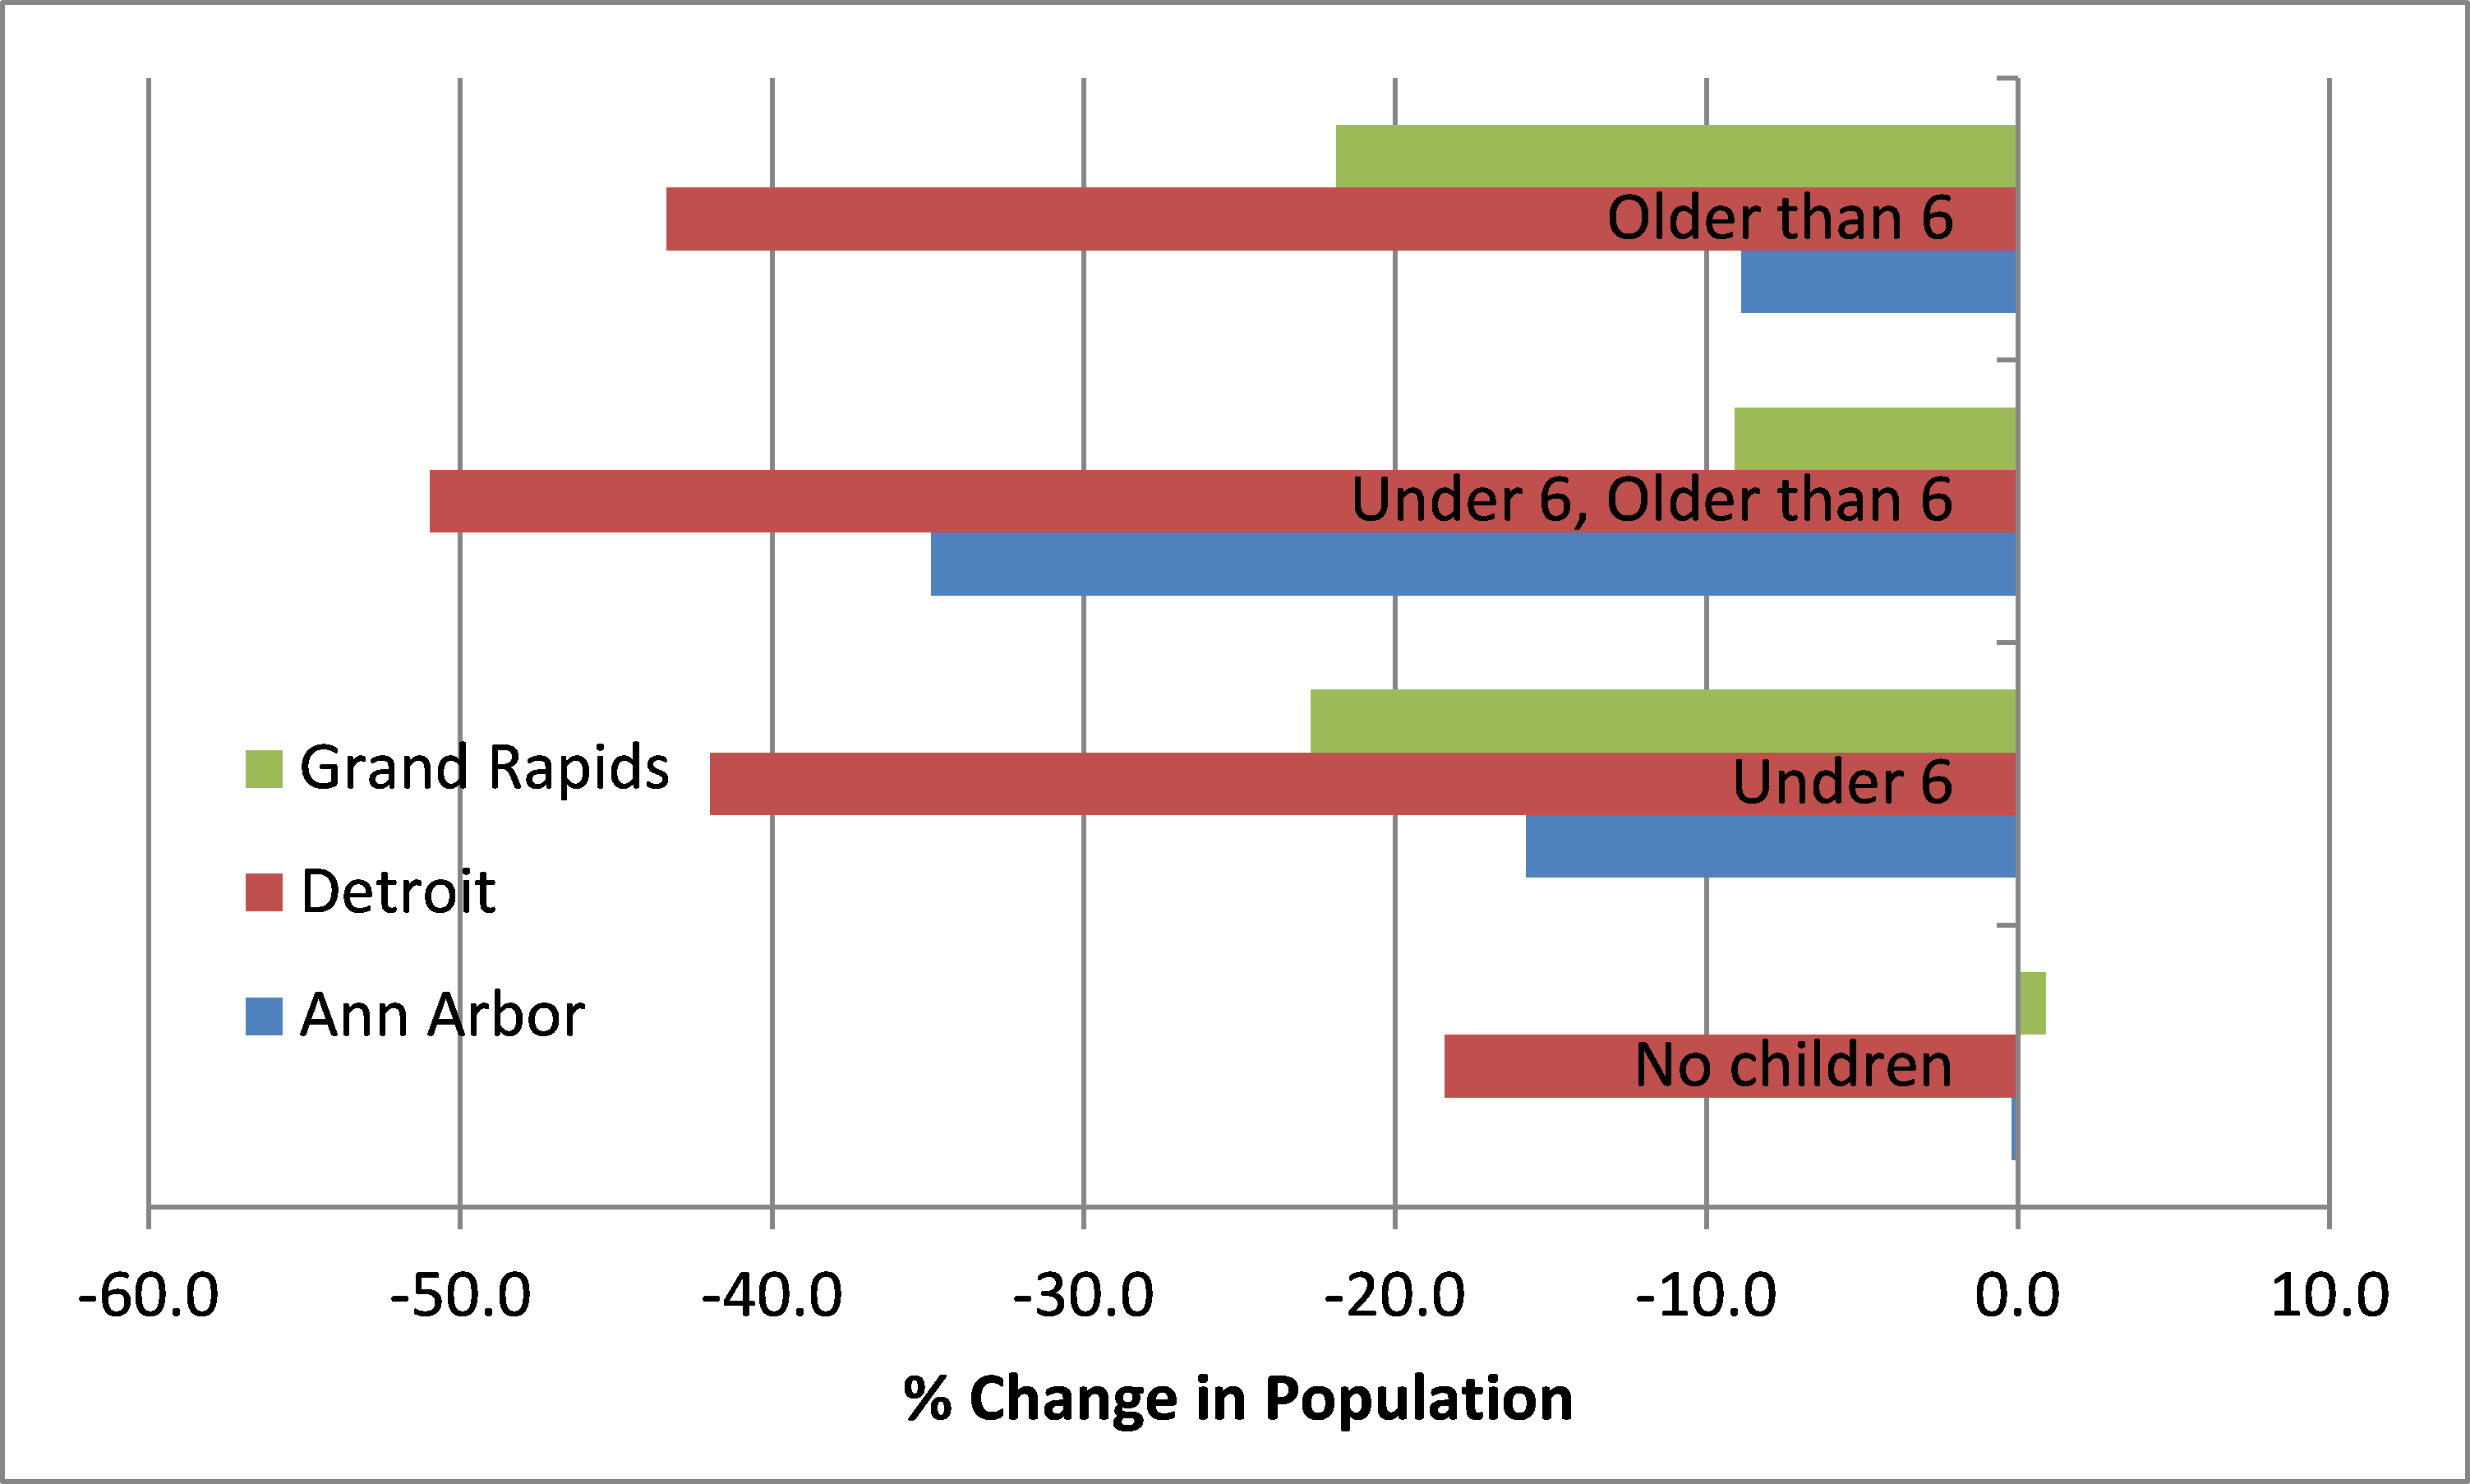
The next chart focuses on the number of families presently living in cities. Grand Rapids saw a small influx of families with no children while that number remained relatively similar in Ann Arbor. Both metropolitan areas witnessed robust increases in the number of families without children. Detroit witnessed a massive outmigration of families with children of all age groups from both its central city and metro area. Ann Arbor and Grand Rapids saw significant, but less severe, declines in families with children. In their metro areas, Grand Rapids experienced small increases in families with older children and families with young and old children, while Ann Arbor experienced a moderate increase in families with older children.
Chart 4: Change in Number of Families by Family Type, 2000-2014: Ann Arbor, Detroit, Grand Rapids
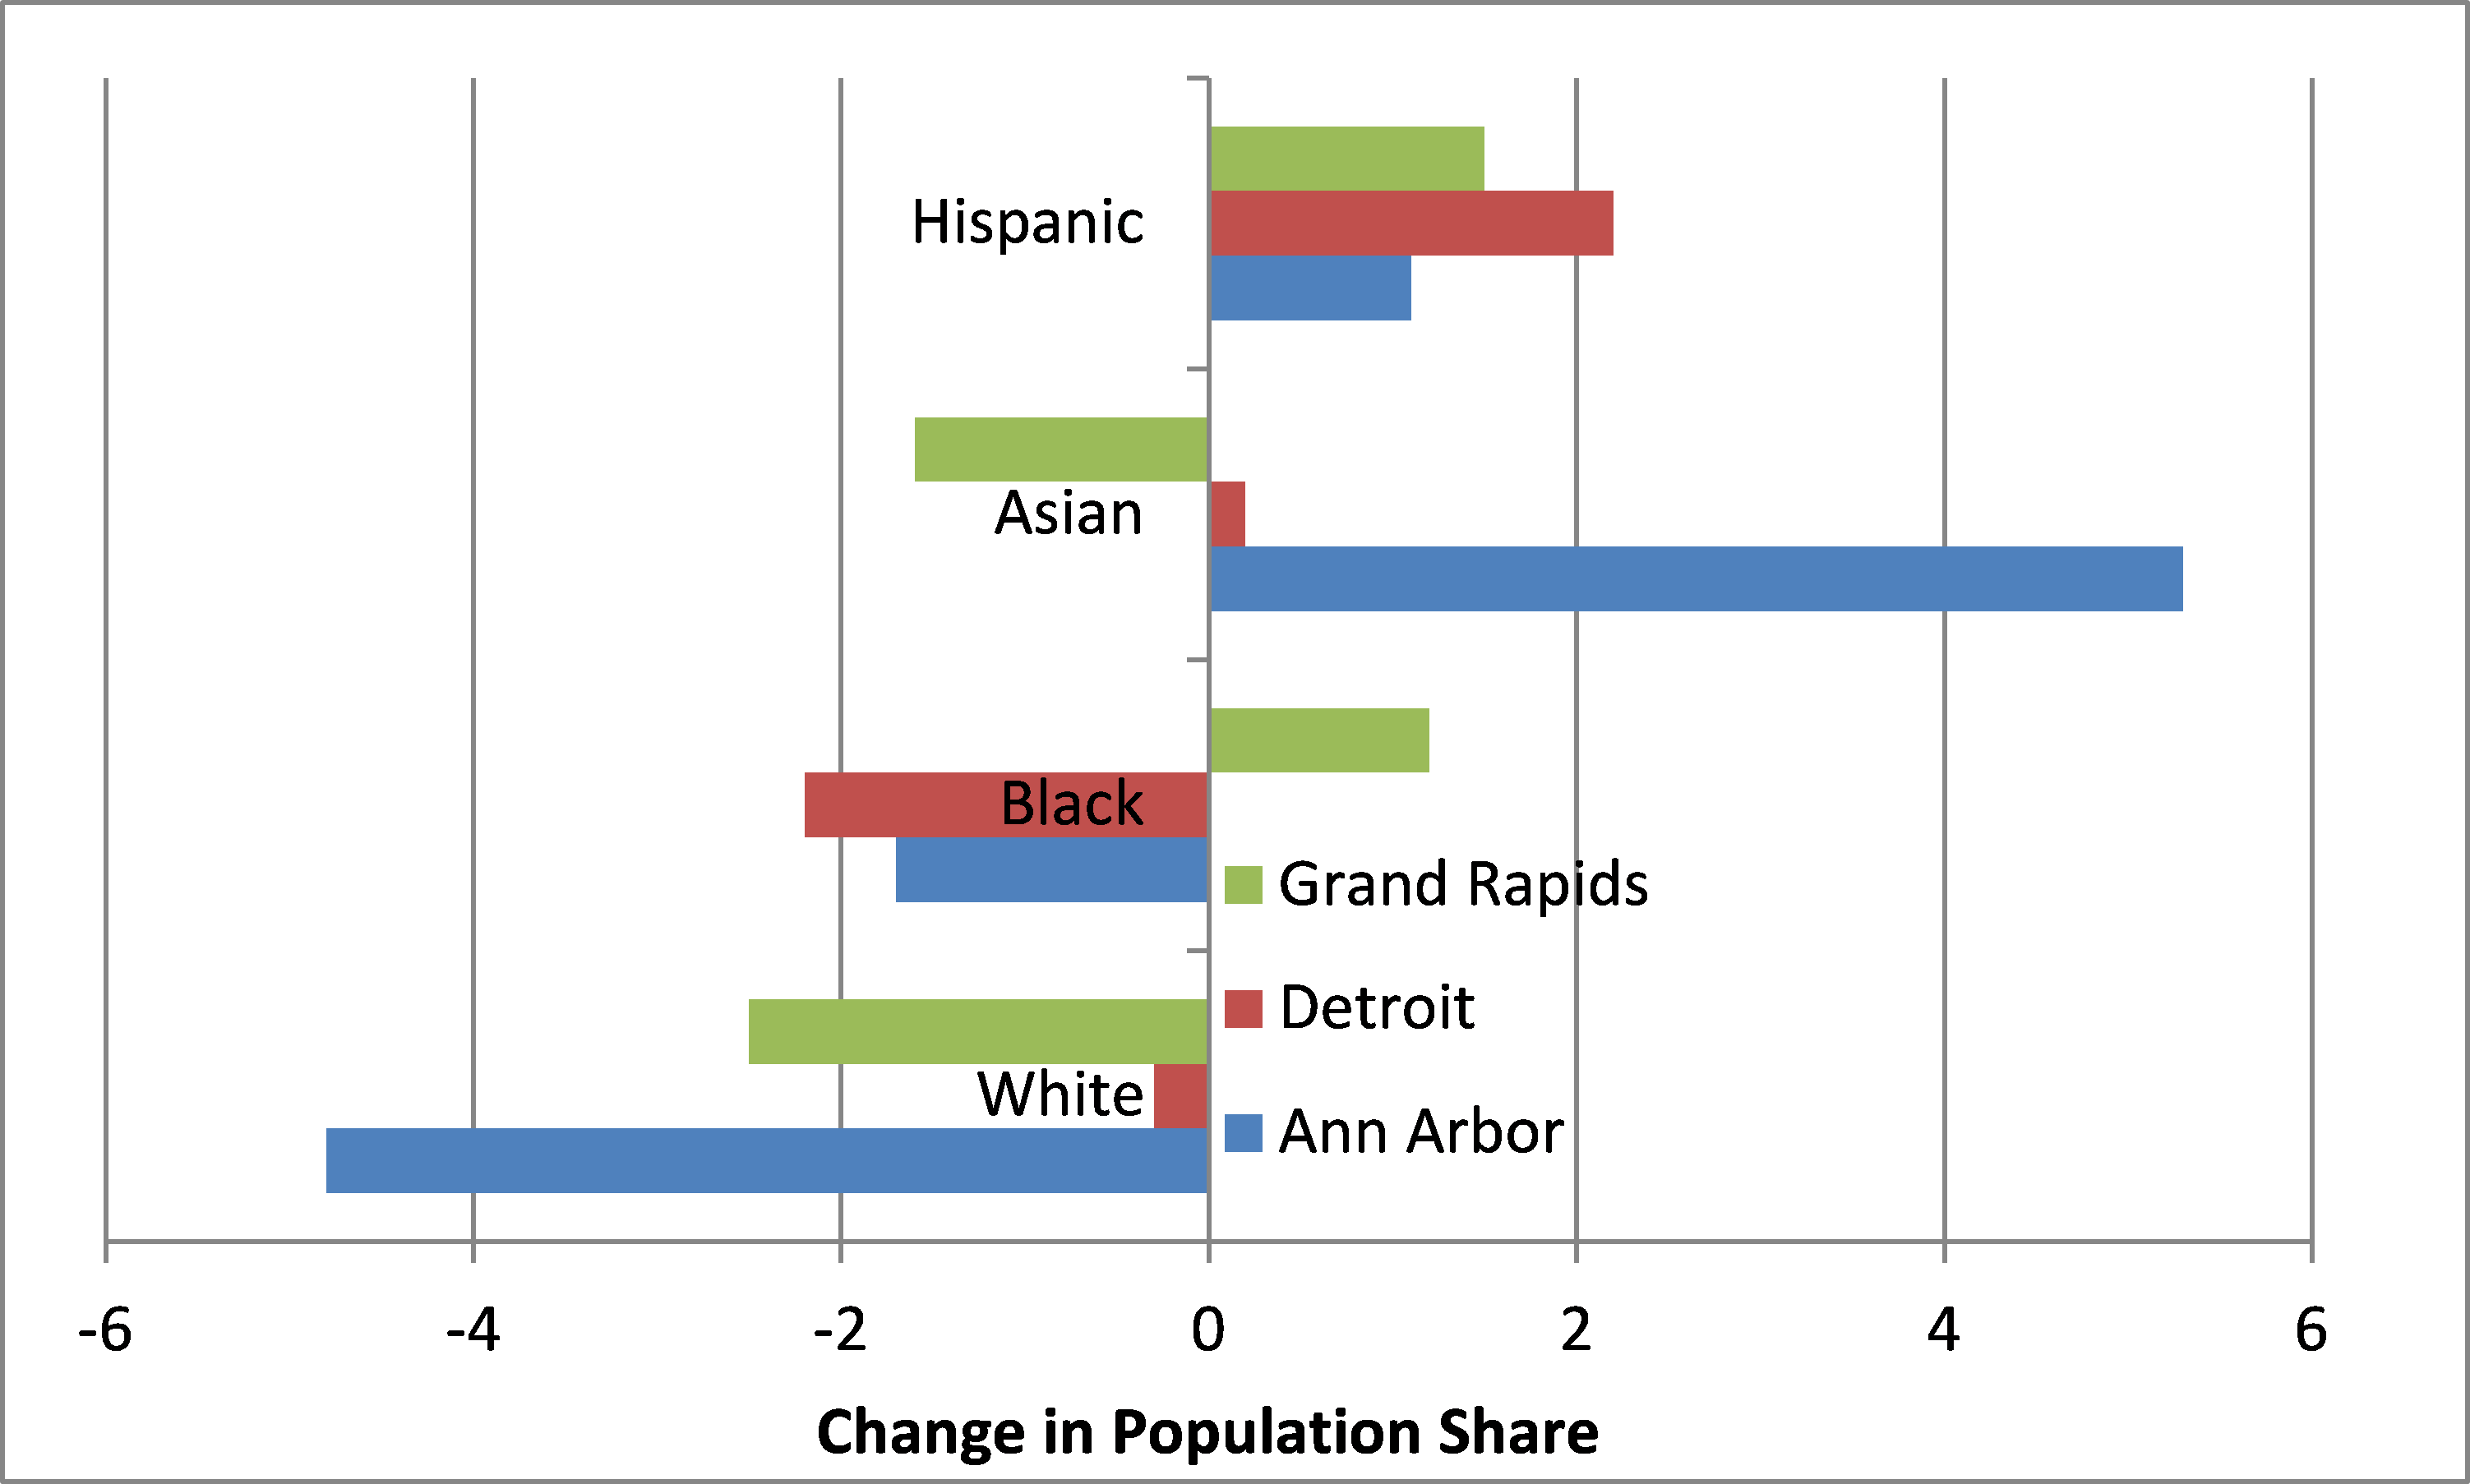
The next chart looks at population share by race. All three cities saw increases in their Hispanic population, the largest occurring in Detroit. In contrast, all three cities saw decreases in their White population, though Detroit’s was small compared with the decrease in the metropolitan area’s white population. More recent census data suggests that Detroit’s White population increased in 2014 for the first time since the 1950 Census.4 The Asian-American population grew in Ann Arbor and Detroit, while the African-American population increased in Grand Rapids.
Chart 5: Change in Population Share by Race, 2000-2014: Ann Arbor, Detroit, Grand Rapids
The final chart looks at household income. Since 2000, the population in Ann Arbor and Grand Rapids has increasingly comprised middle- to high-income earners. At the county level in both metro areas, the income distribution has shifted even more toward the higher end. Meanwhile, Detroit’s population still consists of mostly low- to middle-income earners. Comparatively, the counties that make up Detroit’s metropolitan area5 have seen their income distributions shift away from the middle income brackets toward the low and high ends.
Chart 6: Change in Population Share by Income Decile, 2000-2014: Ann Arbor, Detroit, Grand Rapids

Source: Author’s calculations using data from 2000 Census and 2014 American Community Survey (ACS).
Conclusion
There is some evidence that three of Michigan’s most attractive and best-known cities are successfully attracting millennials and baby boomers. By age group, baby boomers and multiple segments of the millennial cohort now comprise a higher share of the populations of Ann Arbor, Detroit, and Grand Rapids. The picture becomes less clear when looking at changes in population by educational attainment and income, with Grand Rapids and Ann Arbor drawing a higher-skilled citizenry.
The most telling chart for me is the one concerning changes in family structure. The number of families with no children grew slightly in Grand Rapids, stayed the same in Ann Arbor, and significantly decreased in Detroit, though at a lower rate than the overall population decline during that time. While those trends are somewhat encouraging, the trends describing changes in the number of families with children are discouraging. Families with school-age children moved out of each of the three cities at relatively high rates, and we saw increases in families with children in the Ann Arbor and Grand Rapids metropolitan areas. The presence of families in cities signals an acceptable standard of living to those considering moving into cities from suburban areas, providing opportunities for cities to grow their populations and thrive.
Footnotes:
1 Ann Arbor’s metropolitan area consists of Washtenaw County.
2 For overall population and population by race figures, the Grand Rapids metropolitan area consists of Barry, Kent, Montcalm, and Ottawa counties. Otherwise, the Grand Rapids metropolitan area consists of Kent and Ottawa counties because of the availability of data.
3 For overall population, population by race, and educational attainment figures, Detroit’s metropolitan area consists of Lapeer, Macomb, Monroe, Oakland, St. Clair, and Wayne counties.
4 More information is available online.
5 For household income, Detroit’s metro area consists of Macomb, Oakland, and Wayne counties because of the availability of data.


