A Look into Changes in Home Prices in Detroit and Wayne County, Michigan, Between 1991 and 2016
Since the early 1990s, the housing market in Wayne County, Michigan, whose county seat is Detroit, has experienced substantial price swings. Housing market volatility has varied by municipality (and by neighborhood within Detroit). Changes in the Wayne County housing market show us which areas have thrived and which have struggled in the past quarter century or so. In this blog post, we take a look at how home prices across the county have changed between 1991 and 2016, with a focus on changes in the Detroit housing market.
Analysis of maps
We used a nonparametric procedure to estimate hedonic price indexes for each census tract (or neighborhood in Detroit) for five-year intervals throughout the overall sample period between 1991 and 2016.1 The nonparametric procedure uses the census tract (or Detroit neighborhood) centroids as target points, and then just uses weighted least squares with more weight on sales near the target points.
Before going over each of our five maps individually, we want to highlight a few aspects common to all of them. The numbered and colored axis on the right of each map shows the five-year percentage change in home sale prices. Broadly speaking, red areas indicate relatively hotter housing markets (within Wayne County), while blue areas indicate relatively cooler housing markets. The darker a shade of red an area is, the relatively more positive (or less negative) the change in home sale prices; the darker a shade of blue an area is, the relatively less positive (or more negative) the change in home sale prices.
Each map covers all of Wayne County. Wayne County’s boundaries are the Detroit River to the east; 8 Mile Road to the north; Napier Road and Rawsonville Road to the southwest; and Oakville-Waltz Road, Will Carleton Road, and the Huron River to the south. The Grosse Pointe communities begin in the northeastern corner of Wayne County. In each map, the city of Detroit’s borders appear as thick black lines. Going west from Detroit’s city center, one would encounter Redford Township, Livonia, and Plymouth. Going southwest from Detroit’s city center, one would travel through Dearborn, Metro Airport, Wayne, Belleville, and Canton Township. South of Detroit lie Allen Park, plus the Downriver communities that include Lincoln Park, Trenton, and Woodhaven.
The two smaller areas demarcated with thick black lines within Detroit’s borders are Highland Park and Hamtramck; both cities were outside of Detroit when they were originally founded, and they decided to remain incorporated after Detroit expanded further northward in the first quarter of the twentieth century.2 The white areas just outside of Southwest Detroit are Ford’s corporate headquarters and its Rouge River plant and associated industrial areas.
Map 1. Home price changes in Wayne County, Michigan, 1991 to 1996
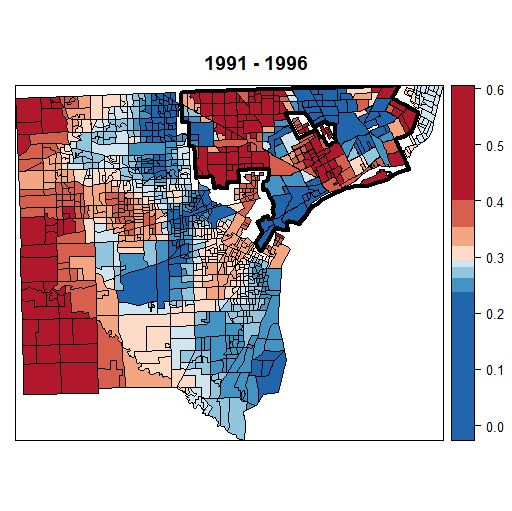
In the first half of the 1990s, much of Wayne County saw increases in home sale prices. Notably, there isn’t much variance in home sale price changes in map 1. There were areas both inside and outside Detroit that experienced the greatest relative increases in home sale prices. Within the city, Midtown and northwest Detroit saw the largest positive changes in home sale prices. Outside of Detroit, the exurban areas of Plymouth and Canton Township experienced the greatest positive changes. With the exception of Dearborn, which on the map appears to be poking Detroit’s southwest border, Detroit’s first ring of suburbs experienced increases in home sale prices that were at the lower end of the spectrum of gains.
The results in map 1 are in line with Detroit’s economic narrative at the time. Detroit enjoyed an economic boom in the first half of the 1990s (following the brief national recession of 1990–91). One factor that specifically helped Detroit back then was low oil prices, which boosted sales of sport utility vehicles (SUVs) made by the Detroit Three automakers (Chrysler, Ford, and General Motors). Higher profits at the Detroit auto manufacturers had a positive ripple effect on the local and regional economies. Another factor helping the Detroit area was stable public finances. An often overlooked achievement of the 1990s was the fact that Mayor Coleman Young’s administration balanced Detroit’s budget before his tenure ended in the mid-1990s.
Map 2. Home price changes in Wayne County, Michigan, 1996 to 2001
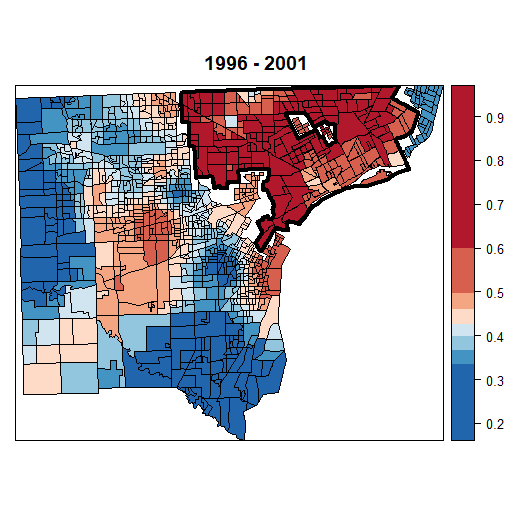
During the latter half of the 1990s and the beginning of the twenty-first century, Wayne County continued to see widespread increases in home sale prices, though with slightly greater variance than in first half of the 1990s. Large home sale price increases were found throughout Detroit. During the late ‘90s, government payrolls were expanded, adding to Detroit residents’ disposable incomes. An increase in local government jobs, combined with the surging automotive industry and general economy, led to a sharp decrease in unemployment in Detroit: The city’s unemployment rate averaged 6.6% in 2000, a significant drop from the 1990 average of 15.0%.3 Meanwhile, Detroit’s first ring of suburbs witnessed a slight pickup in growth in home sale prices. However, Wayne County’s exurban areas saw a modest deceleration in their rate of growth in home sale prices. Overall, the Wayne County housing market was strong throughout the 1990s.
Significant changes were made to how state and local revenues would be collected and used between 1996 and 2001. Dennis Archer replaced Coleman Young as the mayor of Detroit (in 1994) and added to city payrolls, which raised the disposable income of the city at the cost of unbalancing Detroit’s budget. Also, Proposal A, Michigan’s large school-reform bill,4 flushed Detroit Public Schools with additional cash, adding to the district’s appeal. And state revenue sharing hadn’t been cut yet, giving city government additional resources for services. A lot of economic and fiscal factors worked in Detroit’s favor during the 1990s, most likely making positive impacts on the city’s housing market. However, the next decade would reveal the mistakes of increasing government spending as Detroit’s population (i.e., its tax base) continued to shrink.
Map 3. Home price changes in Wayne County, Michigan, 2001 to 2006
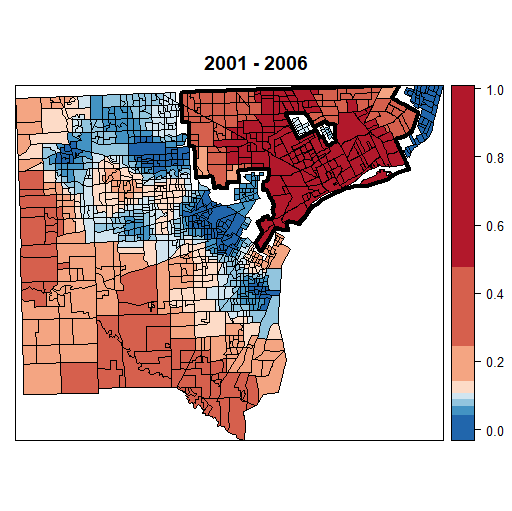
Home sale price appreciation endured through 2006 across Wayne County, though with slightly greater variance compared with the appreciation seen in the previous five-year interval. Again, the largest relative gains in home sale prices were in Detroit. Gains in home sale prices flattened in the first ring of suburbs, whereas some exurban areas saw a slight pickup in growth. From looking at map 3, one might conclude that the Detroit and Wayne County economies had stayed the course and built on the 1990s expansion. Unfortunately, that wasn’t the case. After the turn of the millennium, the subprime housing crisis began. During the early 2000s, Detroit didn’t see the massive boom in homebuilding or the surge in home values seen in places such as Las Vegas, Phoenix, Tampa, and southern California. That said, Detroit home values remained elevated as a result of the U.S. housing bubble.
After falling to a low of 3.7% in 2000, Michigan’s unemployment rate rose to 7.2% in 2003.5 The state’s unemployment rate bounced around that rate until it began to rise again with the beginning of the U.S. Great Recession in December 2007. Many analysts have contended Michigan’s economy fell into recession sometime late in 2003, as the boom in SUV sales receded with the rising price of fuel. Then, beginning in 2005, layoffs and voluntary buyouts of long-tenured employees of the Detroit Three automakers began, helping to slow economic activity further. Simultaneously, Detroit’s economic momentum was halted. Detroit residents were already weighed down by high city income tax rates, and revenues from its local casino wagering taxes began to wane. Moreover, the city’s unemployment rate rose quickly after hitting its 2000 low; it reached 14.1% in 2004, and lingered there until late 2007.6
Map 4. Home price changes in Wayne County, Michigan, 2006 to 2011
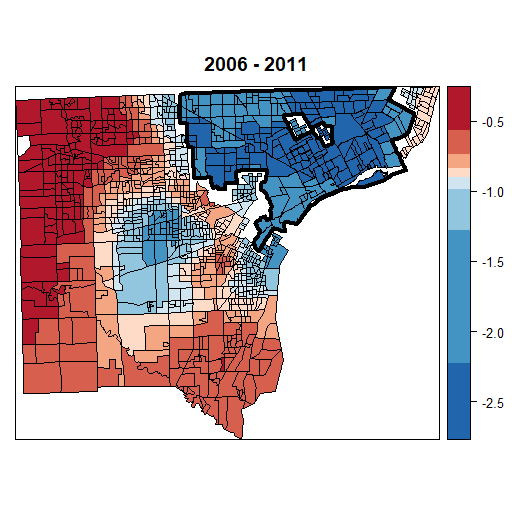
After experiencing widespread home sale price increases between 1991 and 2006, home sales price decreases permeated throughout much of Wayne County between 2006 and 2011. Of all the Wayne County municipalities, Detroit suffered the most from the popping of the housing bubble. Even areas of the city that one might assume would be more stable than others (for instance, Midtown Detroit) suffered sizable home sale price decreases. The further out one went from the city, the lesser the decline in home sale prices. However, almost no area was spared. One can almost divide the map into auto-industry-dependent, blue-collar areas and relatively more diversified, white-collar areas (the blue areas were the former, the red areas the latter). Another thing to keep in mind is that outmigration accelerated during this time. Economic misfortunes, early retirements, and the aging of the population persuaded many to leave and seek residence elsewhere.
Map 5. Home price changes in Wayne County, Michigan, 2011 to 2016

The year 2011 marked a turning point for Wayne County’s economy. In that year, Dan Gilbert moved the headquarters of Quicken Loans downtown and started incentivizing his employees to live there as well. Also in 2011, Gilbert began buying downtown real estate. Now, Gilbert owns over 90 buildings downtown. The year 2011 was also when Mayor Dave Bing announced his intention to supply additional funding to certain stable neighborhoods of Detroit that were deemed “demonstration areas.”7 The Detroit neighborhood of Boston–Edison (one of the demonstration areas) shows up in map 5 as a lighter red area (indicating it had modest home price increases). Bagley (another demonstration area) is one of the lighter blue Detroit neighborhoods (indicating a slight rebound in home values there).
In map 5, Detroit’s Downtown, Midtown, and Corktown, plus their surrounding areas, show signs of life. As we mentioned, Dan Gilbert was the catalyst for downtown investment. And it turns out that Midtown Detroit, Inc., was the catalyst for Midtown investment. In 2011, Midtown Detroit, Inc., Detroit Medical Center, Wayne State, and Henry Ford Health Systems announced the start of the Live Midtown program, which provided monetary incentives for people to move to Midtown.8 This program helped increase the rental occupancy rate in Midtown Detroit to nearly 100% in 2014.9 And high occupancy rates have endured in Midtown even with the additional living capacity built over the past few years.10 In Corktown, the owners of Slows BBQ helped draw new investment to other vacant Michigan Avenue storefronts, improving the neighborhood’s attractiveness.
Conclusion
During the late 1990s and early 2000s, home sale prices rose much more rapidly in (already relatively low-priced) Detroit neighborhoods than in many other parts of Wayne County (see map 2). However, these same Detroit neighborhoods were the areas where home prices fell more significantly as Michigan endured its one-state recession from around 2003 through 2009 and as the U.S. housing bubble burst in 2006 (see map 4).
Map 5 (which describes the five-year home price changes between 2011 and 2016) almost perfectly demonstrates the argument that there are now “two Detroits,” as public and private investments to date have helped only some parts of Detroit to revitalize and raise their home values. The areas in red are where the bulk of Detroit’s revitalization is taking place, while the areas in blue are the neighborhoods still waiting to participate in the city’s rebound. At this point, the blue areas in Detroit are vastly outnumbered by the red ones. But many public sector and private sector efforts are under way to improve the city’s living conditions, which may lead to higher home prices (and, in turn, higher tax receipts and perhaps expansions of city services to draw more people). So, in the coming years, Detroit may start to see its red neighborhoods outnumbering its blue ones.
Footnotes
1 Nonparametric regressions are used when the relationship between the independent and dependent variables aren’t already known. The regression analysis from the data provided determines the relationship between the independent and dependent variables. A hedonic price index identifies price factors (the characteristics of the good itself and the external factors affecting its sale). (For more on census tracts, see this site.) Details on our procedure are available upon request.
2 Details available online.
3 Author’s calculations based on data from the U.S. Bureau of Labor Statistics.
4 See this article.
5 Author’s calculations using data from the U.S. Bureau of Labor Statistics
6 U.S. Bureau of Labor Statistics.
7 See this article.
8 See this article.
9 See this article.
10 See this report and this article.


