Detroit Economic Growth Bounced Back Above Trend in December, According to Chicago Fed Index
The Chicago Fed’s Detroit Economic Activity Index (DEAI) was +0.99 in December, up from –0.33 in November. An index value greater than zero points to the city of Detroit’s economic activity growing faster than trend, while an index value less than zero points to the city’s economic activity growing slower than trend. The complete history of the index through December is shown below (chart 1). A comparison of the three- and 12-month moving averages of the DEAI in December implies that growth in Detroit’s economic activity, while still above trend, has slowed in recent months.
Chart 1. Detroit Economic Activity Index (standard deviations from trend)
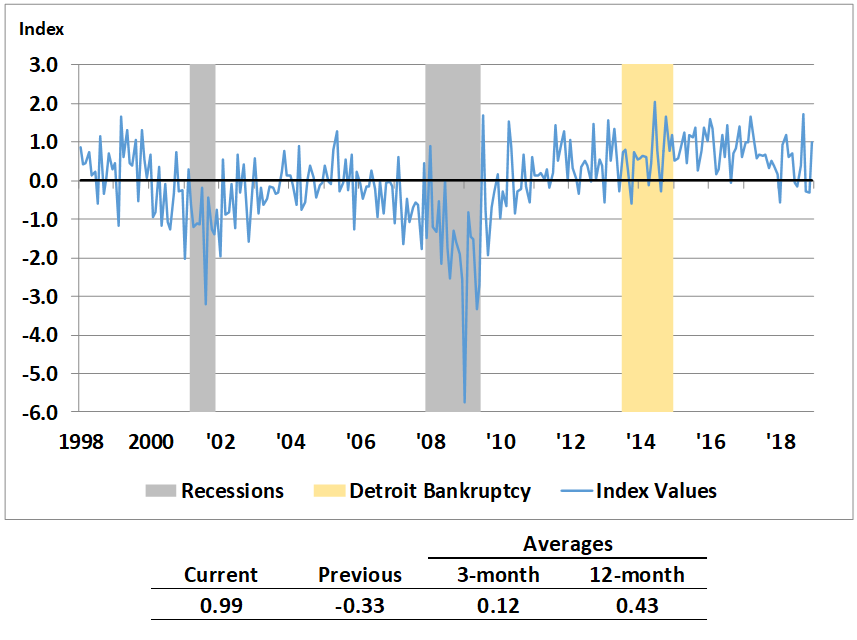
Table 1 shows the contribution to the DEAI from each of the index’s four major categories (income, labor, real estate, and trade), as well as the contribution of the monthly series with the largest weight in each category. Unlike trade, the other three categories made positive contributions to the DEAI in December. Moreover, the contributions from the income and trade categories improved from September.
Table 1. Contributions to the DEAI
| 2018 Data | |||
|---|---|---|---|
| December | September | Change from September to December | |
| Income | 0.19 | 0.05 | 0.14 |
| – DTE residential customer count | 0.18 | 0.02 | 0.16 |
| Labor | 0.70 | 1.58 | -0.88 |
| – Employment | 0.84 | 1.33 | -0.49 |
| – Unemployment | -0.14 | 0.25 | -0.39 |
| Real estate | 0.13 | 0.16 | -0.03 |
| – Median home price | 0.09 | 0.09 | 0.00 |
| Trade | -0.03 | -0.05 | 0.02 |
| – Exports | -0.02 | -0.02 | 0.00 |
| – Imports | -0.01 | -0.03 | 0.02 |
The improvement in the income category’s contribution to the DEAI is explained partly by a 0.6% increase in residential electric customer counts between September and December. The labor category’s contribution to the DEAI decreased over this span. This drop is largely due to an increase in the unemployment rate from 7.6% in September to 9.4% in December. The unemployment rate is a function of the number of people in the labor force—which grew a little over 1.9% between September and December; but given that employment increased by just under 0.3% during this period, the unemployment rate rose. While the jump in the unemployment rate may be considered a negative development, the fact that more workers are entering the labor force is a good sign. The contribution from the real estate category to the DEAI moved down between September and December. This happened despite the fact that the median home price in Detroit surged a whopping 6.3% over the September through December period. Trade’s contribution to the DEAI remained negative, as inflation-adjusted total port activity (exports plus imports) declined by 2.8% from September to December.1
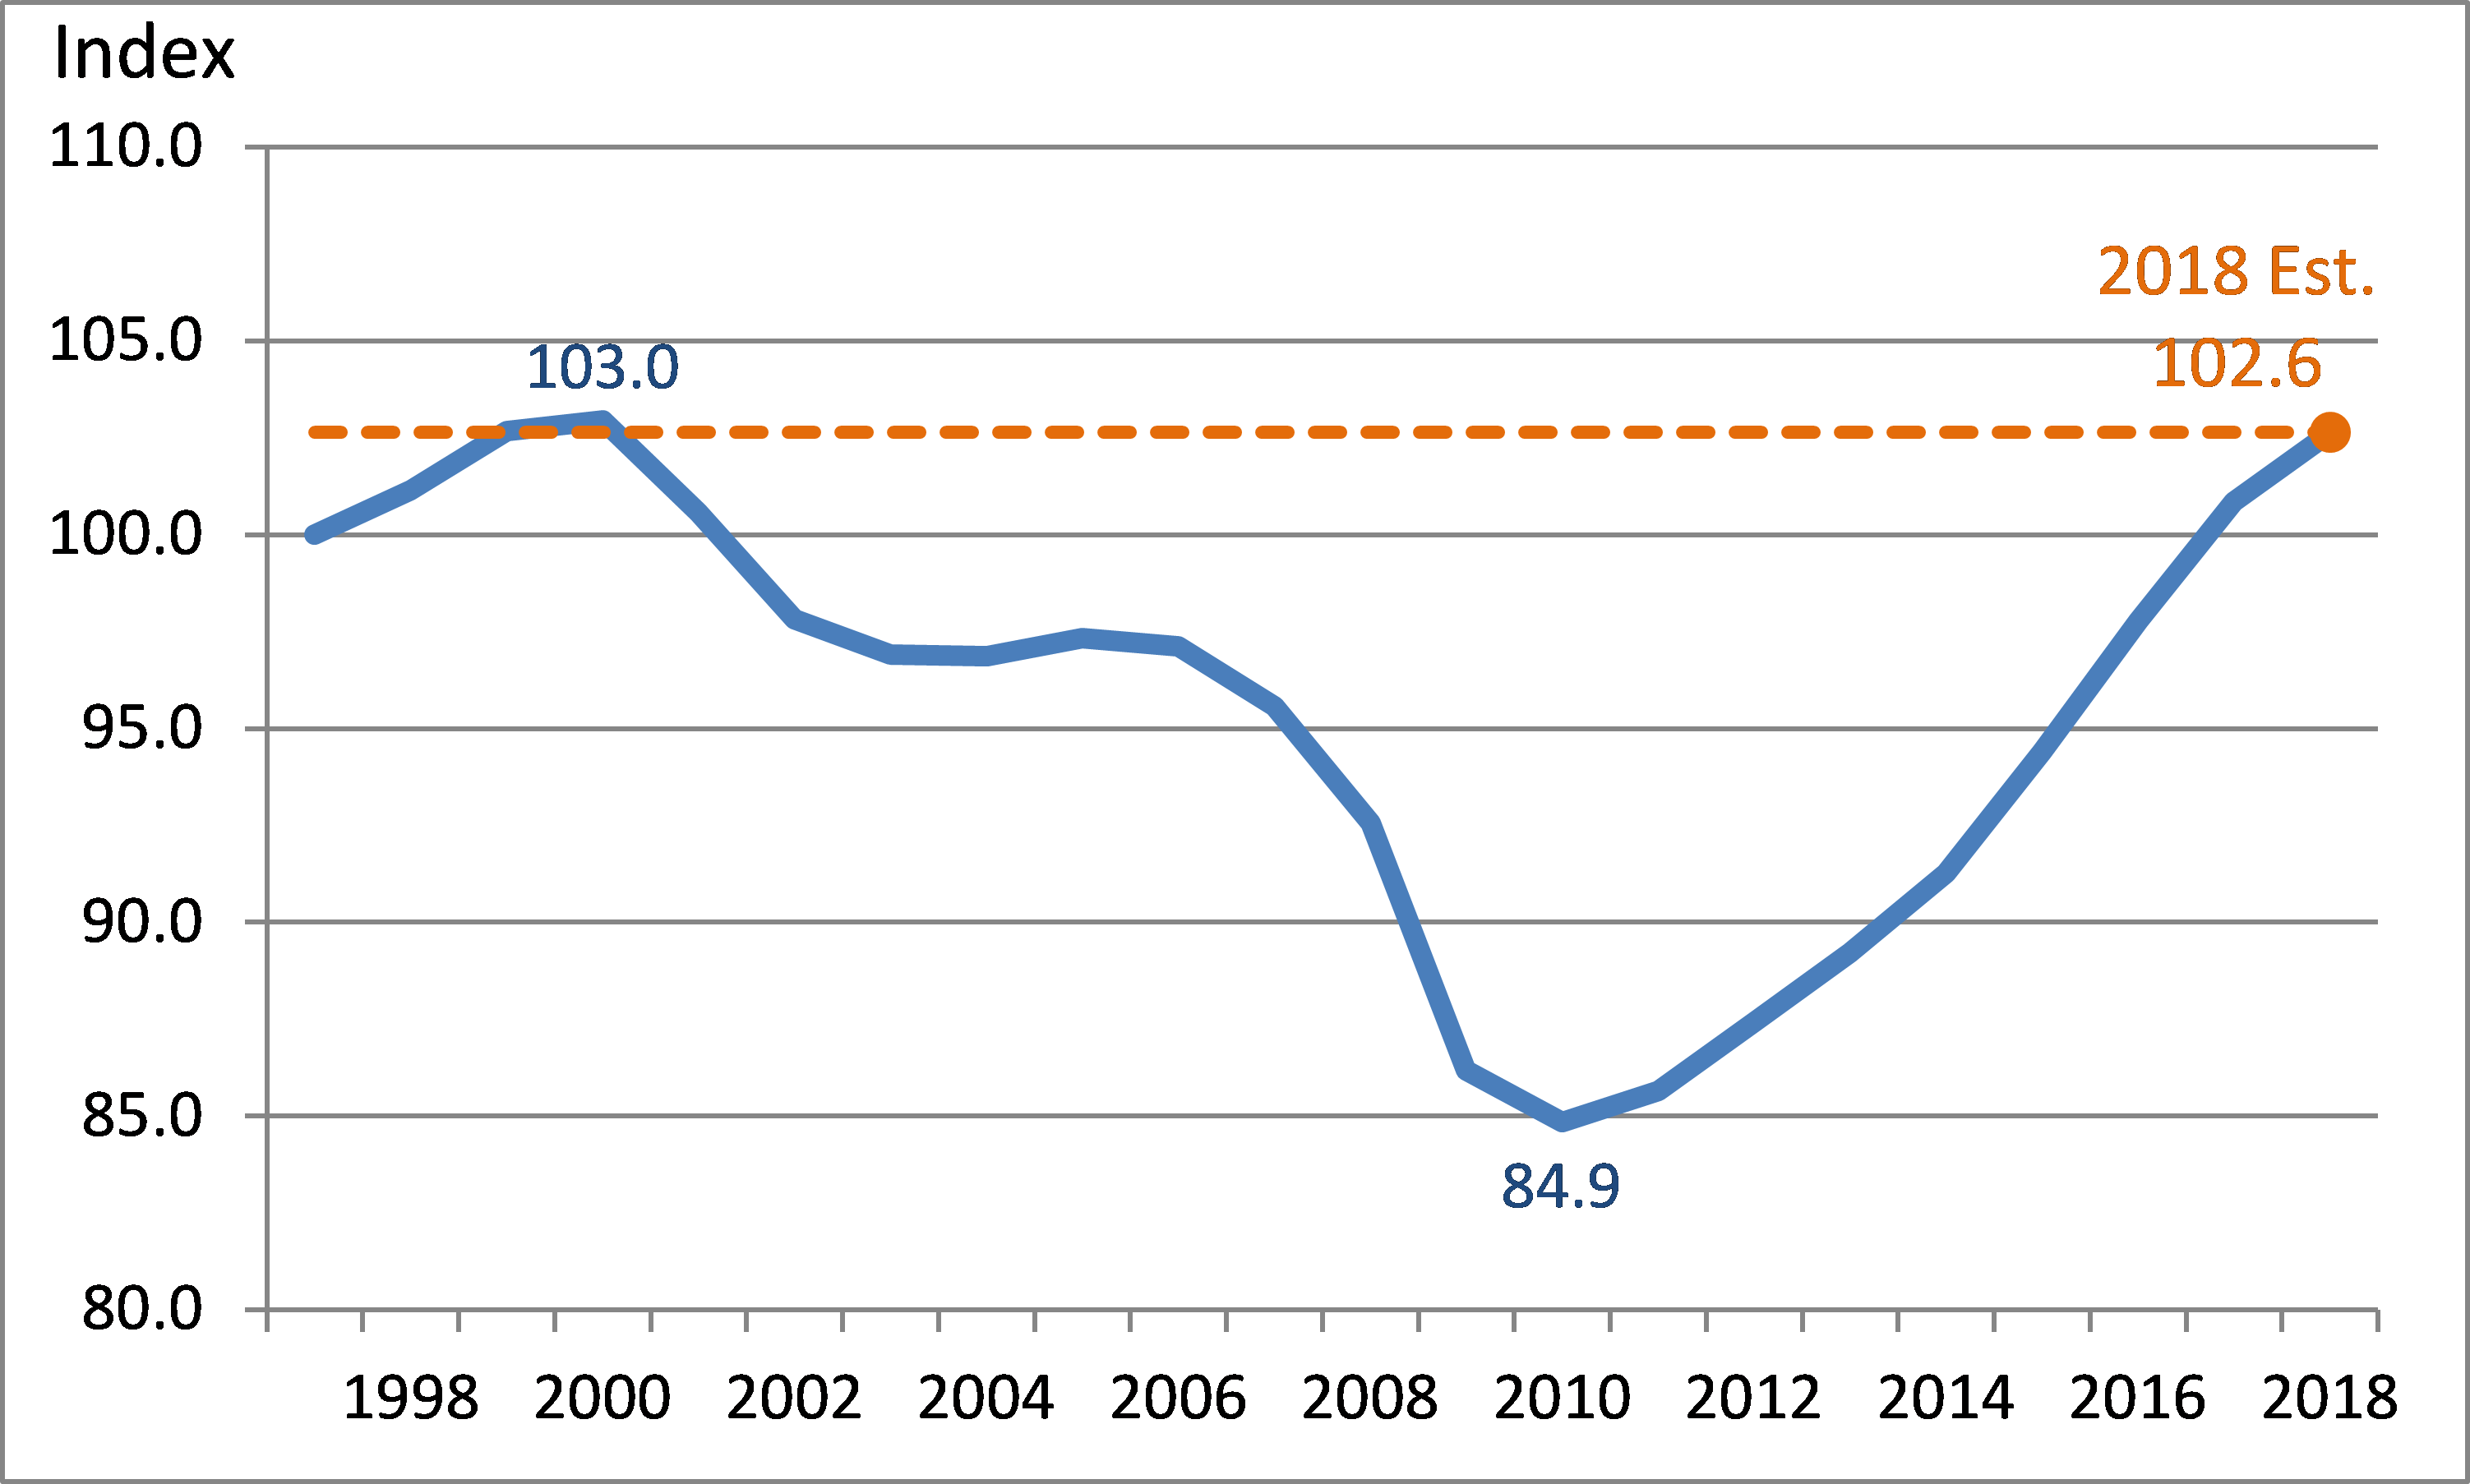
Incorporating the gross metropolitan product (GMP) data for the Detroit–Warren–Dearborn metropolitan statistical area (MSA), the DEAI model estimates that real Detroit gross city product, or GCP (see chart 2), has recovered almost all of what it lost during the 2001 and 2008–09 recessions. In fact, the Detroit GCP grew faster than U.S. gross domestic product (GDP) for three consecutive years (2015–17) following the 2008 recession. However, based on data through December 2018, the DEAI model now projects a 2018 growth rate of 1.8% for the city of Detroit. While still above trend, the city’s growth rate for 2018 is estimated to be somewhat slower than the nation’s (2.9%).
Chart 2. Detroit Gross City Product (index – 1997 = 100)
The March DEAI release (covering the first quarter of 2019) will be posted on June 6, 2019. The release data and future release dates can be found on the DEAI page of the Federal Reserve Bank of Chicago website. A copy of the December DEAI release and a summary of each individual component’s contribution to the index can be found here.
Notes
1 The values referenced in this paragraph have all been seasonally adjusted—and in the case of the labor data, they have also been adjusted for breaks in their time series resulting from the decennial censuses.


