Detroit Economic Growth Slowed in September but Stayed Above Its Long-Run Trend, According to Chicago Fed Index
The Chicago Fed’s Detroit Economic Activity Index (DEAI) was +0.06 in September, down from +0.28 in August. The index averaged +0.51 over the past year. An index value greater than zero points to the city of Detroit’s economic activity growing faster than trend, while an index value less than zero points to the city’s economic activity growing slower than trend. The complete history of the index through September 2019 is shown below (chart 1). Despite the decline in the monthly index value from August to September, a comparison of the three- and 12-month averages of the DEAI implies that growth in Detroit’s economic activity was about the same over 2019:Q3 as it was over the past year.
Chart 1. Detroit Economic Activity Index (standard deviations from trend)

Table 1 shows the contribution to the DEAI from each of the index’s four major categories (income, labor, real estate, and trade), as well as the contributions of the monthly series making the largest contributions (positive or negative) under each category. The income category made a contribution of +0.02 to the DEAI in September, which was almost exclusively due to growth in the DTE residential customer count. The labor category made the largest contribution (+0.11) to the DEAI in September, as the positive contribution from employment growth more than offset the negative contribution from unemployment. According to data from the U.S. Bureau of Labor Statistics, employment increased in September, as did the number of unemployed persons. These results imply that Detroit’s overall labor force grew. A growing labor force is a positive sign because it means that workers feel more encouraged about their prospects for finding work and are therefore willing to (re)enter the labor force in search of a job.1 Real estate’s negative contribution (–0.06) to the index in September was chiefly due to a decrease in the median home price, which was offset in part by an increase in office rents. The median single-family home price in September was $38,092—a decrease of 3.9% from its August level on a seasonally adjusted basis. Office rents moved up to $23.25 per square foot in 2019:Q3 from $21.94 per square foot in 2019:Q2—an increase of 6.0%. Trade also made a negative contribution (–0.02) to the DEAI in September—as imports were up slightly (0.2%) from August while exports were flat (resulting in a 1.6% decline in the trade surplus).2
Table 1. Contributions to the Detroit Economic Activity Index
| September 2019 | August 2019 | Change from August to September | |
|---|---|---|---|
| Income | 0.02 | 0.00 | 0.02 |
| – DTE residential customer count | 0.02 | 0.00 | 0.02 |
| Labor | 0.11 | 0.33 | -0.21 |
| – Employment | 0.27 | -0.09 | 0.36 |
| – Unemployment | -0.16 | 0.41 | -0.57 |
| Real estate | -0.06 | 0.00 | -0.06 |
| – Median home price | -0.07 | -0.03 | -0.04 |
| – Office rents | 0.02 | 0.03 | -0.01 |
| Trade | -0.02 | -0.05 | 0.03 |
| – Exports | 0.00 | 0.00 | 0.00 |
| – Imports | -0.02 | -0.05 | 0.03 |
Annual real per capita income (PCI) data for Detroit from the U.S. Census Bureau’s American Community Survey (ACS) were released around mid-September, and the city of Detroit’s actual income level of $18,427 in 2018 was remarkably close to the model’s estimate of $18,208, published in my September 5, 2019, blog entry on the DEAI (see chart 2). Detroit’s real PCI for 2018 was much lower than that of the nation ($49,628) or Michigan ($43,964). Yet, at 4.3%, the city’s year-over-year growth rate for real PCI last year was much greater than the nation’s (1.1%) and Michigan’s (1.8%).
Chart 2. Real per capita income for the city of Detroit
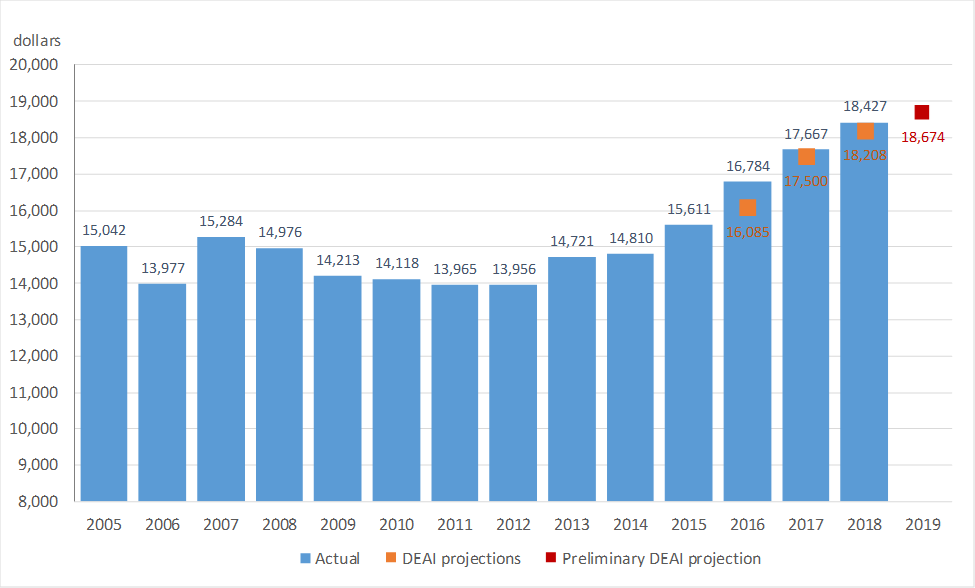
With a full year’s worth of data, the model did a very good job at estimating both the directional change and magnitude of Detroit’s real PCI for each of the previous three years (chart 2). Now that my Chicago Fed colleagues and I have three quarters of data for 2019, we can use the DEAI model and its higher-frequency data to come up with a preliminary estimate of Detroit’s real PCI for this year. Using the latest data, the model estimates that the city’s real PCI grew 1.3% on a year-over-year basis to $18,674 in 2019. If the projection holds up, 2019 would mark the seventh consecutive year of positive real PCI growth. Ahead of the next DEAI release, posting in early March 2020, we will again estimate Detroit’s real PCI for 2019—but by then, we will have four quarters of data.
The December DEAI release (covering the fourth quarter of 2019) will be posted on March 5, 2020. The most recent DEAI results and future release dates can be found on the DEAI page of the Federal Reserve Bank of Chicago website. A copy of the September DEAI release and a summary of each individual component’s contribution to the index can be found here.
Notes
1 The labor-related values referenced in this paragraph have all been seasonally adjusted, and they have also been adjusted for breaks in their time series resulting from the decennial censuses.
2 The trade-related data values referenced in this paragraph were inflation- and seasonally adjusted.


