Detroit Economic Growth Increased in June Primarily on Stronger Employment Growth, According to Chicago Fed Index
The Chicago Fed’s Detroit Economic Activity Index (DEAI) was +1.92 in June, up from –0.94 in May. The index averaged +0.46 over the past year. An index value greater than zero points to the city of Detroit’s economic activity growing faster than trend, while an index value less than zero points to the city’s economic activity growing slower than trend. The complete history of the index through June 2019 is shown below (chart 1). Despite the substantially above-trend monthly value for June, a comparison of the three- and 12-month averages of the DEAI implies that growth in Detroit’s economic activity over 2019:Q2 was weaker than over the past year.
Chart 1. Detroit Economic Activity Index (standard deviations from trend)
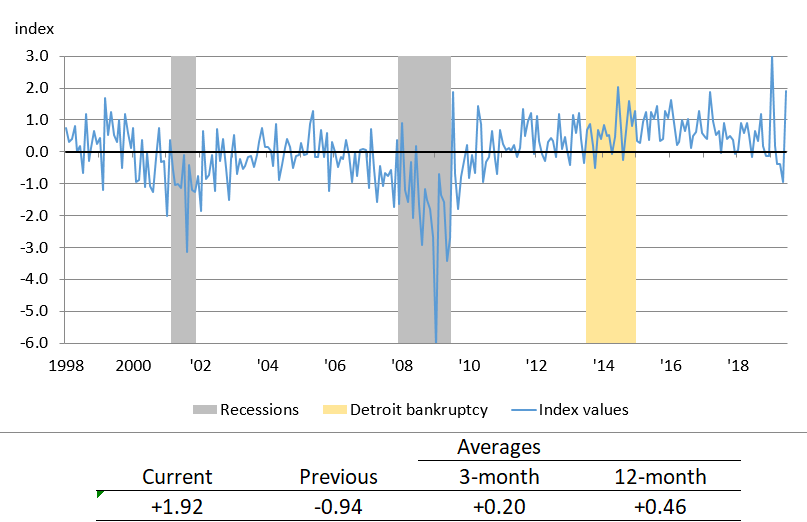
Table 1 shows the contribution to the DEAI from each of the index’s four major categories (income, labor, real estate, and trade), as well as the contribution of the monthly series making the largest contributions under each category. The labor category made by far the largest contribution to the DEAI in June, up sharply from its contribution in May. This was because, according to data from the U.S. Bureau of Labor Statistics, employment indicators rebounded in June after four months of employment declines that had contributed to pushing up Detroit’s unemployment rate above 10.1% in May (its highest level in over two years).1 Real estate’s positive contribution to the index in June was based chiefly on an increase in the median home price, as well as continued strong nonoffice rents. The median single-family home price in June was $41,000—an increase of 2.5% from May. Nonoffice rents in 2019:Q2 were reported to be $7.71 per square foot—down only slightly from $8.02 per square foot in May, but up 21.8% compared with the same period last year. Trade’s contribution to the DEAI continued to be positive in June, but decreased slightly from May as imports were down (–0.8%), though exports were up (+1.3%).2 The only category that made a neutral contribution to the index in June was income.
Table 1. Contributions to the Detroit Economic Activity Index
| June 2019 | May 2019 | Change from May to June | |
|---|---|---|---|
| Income | 0.00 | 0.00 | 0.00 |
| Labor | 1.85 | -1.06 | 2.91 |
| – Employment | 1.05 | -0.67 | 1.72 |
| – Unemployment | 0.80 | -0.39 | 1.19 |
| Real estate | 0.03 | 0.05 | -0.02 |
| – Median home price | 0.01 | 0.01 | 0.00 |
| – Nonoffice rents | 0.02 | 0.02 | 0.00 |
| Trade | 0.04 | 0.08 | -0.04 |
| – Exports | 0.03 | 0.04 | -0.01 |
| – Imports | 0.01 | 0.04 | -0.03 |
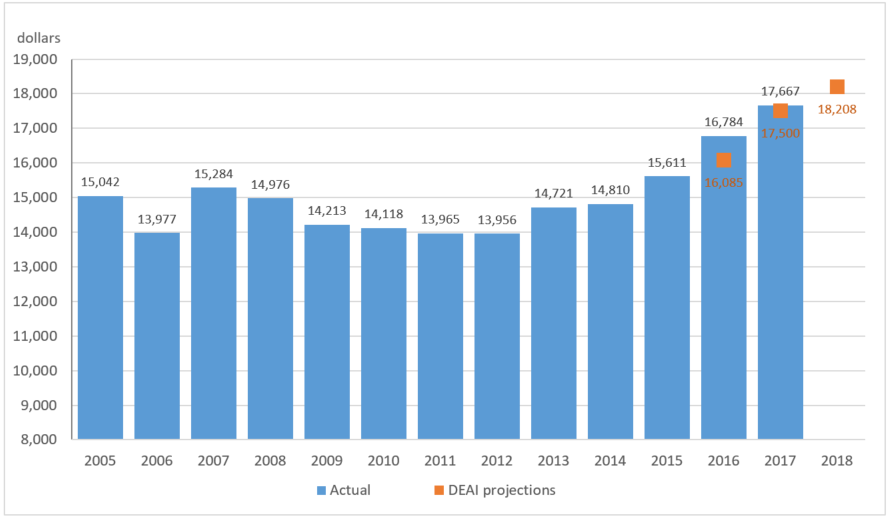
Annual real per capita income (PCI) data for Detroit from the U.S. Census Bureau’s American Community Survey (ACS) will be released later this month for 2018. However, we can use the DEAI model and its higher-frequency data to estimate Detroit’s real PCI for 2018. The model did a very good job estimating both the directional change and magnitude of Detroit’s real PCI for 2016 and 2017 (chart 2). According to the latest data, the model estimates the city’s real PCI grew 3.1% on a year-over-year basis to $18,208 in 2018. While Detroit’s real PCI estimate for 2018 is much lower than those of the nation ($49,628) and Michigan ($43,964), the city’s real PCI year-over-year growth rate in 2018 is projected to be much greater than the nation’s and Michigan’s PCI growth rates of 1.8% and 1.1%, respectively.
Chart 2. Real per capita income for the city of Detroit
The September DEAI release (covering the third quarter of 2019) will be posted on December 5, 2019. The release’s data and future release dates can be found on the DEAI page of the Federal Reserve Bank of Chicago website. A copy of the June DEAI release and a summary of each individual component’s contribution to the index can be found here.
Notes
1 The labor-related values referenced in this paragraph have all been seasonally adjusted, and they have also been adjusted for breaks in their time series resulting from the decennial censuses.
2 The trade-related data values referenced in this paragraph were inflation- and seasonally adjusted.


