Detroit Economic Growth Returns to Near Trend in September After Sharp Rebound, According to Chicago Fed Index
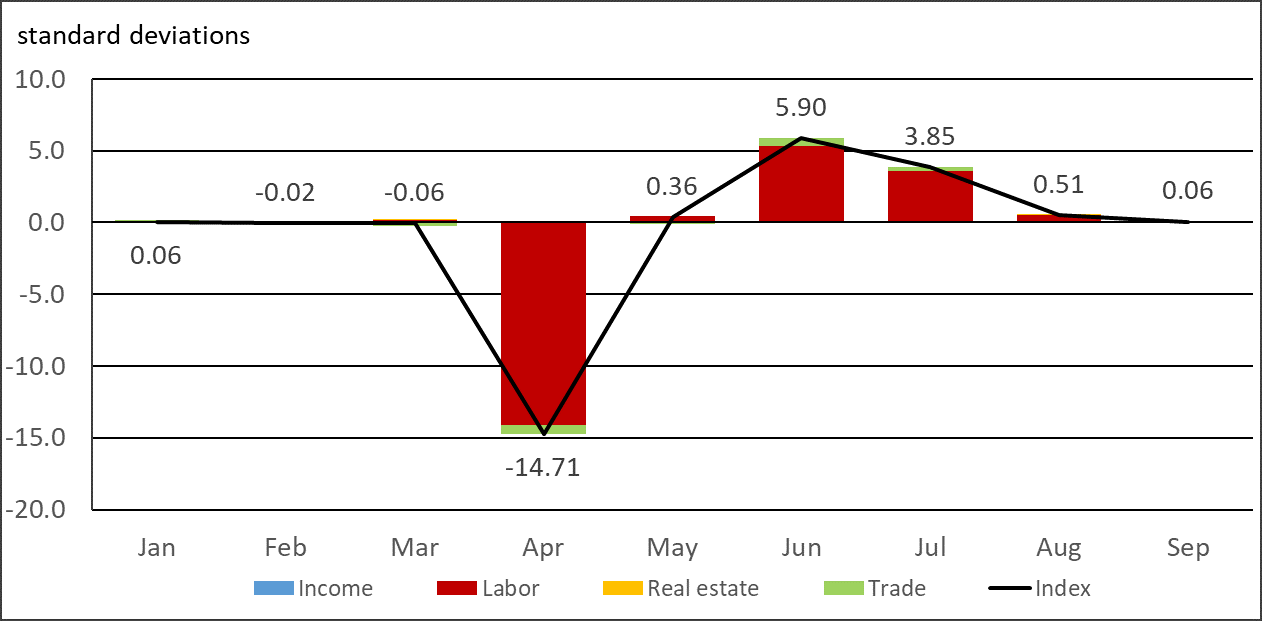
The Chicago Fed’s Detroit Economic Activity Index (DEAI) was +0.06 in September 2020, down from +0.51 in the previous month. For the entire third quarter of 2020, the DEAI value was +7.64, up from –5.21 in the previous quarter.1 The monthly index values for January through September of this year are displayed in figure 1. Also featured are visual representations of the contributions from the index’s four major categories: income, labor, real estate, and trade. An index value greater than zero points to the city of Detroit’s economic activity growing faster than trend, while an index value less than zero points to the city’s economic activity growing slower than trend. The Chicago Fed reported on September 3, 2020, that the DEAI’s record-setting value in June 2020 reflected improvements in labor and trade data following the sudden and severe impact of the Covid-19 pandemic on the city’s monthly economic activity—which started in March and worsened significantly in April. Detroit’s economy rebounded from the pandemic-induced decline in April (when the monthly DEAI reading stood at –14.71), experiencing modest growth in May (+0.36) and then extremely strong growth in June (+5.90) and July (+3.85); the city’s economic activity slowed in August (+0.51) and continued back toward trend growth in September (+0.06).
Figure 1. Detroit Economic Activity Index, by category, 2020
To clarify what transpired in the third quarter of 2020, I present in table 1 the numerical value of the contribution from each of the index’s four major categories to the DEAI for the month and quarter.
Table 1. Contributions to the Detroit Economic Activity Index, 2020:Q3
| Category | September 2020 | August 2020 | July 2020 | 2020:Q3 |
|---|---|---|---|---|
| Income | 0.00 | 0.00 | 0.00 | –0.01 |
| Labor | +0.02 | +0.50 | +3.56 | +7.15 |
| Real estate | +0.02 | +0.01 | +0.02 | 0.00 |
| Trade | +0.02 | 0.00 | +0.27 | +0.51 |
| Index | +0.06 | +0.51 | +3.85 | +7.64 |
Labor played the largest role in Detroit’s recovery throughout the third quarter of 2020 from the pandemic-induced decline in economic activity earlier in the year. This was evidenced by the labor category’s strong contributions to the index in July (+3.56) and August (+0.50), before settling down to a nearly neutral contribution in September (+0.02). Labor’s sizable positive contribution to the index in July reflected the large swings in the city’s unemployment rate over the spring and summer. The unemployment rate jumped to a seasonally adjusted rate of 46% in April, after averaging 8.7% for calendar year 2019. April’s extremely high unemployment rate was the result of a 29% decline in employment for the month, as calculated using data from the U.S. Bureau of Labor Statistics. By July, the unemployment rate had fallen to 17%, largely because 37,676 of the 67,231 jobs lost in April had been recovered. Jobs continued to return to the city, but at a slower pace, in August (5,040 jobs were added then) and September (1,588 jobs); this slowing pace accounted for the continuing decline in the labor category’s contribution to the DEAI in each of those two months.2
The contribution to the DEAI from the income category—consisting almost entirely of annual data—does not tend to change significantly on a monthly basis. We will learn considerably more about the pandemic’s impact on this category when the data are updated next year. Throughout the third quarter of 2020, the income category made a very small contribution—which rounded to zero for each of the three months, but which was calculated to be slightly negative (–0.01) for the quarter as a whole, according to the DEAI model.
The real estate category made a neutral contribution to the DEAI in the third quarter of 2020 overall. Real office rent contributed +0.03 to the category in the third quarter, but this was offset by negative contributions from the median real single-family home price (–0.01), median real condominium price (–0.01), and commercial real estate vacancy rate (–0.01).3
The trade category started the third quarter of 2020 with a large positive contribution to the DEAI (+0.27 in July). But the category’s contribution to the index dropped to zero in August before somewhat improving (to +0.02) in September. The big positive contribution to the DEAI in July was due to the significant month-over-month increases in both imports (+11.8%) and exports (+30.3%) back then. Both imports (–2.8%) and exports (–5.2%) fell in August before rebounding again in September (+8.5% and +1.8%, respectively).4
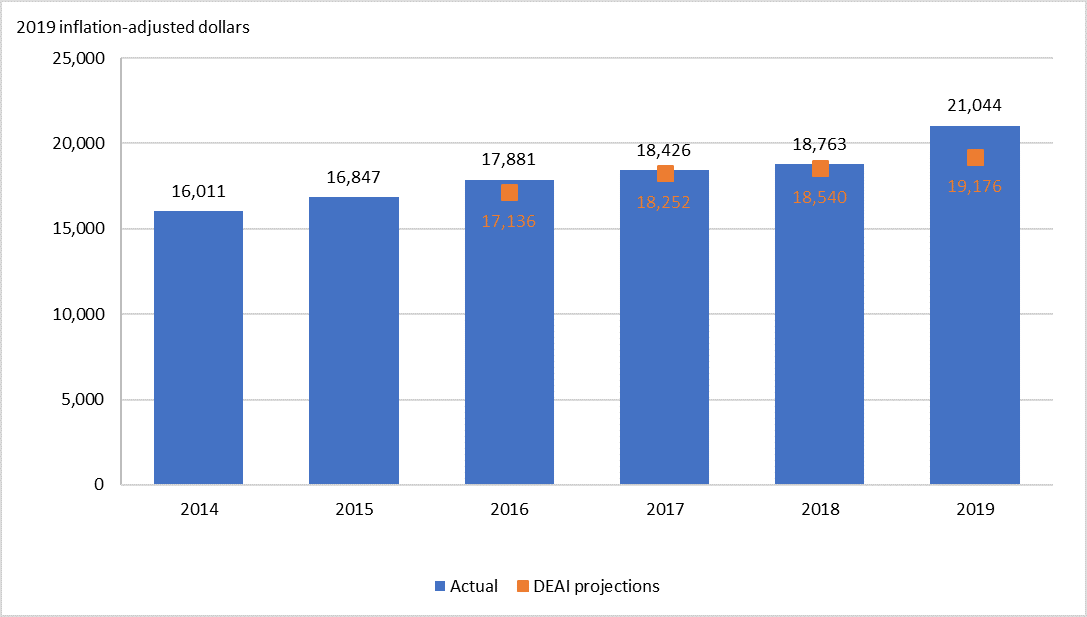
In closing, I want to discuss the DEAI’s projection for Detroit’s 2019 real per capita income (PCI) relative to the actual outcome. The U.S. Census Bureau recently released updated data for real PCI for last year in its 2019 American Community Survey (ACS) 1-year estimates. Figure 2 presents these ACS data for calendar years 2014 through 2019, as well as the DEAI model’s real PCI predictions for 2016 through 2019. According to the latest ACS data, Detroit’s real per capita income reached $21,044 in 2019, rising 12.2% from 2018 and outperforming the model’s projection. However, in 2019, real PCI for Detroit still fell well short of real PCI for Michigan ($32,892) and for the United States ($35,672)—which increased 2.5% and 3.6% from the previous year, respectively. Detroit’s per capita income still has a long way to go to catch up with Michigan’s and the nation’s, and we will have to wait another year to see how the pandemic has affected all their trajectories.
Figure 2. Real per capita income for the city of Detroit
The December 2020 DEAI release (covering the fourth quarter of 2020) will be posted on March 4, 2021. This release will include for the first time the DEAI model’s projections for Detroit’s 2020 gross city product and real per capita income. The most recent DEAI results and future release dates can be found on the DEAI page of the Federal Reserve Bank of Chicago website. A copy of the September 2020 DEAI release can be found here.
Notes
1 The quarterly and annual averages we report for the DEAI are not “simple” averages, but instead “triangle” averages of the monthly values. For growth rate measures like the DEAI, the triangle average best approximates a quarterly or annual growth rate from monthly growth rates. It gets its name from the tent-line nature of weights applied to current and past values in the averaging process. A simple average weights current and past values equally, while a triangle average has weights that peak in the recent past and are equally spaced going backward and forward in time from the peak (e.g., Q3-20 growth = (1/3)*Sep-20 + (2/3)*Aug-20 + (1)*Jul-20 + (2/3)*Jun-20 + (1/3)*May-20 growth rates).
2 All the labor-related data values referenced in this paragraph have been seasonally adjusted, and they have also been adjusted for breaks in their time series resulting from the decennial censuses.
3 All the real-estate-related data series referenced in this paragraph have been seasonally adjusted.
4 All the trade-related data values referenced in this paragraph have been inflation- and seasonally adjusted.


