Forecasting the Seventh District Super Bowl
As you can imagine, many here in Chicago are fired up for this year’s Super Bowl: The hometown Bears make their first return to the big game in 21 years. But this game is extra special for us at the Chicago Fed: The Bears are playing the Indianapolis Colts, another Seventh District team. If you are interested in such arcane trivia, this marks only the third time both Super Bowl teams represent the same Federal Reserve District (see map). The first was the New York–Buffalo game in 1991, the second was the San Francisco–San Diego game four years later.
Most football fans have been breaking down the game in terms of what might happen on the field. Will we see good Rex or bad Rex? Will Peyton Manning finally step up in a big game? Or will the Bears defense shut him down? I, however, am interested in taking a look at the matchup in terms of economic performance. That is, does the economic performance of the teams’ cities have any influence on what happens in the game?
Theories linking business activity to the Super Bowl and vice versa have been around for some time—even if they are often referenced as classic examples that correlation does not equal causality. One theory relates the performance of the Dow Jones Industrial Average between the end of November and game day: If the Dow rises over this time, the team from the city whose letter is later in the alphabet will win the game. In the case of this year’s match up, the Dow was 12221.93 on November 30 and was up to 12487.02 last Friday, so it predicts that Indianapolis will beat Chicago.
For some reason, this theory has a track record of accuracy. When Floyd Norris of the New York Times wrote about it in 1996, the theory had accurately picked 18 winners of the 21 previous Super Bowls, whereas the Las Vegas point spread had only picked the winner in 16 of 20 games.
While this looks like an impressive record, I can’t think of any reason why the Dow should affect the outcome of the game in this way (though I welcome suggestions). Why should one team (especially a team that just happens to be from a city later in alphabetical order) benefit from an increase in a stock market index that affects everyone?
Now if the theory could in some way account for the economic differences between the two cities, then I’d be more tempted to believe it could affect the game. Suppose one of the Super Bowl teams represented a city that was enjoying a period of strong growth. Its residents would feel wealthy, and they’d be more likely to attend the game. In turn, the extra fan support at the game could be enough to affect the outcome.
To explore such a theory, let’s consider the cities’ unemployment rates to indicate the difference in their relative prosperity. (Other data might be better indicators of a city’s prosperity, but the unemployment rates were what I had readily available for all of the Super Bowl teams’ cities, with a good amount of history. For the same reason, I used the city unemployment rates, as opposed to metro area unemployment, which would probably more accurately reflect the teams’ fan base.)
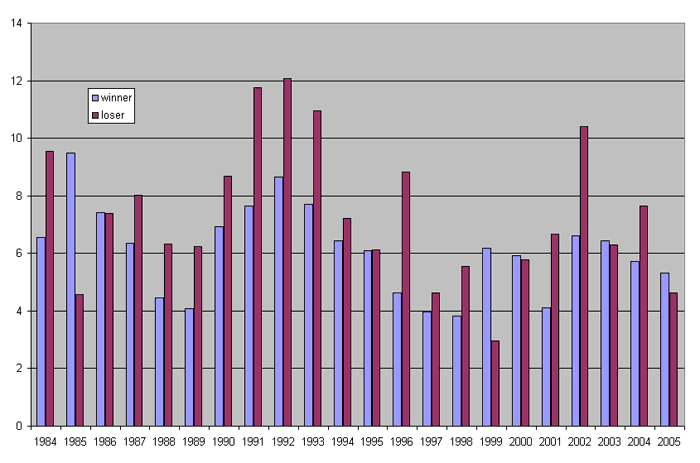
Below, I’ve added a graph showing the unemployment rates in the cities that won the Super Bowl versus the cities that lost. (The unemployment rate is the average of the monthly rates during the year indicated on the X-axis, which is the year prior to the corresponding Super Bowl. So, 1984 shows the 1984 unemployment rates in San Francisco and Miami, referring to the 1985 Super Bowl game between the Forty-niners and the Dolphins.) As you see, in 16 of the past 22 Super Bowls, the team that won the game represented a city with the lower unemployment rate.
1. Unemployment rate of the Super Bowl winning and losing cities
This would be another bad sign for the Bears. The final data for 2006 are not available yet, but through the first 11 months of the year, the Chicago unemployment rate averaged 5.4% while the Indianapolis unemployment rate averaged 5.1%.
But take heart Bears fans. Twenty-two games isn’t really a long enough track record to definitively prove anything. And the unemployment rate has only predicted 3 of the last 7 games. (Perhaps this indicates that the National Football League’s revenue sharing programs are helping teams overcome any economic deficiencies of their host cities.)
The Dow-related theory seems to have fared even worse in recent years. Using the changes in the Dow from the end of November to the end of January as a proxy, I estimate that the Dow theory has correctly predicted the Super Bowl winner only twice in the past 10 years. (Of course, that would put its cumulative record at 20 out of 31, which is still slightly better than flipping a coin.)
And if that’s not enough to comfort you Bears fans, consider this: the predictions using the Dow and the unemployment rates both failed in 1986, the last time the Bears were in the Super Bowl.
Then again everyone around here says this year’s team is NOTHING like the ’85 Bears….


