The Stability of State Economies
In recent years, Fed Chairman Bernanke and other economists have been analyzing the causes of the increased stability in the U.S. economy, a phenomenon known as “The Great Moderation.” Most of their analyses have focused on the national economy, noting that the fluctuations, or volatility, in GDP growth, employment growth and inflation have declined noticeably over the past 25 years or so. But a Philadelphia Fed economist, Jerry Carlino, recently wrote a paper that looks at the issue at the state level and finds that every state has shared in the decline in employment volatility.
Increased stability has numerous benefits for both households and businesses. When employment is growing at more stable rates, people can be more certain of their job prospects, which makes it easier to decide whether to buy a new car, for example. Similarly, businesses have an easier time deciding whether to invest in new machinery when they can be more certain about the state of the economy. In turn, better decision-making by people and businesses can minimize the potential waste in the economy created by bankruptcies and other problems that can arise when people make decisions that turn out poorly.
Comparing the average volatility (measured in Carlino’s paper as the standard deviation of quarterly changes in employment) before and after 1984, Carlino’s results show that the states of the Seventh District all had declines that ranked in the top half of all U.S. states. Michigan ranked 2nd with a 63.6% drop in volatility, Indiana 4th with 57.1%, Wisconsin 8th with 52.5%, Iowa 16th with 45.3%, and Illinois 20th with 42.7%.
The following graph illustrates how the volatility in total employment has changed over time in each of the District states, converging toward the national average.
Figure 1. 5-year standard deviation of quarterly employment growth
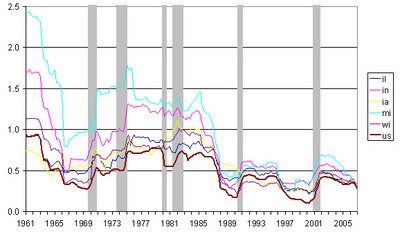
One reason for the relatively bigger declines in employment volatility in the Midwest is our concentration in manufacturing and, specifically, our concentration in durable goods manufacturing. Carlino reports that volatility in U.S. factory employment was cut in half after 1984, whereas the declines in employment volatility in services were much smaller. And by my estimates, the volatility reduction in durable goods manufacturing employment was much sharper than that in nondurable goods.
As a result, Seventh District states ranked in the top half of all states in terms of the magnitude of the decline in manufacturing employment volatility. Michigan ranked 1st with a 66.3% drop, Indiana 3rd with 63.1%, Wisconsin 7th with 56.9%, Illinois 12th with 55.7%, and Iowa 22nd with 48.8%.
I’ve also looked at other state-level data series to see if they too reveal evidence of the Great Moderation. The quarterly changes in unemployment rates show similar reductions in volatility to those seen in employment (though the state-level unemployment data only go back to 1976). Real per capita income also shows a reduction in volatility, but the relative reductions are smaller.
Figure 2. 5-year standard deviation of quarterly unemployment rate changes
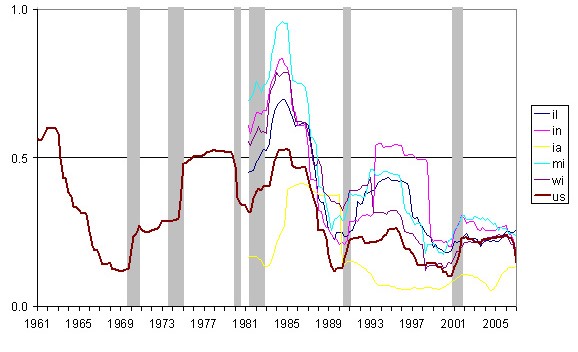
Figure 3. 5-year standard deviation of real per capita personal income growth
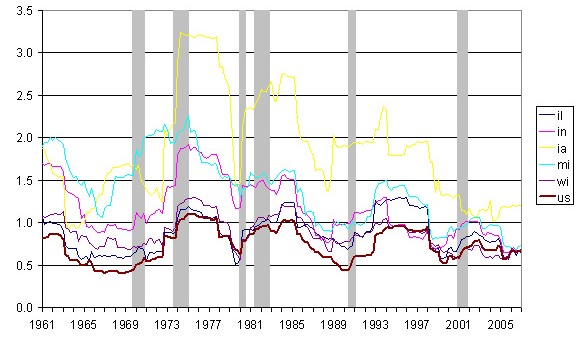
Interestingly, whereas the District’s concentration in durable goods manufacturing seemed to lead to larger reductions in volatility compared with other states, that is not the case with changes in unemployment rates and personal income. As shown in the following table, the Midwest states’ reductions in unemployment and income volatility were rather middling.
Table 1. Share of jobs in manufacturing and changes in volatility
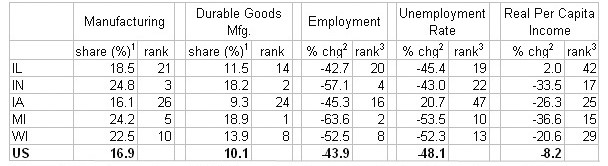
2 – Percentage difference in standard deviation of quarter changes in the 1956-1983 period and the 1984-2002 period. Source: Employment from Jerry Carlino, remainder are author's calculations based on data from BEA and Bureau of Labor Statistics via Haver Analytics.
3 – Ordered so that larger reductions in volatility result in higher ranking.
Carlino notes that the economists who have been tracking the Great Moderation have proposed numerous reasons for the decline in volatility nationwide. Explanations include better monetary policy, structural changes (such as improved inventory management, the decline of unionization, the redistribution of jobs from manufacturing to services, banking deregulation), and plain good luck, in that the economy has not faced any significant crises like the oil embargo of the 1970s.
Regardless of the causes, it is clear that changes in employment and other variables are much more stable here in the Midwest than they were 25 years or so ago. Yet while lower volatility has its benefits, it does not uniformly deliver positive outcomes. Typically, volatility rises during a recession (as shown in the graphs above) then settles back down when the economy recovers and employment expands again.
However, that has not been the case in Michigan. Its volatility in all three variables increased during the 2001 recession and retreated since then, but the state economy has not recovered. Michigan’s employment has been stabilizing around an average decline in jobs (-0.2 percent per quarter over the past five years). Its unemployment is high; in April the unemployment rate in Michigan was 7.1%, the highest in the nation. And per capita incomes in Michigan are stabilizing around slow growth of 0.1% per quarter, which is below the national average and among the slowest in the nation.
If you buy the assumption that the observed volatility affects the confidence of business and household decision-making, this means that Michiganders could be getting more certain that the local economy is heading in the wrong direction.


