The Economic View from the State Budget Trenches
It is hardly a secret that most state governments are facing tough times. Indeed, state governments are reporting that slower economic activity is affecting revenue collections. A recent fiscal survey by the National Conference of State Legislatures found a combined $140 billion deficit over the current and next budget years. Here, I am reporting the economic news coming straight from the state budget trenches in the Seventh Federal Reserve District.
For most states, some mechanism prompts an economic forecasting commission or other body to provide a prediction on where a state’s economy is headed. This type of forecast is a key component of the state budgeting process and takes advantage of the local expertise on the state’s economic conditions, which are often masked in national or regional forecasts.
Iowa
The Tax Research and Analysis Section of the Iowa Department of Revenue produces an Iowa Leading Indicators Index on a monthly basis. This index provides a useful benchmark for the state’s economic condition. The figure below shows the performance of the index relative to nonfarm employment since 1999. The index’s recent performance has shown seven straight months of decline since its peak in May 2008, and it has fallen at an annualized rate of 4.8%. However, the index score of 105.6 (1999=100) indicates that Iowa’s economy is still performing better than most states’.
Fiugre 1. Iowa leading values index and Iowa nonfarm employment coincident index: January 1999-October 2008

The index has eight components: yield spreads (ten-year Treasury notes vs. three-month Treasury notes), residential building permits, agricultural futures price index, diesel fuel consumption, average weekly unemployment claims, average weekly manufacturing hours worked, new orders index and an Iowa stock market index. Each component has a unique standardization weighting in the index.
Illinois
On November 19, the Illinois’ Commission on Government Forecasting and Accountability issued its economic and revenue update for fiscal year (FY) 2009. The commission is a bipartisan joint legislative committee with a professional staff that provides fiscal and economic information to the Illinois General Assembly.
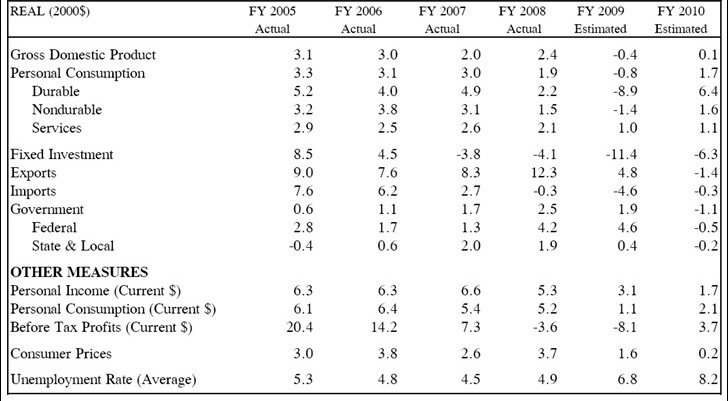
The commission’s forecast, published in November 2008, is as follows:
Table 1. Economic forecasts — November 2008 ($ change from prior year level)
The commission also considers the implications of its forecast for state revenues. The commission suggests that base revenues for FY2009 will be down 1.9% ($550 million) from the previous year. See the following table:
Table 2. CGFA estimate fiscal year 2009 vs. actual fiscal year 2008 ($millions)
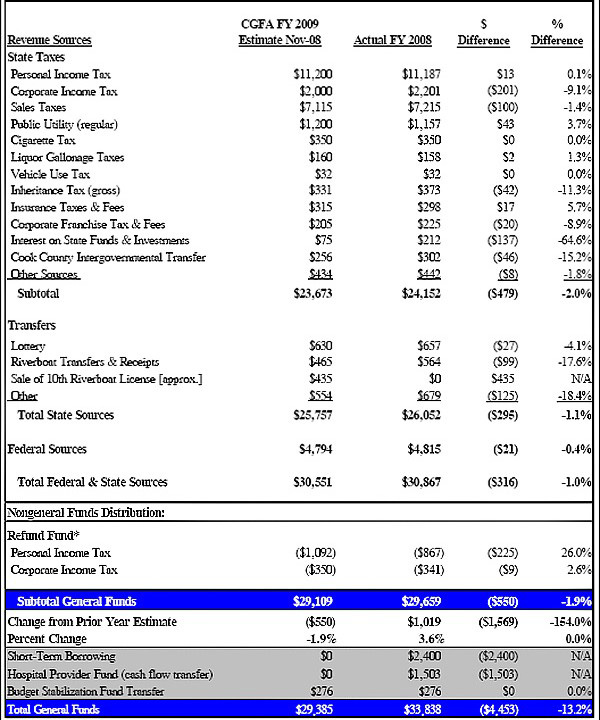
Source: CGFA
The commission also has an estimate for the revenue shortfall for FY2009 versus the budgeted expectations. This estimate is more pessimistic with revenues coming in over $1.3 billion short of budget expectations.
Michigan
Michigan’s House Fiscal Agency provides frequent updates on revenue trends and periodic updates on the state’s economy.
The November revenue forecast showed FY2008 year-to-date revenue up 8.2% for 13 major taxes and the lottery. The gains reflect changes to Michigan’s tax structure, particularly for personal income and business taxes.
In addition, the University of Michigan does a statewide economic forecast. The most recent one was released on November 21. The forecast highlights Michigan’s weak labor market conditions and anticipates that employment in the fourth quarter of 2008 expected to fall at an annual rate of –4.7%. The first half of 2009 is not likely to be much better with a predicted annual rate drop of –3.2%. Even with modest recovery in the second half of 2009, employment is forecasted to drop at an annual rate of –2%. Not surprisingly this translates into anemic nominal personal income growth of 0.7% in 2009 and 1.2% in 2010.
Wisconsin
The Wisconsin Department of Revenue issues a quarterly Wisconsin Economic Outlook. This document includes useful detail on employment and income trends in the state and a comprehensive forecast of the U.S. economy. The August report noted the slowdown in the state’s economy and projected that job growth in the state would turn negative this year. After job growth of 0.5% in 2007, declines of 0.5% and 0.4% in 2008 and 2009 are predicted. This anemic job growth will spill over into personal income growth, forecasted to be a weak 3.4% in 2008 and 2.6% in 2009. (The report notes that the 2008 income growth was aided by the federal stimulus action.) In contrast, personal income rose 5.3% in 2007.
The state budget director recently announced that November revenue projections for FY2009–FY2011 were off an estimated $3.5 billion from the June projections. There is now an estimated budget deficit of $5.4 billion (17% of the budget) from fiscal 2009–11 budget years. This is the largest deficit in Wisconsin’s history.
Like other states in the Seventh District, Wisconsin is just beginning to recognize the weakness of its revenue collection. The latest monthly statements for October showed revenues declining –2.5% for the month, although year-to-date revenues are still positive at 2.4%. On an individual tax basis (year to date), the personal income tax is up 5.6% (because of tax law changes), while the sales tax has declined –2.5% and the corporation tax is down –20.8%.
Indiana
Indiana’s bipartisan State Budget Committee issues periodic revenue and economic forecasts for the state. The most recent forecast was issued on December 11, and it predicted the state would collect $721 million less in tax dollars in the current budget cycle compared with a forecast that had been made one year ago. The state’s budget surplus has shrunk from $1.4 billion to $600 million in response.
The more pessimistic revenue forecast is based on an economic forecast produced by IHS Global Insights. The IHS forecast suggested that the current recession would be the longest in post-World War II history and would see unemployment hitting 9% before the state’s economy improves.
Vanessa Haleco-Meyer provided valuable assistance in producing this blog.


