Where are the Jobs? Midwest Jobs Recovery by State and Sector
The Great Recession, which lasted from December 2007 through June 2009, had a profound effect on U.S. employment. At its height, U.S. unemployment reached 9.5% and job losses totaled approximately 7.3 million. The current recovery is now entering its eighth year, so it may be a good time to take a look at how many jobs lost during the recession have been recovered as one measure of the nature of the labor recovery. In this blog, we examine the pattern of recovery for all five Seventh District states (Iowa, Illinois, Indiana, Michigan, and Wisconsin) in four industry sectors that were heavily impacted by the recession—construction, finance (finance, insurance and real estate or FIRE), manufacturing, and professional and business services.
Figure 1 provides evidence of the job recovery through September 2016 across industries for the U.S. and the five Seventh District states. The first column for each state shows the number of jobs lost in that sector during the Great Recession (in thousands). The second column shows the number of jobs added during the current recovery (in thousands). And the third column shows the recovery rate (jobs added divided by jobs lost in percent). To provide some perspective on the concentration of each industry’s employment within the state relative to the U.S. total, the fourth column shows an employment location quotient. For example, if you look at Illinois, employment in professional and business services is 1.10 (or 10%) above the U.S. total.
Figure 1. Change in employment: Seventh District states and U.S.
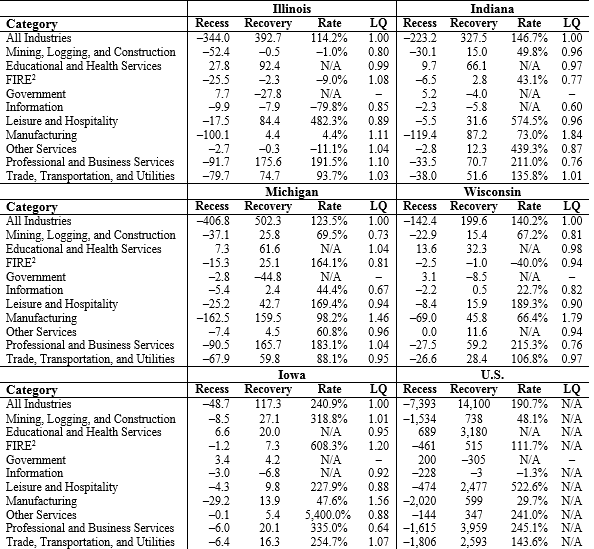
Recovery rate is N/A when there is positive employment growth during the Great Recession, or when employment during the recovery period declines at a rate greater than, or equal to, the rate during the Great Recession.
Location quotient (LQ) is the average of the industry's share of total employment in the state, relative to the same industry's employment share in the U.S., from 2007 to 2015. The LQ for All Industries is the national LQ.
Source: Bureau of Labor Statistics Current Employment Statistics, authors' calculations.
The first thing to notice is that there is considerable variation in job loss and recovery both within sectors and across states. Two industries, health and education and government, actually added jobs during the recession (except in Michigan, where government employment decreased). However, while job gains have been sustained for the health and education sector, government has actually contracted during the recovery. At the other end of the spectrum, job losses were largest in manufacturing, construction (mining, logging, and construction), and transportation (trade, transportation, and utilities). While transportation has seen a strong recovery (143.6% nationally), the job recovery in manufacturing is only 29.7%, and in construction the figure is 48.1%. On a state level, total non-farm employment recovery ranges from a low of 114.2% to 240.9%. Based solely on this measure, the best job recovery rate among Seventh District states would appear to be in Iowa and the worst in Illinois.
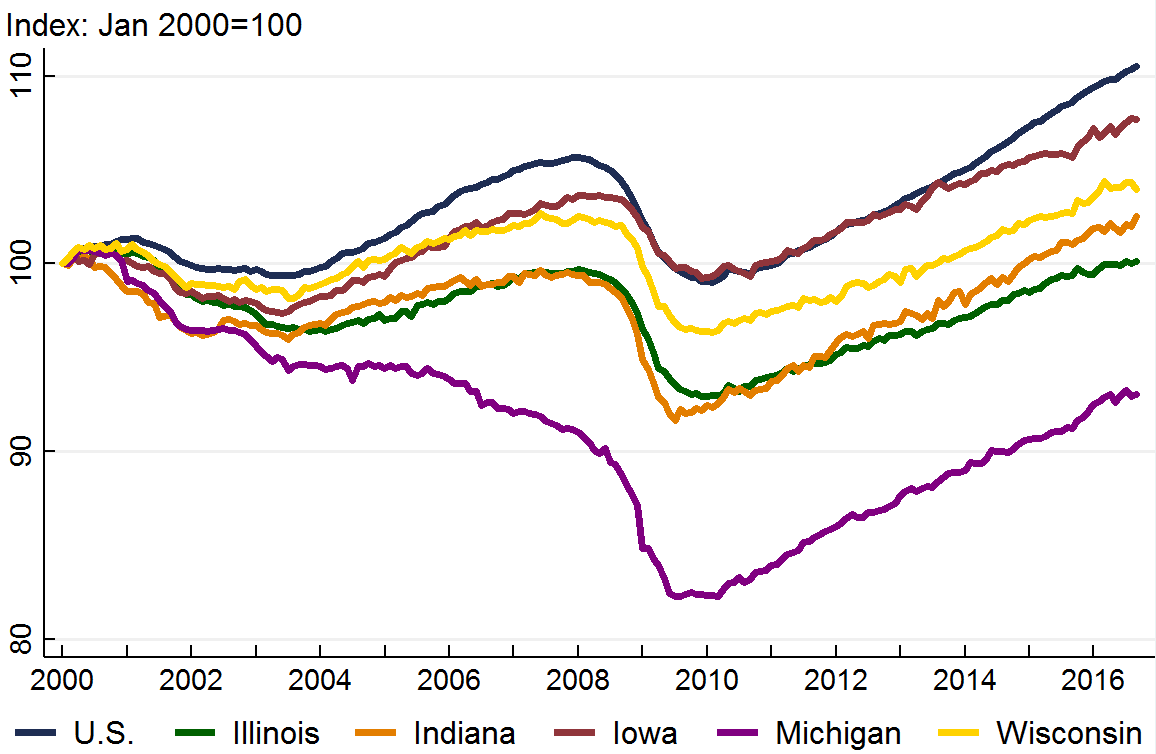
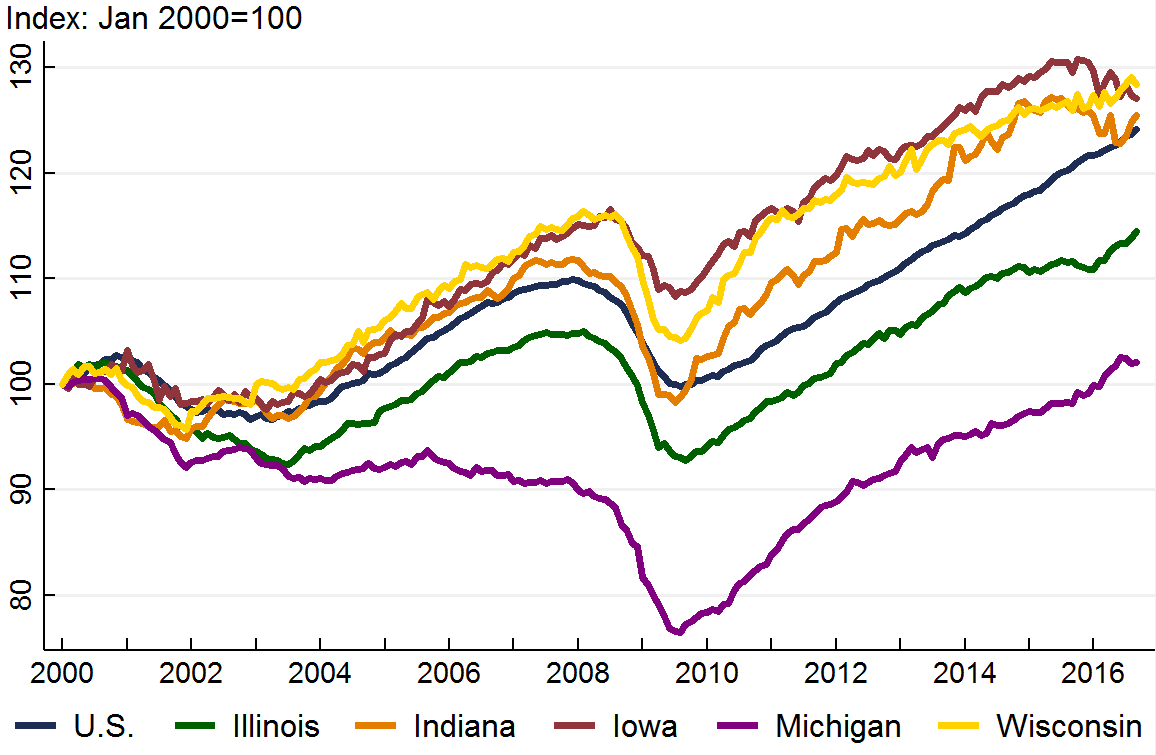
Iowa has consistently outperformed the region and the U.S. in job recovery, both in aggregate and by sector, since the end of the Great Recession (figure 1). A clear contributor was the role of agricultural production and rising farm incomes that the state experienced up until 2015. Currently, low crop prices are weighing on farm incomes, so it may be that this pattern of growth is starting to flatten out. As figure 2 shows, over the longer time horizon, Iowa tracked the rate of U.S. job growth coming out of recession but shows a noticeable divergence starting in 2014.
Figure 2. Total nonfram payroll employment
Michigan entered the Great Recession significantly weaker than other states in the region and the U.S. as a whole, having continued to lose jobs and suffer economic decline through the recovery from the 2000–01 recession. However, since the end of the Great Recession, the state’s job recovery has accelerated. Particularly noticeable is that Michigan has almost fully recovered its lost manufacturing jobs (98.2%), far exceeding the U.S. (29.7%) and significantly better than Indiana, the most manufacturing-intensive state in the region (73%). Clearly, the auto recovery has been a boon to the state.
Illinois has clearly underperformed both the region and the nation in post Great Recession job recovery, both in aggregate and across industry sectors. While Illinois has more than recovered the total number of jobs it lost during the recession (114.2%), only two sectors of the state’s economy have significantly gained jobs. The leisure and hospitality sector is up 482.3% and the professional and business services sector is up 191.5%. While wages in professional and business service jobs are relatively good, the gains in leisure and hospitality are likely to be lower paying jobs. Now, we look at job performance since January 2000 in four key industries—construction, finance, manufacturing, and professional and business services.
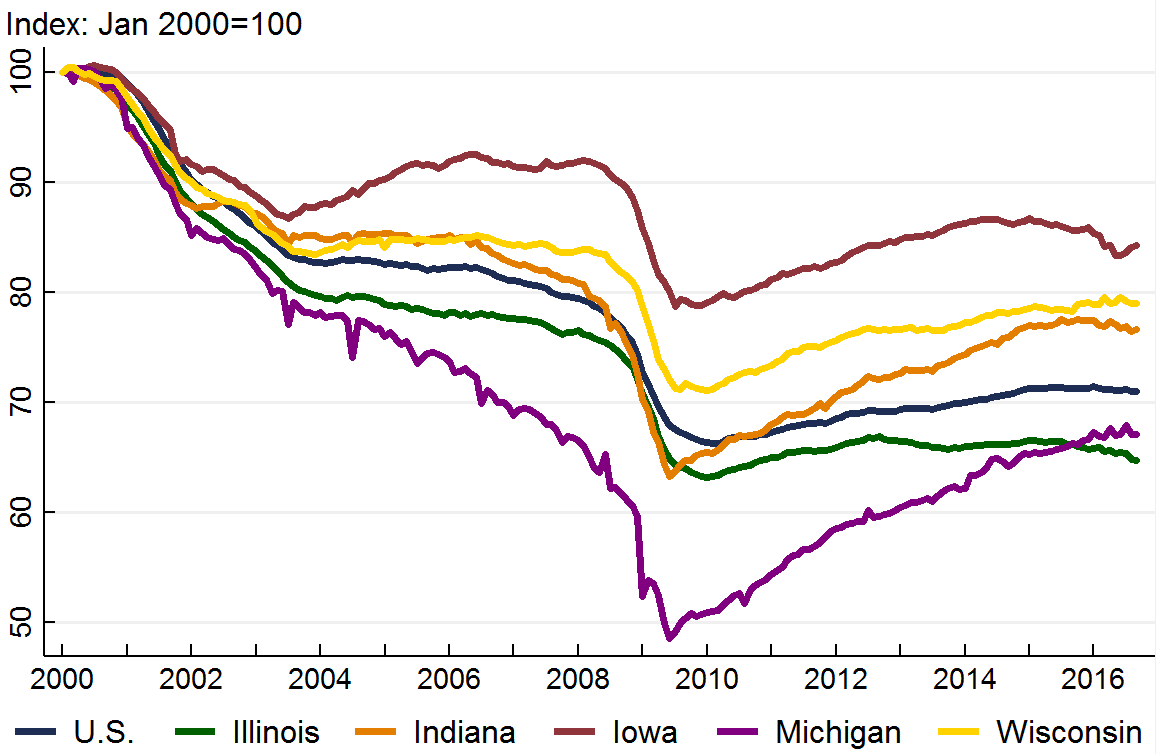
Construction
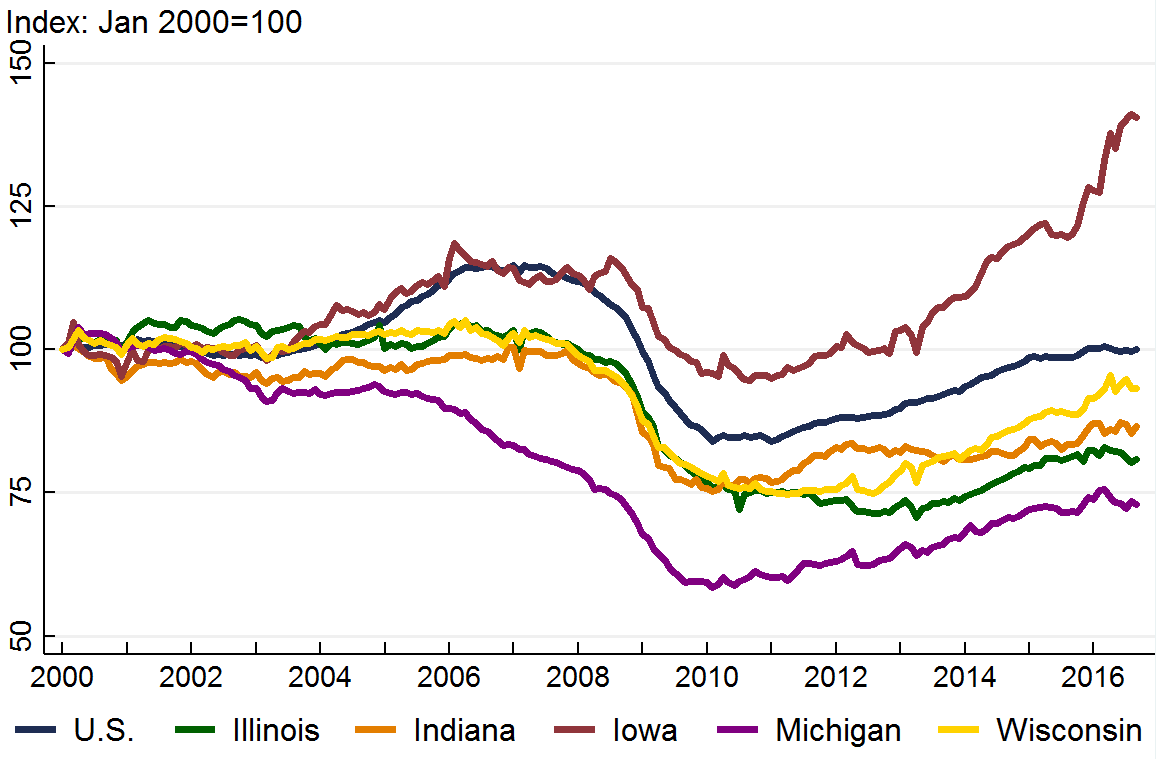
As we see in figure 3, construction employment in the Seventh District states has underperformed the U.S. with the clear exception of Iowa, which has seen a gain of 40% over the 2000 level. U.S. construction employment has returned to its 2000 level, while the remaining four Seventh District states have yet to reach their January 2000 level, with Michigan particularly hard hit—off roughly 25% over the period. The loss in jobs was particularly sharp in 2009 through 2012. Since then, jobs have gradually but steadily come back.
Figure 3. Mining, logging, and construction
Finance, Insurance and Real Estate
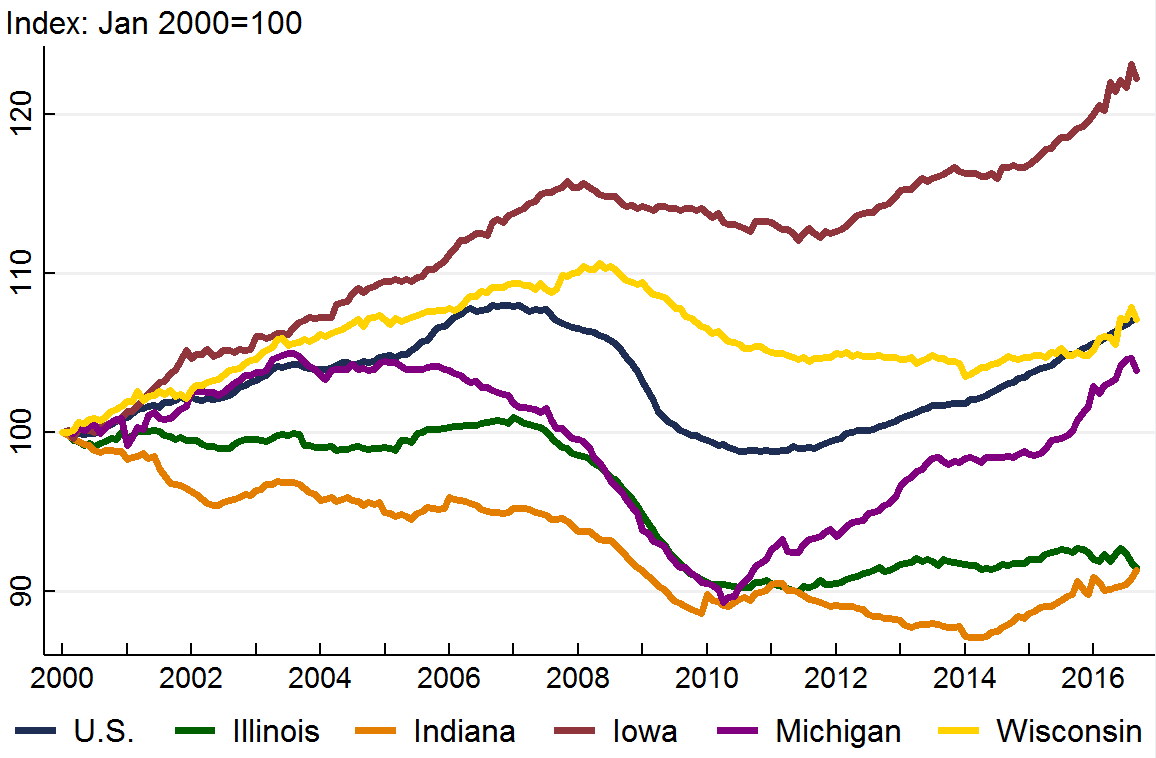
Like construction, finance experienced a boom running up to the Great Recession, followed by a sharp contraction during the recession. Figure 4 indicates that the employment declines in this sector were most pronounced in Illinois, Indiana, and Michigan. Recovery rates are now above the 2000 level for the U.S., Wisconsin, Iowa, and Michigan. Where recovery has clearly lagged is in Illinois and Indiana.
Figure 4. Finance, insurance, and real estate
Manufacturing
Manufacturing has been seen as a relatively good news story during the recent recovery. Particularly in the automobile industry, production levels have been consistently high. In addition, export-led capital goods had strong sales growth until the past couple of years. The question is has the rebound in output been reflected in employment? Figure 5 shows that manufacturing continues to follow a stair-step path when it comes to employment. Since 2000, after a shock, employment steps down; during recovery it tends to level off and not fully recover. Manufacturing continues to see a trend toward higher production with fewer labor inputs. For example, even in Michigan, with record-level auto production, manufacturing employment is still 30% below its 2000 level. Similarly in Indiana, the most manufacturing-intensive state in the Seventh District, employment is still roughly 25% below the 2000 level.
Figure 5. Manufacturing
Professional and Business Services
The sturdiest employment performance emerging from the recession has been in professional and business services. Figure 6 shows that all five Seventh District states (and the U.S.) now have professional and business service employment levels above the 2000 level. Admittedly, the sector was not hit as hard by the recession as many others. Indeed, in many cases employment levels remained above the 2000 level during the worst months of the recession. The clear laggard is Michigan. As the figure shows, Michigan was shedding professional service jobs during the expansionary period emerging from the 2000 recession and then faced an even sharper downturn during the Great Recession. As such, it had had more ground to make up, and by early 2016 it had moved back up to its January 2000 level.
Figure 6. Professional and business services
Conclusion
There is little doubt that aggregate employment growth has rebounded from the depths of the Great Recession. However, as we see in the data, the distribution of those gains has been uneven across states and industry sectors.


