Net Migration and Regional Adjustment
How do regions adapt following economic calamities that displace large numbers of workers? In the best case scenario, they reinvent themselves. For example, economist Ed Glaeser documents the several times that Boston rose from the ashes following collapse of its shipping and old line manufacturing industries. In a similar vein, Detroit hopes to rebuild as an economy based on logistics, energy, and high-tech manufacturing—especially next generation automotive technology and production.
However, in many more instances, rather than a quick turnaround, cities and regions undergo a painful adjustment period that leaves them smaller than in their heyday. In the process of adjustment, economists have shown that, following an economic shock, unemployment rises for several years before returning to more normal levels. Using the steel- and auto- related job losses in the early 1980s as an example, a paper discusses the long-run effects of massive job losses. The authors found that after an initial spike in the unemployment rate in the impacted local economies, the rate converged back to the national average after five or six years. However, high out-migration (and low in-migration) led to this reduction in unemployment, rather than an increase in new jobs. Similarly, a landmark study found that those U.S. multi-state regions that experienced downward employment shocks returned to a more normal path of employment growth within five to ten years. However, the lost jobs were never recovered.1
One lesson from such studies is that the ability to migrate from distressed areas can be helpful in restoring the lives and livelihoods of households that undergo economic displacement. Recently, there has been concern that the migration mechanism is broken or impaired. William Frey and others have documented a fall in interstate migration during the recent recession, along with a longer-term decline over recent decades. Nonetheless, much of the long-term decline is gradual and mobility in the U.S. remains high relative to other nations and continents.2
In the current environment of high unemployment and a weak housing market, some analysts have attributed dampened mobility of the labor force to falling house prices and “negative equity” or underwater households—that is, homeowners who owe more on their existing home mortgage than their home is worth on the market. Some economists posit that negative equity in a home may hamper the ability of the homeowner to move to a new labor market because they are “locked-in” to their existing house by their inability to raise funds to pay off their mortgage. A staff report from the New York Fed found that negative equity does reduce the probability of moving. However, in a rebuttal paper using the same data but differing coding of movers, the author concludes that negative equity does not make homeowners less mobile. If anything, a homeowner with extremely negative equity is actually slightly more likely to move than an individual with smaller negative equity. Using statistical analysis, the author finds that negative equity actually increases the probability of moving by 1 to 3 percentage points; this represents an increase of 10 to 18 percent of the overall probability of moving. Dan Aaronson, has conducted some preliminary research that finds that differences in migration rates of homeowners and renters barely changed during the recession and early parts of the recovery. Since renters should not suffer “house lock,” this evidence suggests that the migration process has not been hampered by falling home prices to a large degree. Similarly, Mark Partridge et al find that the migration falloff in the recent decade may fundamentally reflect heightened risk aversion of U.S. households.
Midwest
So, how does this all play out in the Seventh District? Despite some impairments to mobility, interstate migration appears to be well underway in the region, especially in those states, such as Michigan, that have experienced the most damaging employment shocks. Michigan has been an outlier in its high unemployment rate, which has been well above those of the rest of the District states since 2004.
1. Unemployment rate by state
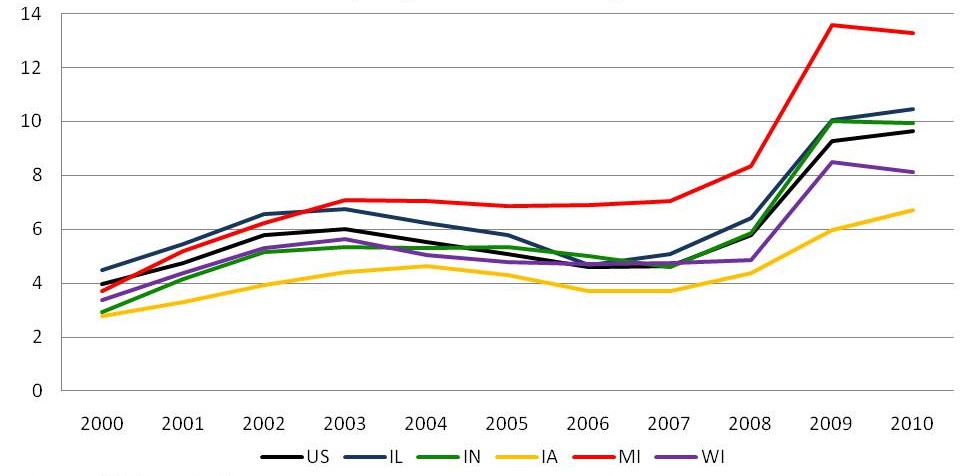
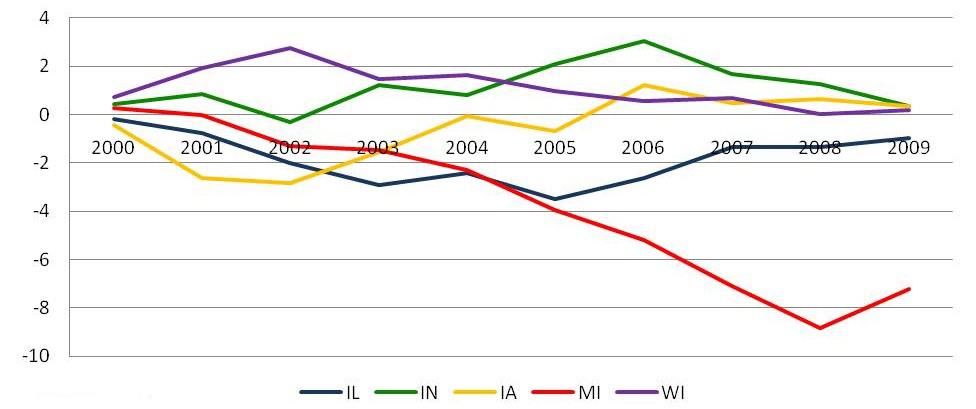
As seen below, Michigan started experiencing net out-migration during the recession in the early 2000s. However, the out-migration rate picked up speed around 2004/2005 as Michigan’s unemployment rate started to drift higher than those of the other Seventh District states. Net out-migration from Michigan remained relatively high, at around 8 per 1,000 people, from 2007 through 2009.
2. Net migration rate by state (per 1,000 residents)
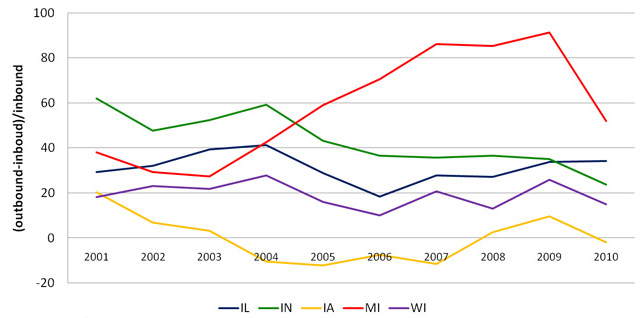
To check more recent trends, we turn to data released from United Van Lines and Atlas Van lines as they track interstate movements of U.S. households around the country. They have been tracking this data for a long time and so provide some historical data. In the chart below, we combine both companies’ data to try to produce comprehensive results and remove any anomalies that one company may experience in their sales.3 We plot the outbound migration gap, or the extent to which the number moving out of the state exceeds those moving in. In the early 2000s, Michigan’s gap is in line with the rest of the Seventh District but, again, starting around 2004/5, Michigan’s gap greatly widened compared with the other states’ gaps, consistent with the unemployment observations above. The gap continued to grow during the recent recession; it recently began to trend back down, but still remains at higher than the rest of the District states’.
3. Outbound migration gap 2000-2010
Net out-migration is not a preferred solution to economic shocks for many reasons. Moving can be costly in terms of out-of-pocket expenses, and households can suffer from the severing of social ties as well as difficulties in learning how to negotiate daily living in new communities. Nonetheless, mobility can be a helpful part of the adjustment process when it allows workers and households to improve their standard of living and well being following a negative shock to local employment. For this reason, and in response to today’s difficult employment situation, researchers are asking whether public policy should intervene to assist those unemployed workers who would benefit from re-location, but who lack the funds to re-locate in search of jobs. One recent idea has been explored by Jens Ludwig and Steven Raphael. They “propose the creation of a “mobility bank” that would help finance the residential moves of U.S. workers relocating either to take or search for work….in depressed areas of the country.” These loans would be “amortized over a fairly long period (10 years), and repayment terms be contingent on the borrower’s post-move employment and income.” The paper suggests that the program costs would compare favorably to alternative federal programs designed to achieved re-employment.
Footnotes
1 In contrast, Timothy J. Bartik finds persistent effects of shocks on unemployment rates and labor force participation; See here.
3 There may be some sample bias of individuals that actually use movers versus those that rent a truck and move themselves.


