Great Lakes’ manufacturing job loss in perspective
Residents of the Great Lakes states have been long familiar with the ups and downs of manufacturing jobs and with the shocks to local economic conditions when factories close and whole industries all but evaporate. There are many policy issues attendant to these events revolving around responses such as work force training, industry assistance, and community efforts to diversify these communities’ industry bases. Rather than addressing such issues, we’d simply like to offer a perspective on the extent and nature of manufacturing job loss from the most recent decade to date. The data on job counts in manufacturing show that these losses have been unparalled in many respects.
The data in the chart below display total jobs in the manufacturing sector since 1969 (as constructed by the Bureau of Economic Analysis of the U.S. Department of Commerce).1 The geography of these jobs (counted in millions) is defined by the BEA as the “Great Lakes Region,” which includes the states of Ohio, Indiana, Michigan, Wisconsin, and Illinois. These five states have long been considered to be the core of the “industrial belt” that more broadly ranges westward from Western New York and Pennsylvania into eastern Iowa and Missouri. And so, the experience of these five states should describe the experience of the nation’s industrial belt.
A look at the chart beginning in 1969 shows that, during the recessions of the 1970s, there were sharp declines and recoveries in manufacturing jobs. But later on, from 1979 to 1983, the bottom fell out, as more than one in five manufacturing jobs were eliminated from peak to trough. Contributing factors were many:
- The nation experienced two (back-to-back) recessions during the early 1980s.
- Interest rates were climbing and the value of the dollar versus foreign currencies rose sharply, which instigated declining domestic investment in capital goods and exports abroad.
- In domestic markets, competition from abroad in industries such as primary steel production and construction equipment was keen.
- The farm economy, an important customer of the Midwest machinery industry, experienced deep declines in income and associated capital investment.
- Defense expenditures were rising, but to little effect in the Midwest region.
The national economic recovery beginning during 1983 was sharp, which lifted Midwest manufacturing jobs somewhat, especially in the automotive sector. However, although the 1990s were also robust in the region, levels of manufacturing jobs remained largely flat, never again approaching their pre-1980 levels.
Chart 1. Jobs in manufacturing 1969-2010 (Great Lakes)
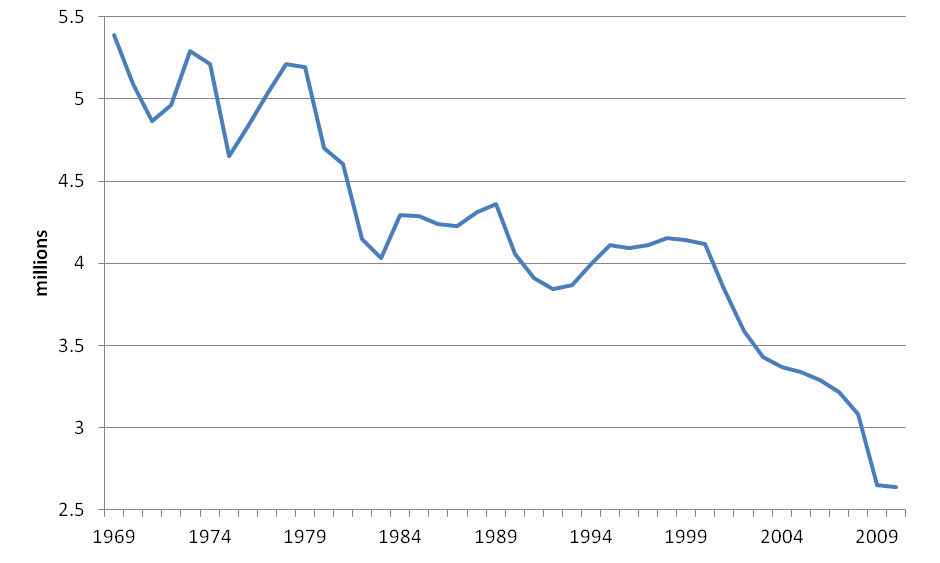
As the chart also shows, the Great Lakes has experienced its second profound decline in manufacturing jobs over the past 10–15 years. During that time, through two recessions and two recoveries, Great Lakes manufacturing employment has fallen continually. From a 1998 peak of 4.2 million jobs, manufacturing levels fell to 2.7 million in 2010, a decline of approximately 1.5 million. By both absolute and relative standards, the extent of this job loss exceeded that of 1979–83 when 1.2 million manufacturing jobs were lost peak to trough. Rather than the one in five jobs lost of the earlier period, the 1998–2010 experience amounted to a one in three loss of manufacturing jobs.
Chart 2. Jobs in manufacturing (Great Lakes)
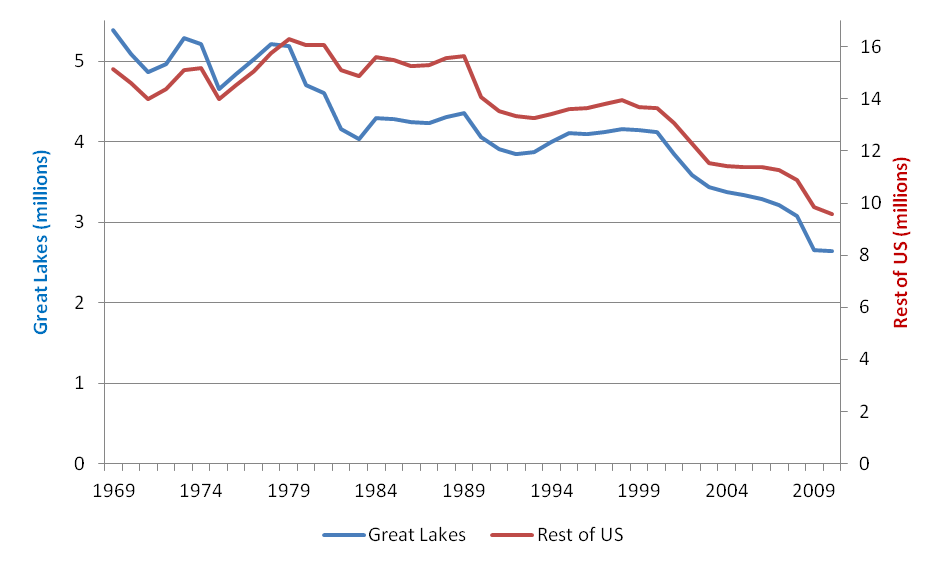
How does the Great Lakes’ experience compare with that of the rest of the U.S.? The chart above compares job levels between the two, accurately scaled according to their relative manufacturing size in the beginning of the period. Over the entire period from 1969 to 2010, manufacturing jobs declined markedly across the United States. Overall, the Great Lakes decline was only moderately steeper. However, the Great Lakes region’s employment base had been and continues to be more concentrated in manufacturing. Accordingly, manufacturing job losses have a more significant impact on this region’s work force and communities, on average, than they do elsewhere.
To illustrate this point, the table that follows indicates the percentage decline in manufacturing jobs from the previous peak years during the late 1990s (column 1). At the peak, the second column indicates just how prominent the manufacturing sector was as a share of total jobs in particular states, in the region, and in the U.S. The final column “weights” manufacturing job losses by the respective size of the manufacturing sector, thereby illustrating the extent to which manufacturing decline impacted the overall employment base in the state or region.
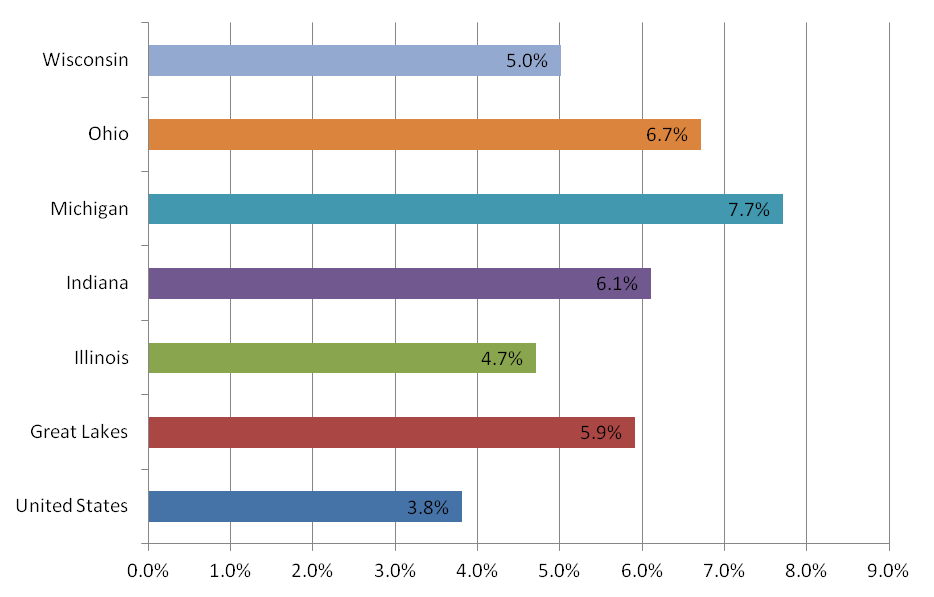
The chart illustrates this impact. For example, nationally, we see that manufacturing job declines from the peak year (1998) through year 2010 wiped out the equivalent of 3.8% of the total job base of 1998. However, for the Great Lakes Region, the impact was much more severe, at 5.9%—and 7.7% for the hardest hit state, Michigan.
Table 1
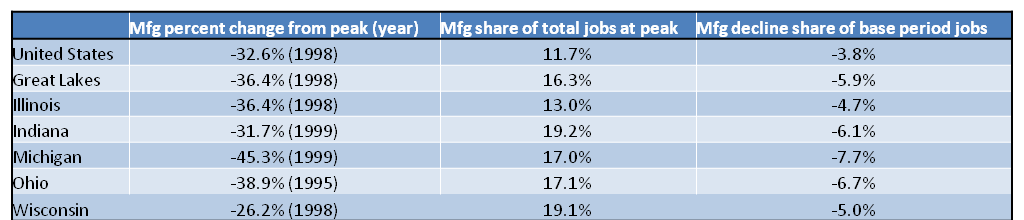
Chart 3. Manufacturing decline as share of base period total employment
Comparing these more recent declines with those of 1979–83, we see that the pace of manufacturing job declines in the Great Lakes Region was much steeper than that of the nation during 1979–83. At that time, some other regions were experiencing job gains in both defense-related and aerospace industries and in microelectronics and computing equipment.
In the more recent period since 1998, manufacturing declines have been roughly proportionate in both the Great Lakes Region and in the remainder of the U.S., though still somewhat steeper in the region. During the recovery years in the middle of the last decade, manufacturing jobs continued to decline in our region even while flattening out in the remainder of the U.S.
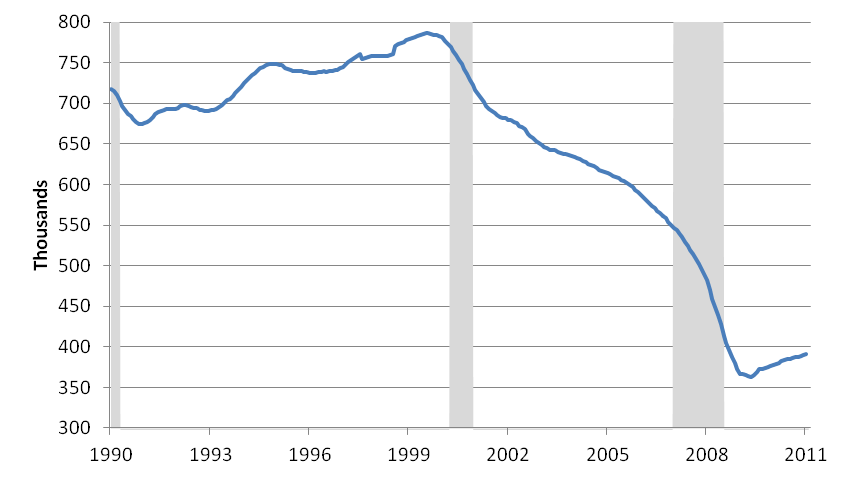
The Great Lakes’ continuous decline in manufacturing owes much to the performance of its transportation equipment industries—especially automotive, trucks, and trailers. As the next chart illustrates, employment in the transportation equipment industry has fallen by over one-half from its peak in 1999.2 The net loss of these 400,000 jobs comprises over one-quarter of the region’s manufacturing job losses over the period. Moreover, many more job losses are indirectly attributable to production declines in the transportation equipment sector due to the industry’s intensive sourcing of business services, parts, fasteners, materials, and equipment from within the region.
Both production and employment in the transportation equipment sector bottomed out in 2009, but job gains since then have been very small in relation to the previous net losses. From the trough of the 2008–09 recession, transportation equipment has regained 28,600 jobs in the region, roughly 6.8% of prior net job losses as counted from the peak of the 1990s. Across all manufacturing sectors, the region has regained 135,200 jobs, roughly 8.5% of its previous job losses.
Chart 4. Great Lakes region transportation equipment manufacturing employment (12-month moving average)
In sum, the Great Lakes Region’s net job losses in manufacturing since the late 1990s have been severe. Relative to the structural changes that took place in the early 1980s, the more recent experience has been worse along every dimension save one—that is, recent manufacturing job declines have been drawn out over a ten-year period rather than the four-year descent of 1979–83. Manufacturing jobs have been growing over the course of the cyclical recovery that began in mid-2009, but these gains are very modest in the context of the entire period since 1969.
Footnotes
1 The BEA estimates include full and part-time workers, both those on payrolls and those who are self-employed. Contract workers would be excluded from the manufacturing industry, as they are accounted for in other sources of jobs data.
2 These data are payroll employment data, provided by the Bureau of Labor Statistics, U.S. Department of Labor.


