Economic Development in Chicago
This last blog in our series on the largest cities in the Chicago Fed’s District focuses on Chicago. (For a complete profile of all five cities, see Industrial clusters and economic development in the Seventh District’s largest cities.) Chicago holds a different place in the urban hierarchy than the other large cities in the District. More than just a large midwestern city, Chicago has obtained global city status and competes with other global cities in the U.S. (New York, Los Angeles, Washington and San Francisco) and abroad (London, Paris, Tokyo, and Hong Kong to name a few) for investment and reputation. Chicago is the home to world-class museums, cultural institutions and universities, as well as corporate headquarters and one of the busiest airports in the world. Importantly, one of Chicago’s primary advantages is its ability to attract human capital. Recent work by Bill Testa and Bill Sander highlighted the ability of Chicago’s downtown core to attract educated young adults.1 As this survey of city economic strategies has shown, human capital accumulation is a primary strategy for growth, and Chicago appears to have advantages in attracting and retaining skilled workers.
Chicago’s economy underwent a profound shift in the 1990s. As manufacturing jobs began to decline, the Chicago-area economy shifted toward business and professional services. These sectors provided the city with high-paying jobs and helped lift its economy relative to other manufacturing-dependent Midwest cities. As we can see in the data (table 1), Chicago has a highly diversified economy, which closely mirrors the structure of the U.S. economy. Chicago does have challenges. The fiscal condition of the city (and the state) is precarious, highlighted by large underfunded public pension obligations. Also, the city has struggled to emerge from the Great Recession, as highlighted by slow job growth (figure 1).
Chicago’s Industry Structure
As figure 1 shows, Chicago has eight industries with higher employment and location quotients (LQs than the U.S. average.)2 They are: manufacturing (LQ 1.04), wholesale trade (1.14), professional and technical services (1.13), management of companies (1.28), administrative and waste services (1.20), educational services (1.44), transportation and warehousing (1.24), and finance and insuQrance (1.16). This provides a highly diverse mix of high-end professional services (accounting, consulting, and advertising) with retained strength in manufacturing and logistics and warehousing.
Table 1. Chicago MSA employment shares and location quotients, 2012
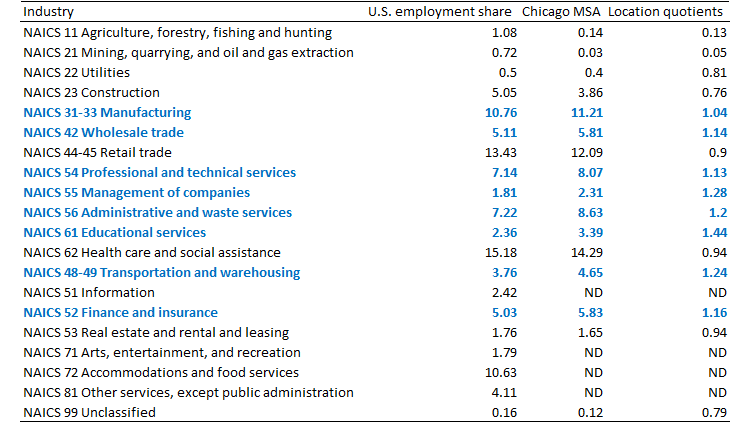
Source: U.S. Bureau of Labor Statistics
Economic Development Strategy in Chicago
In 2012, Chicago unveiled a new economic development strategy that was based on a study conducted by World Business Chicago (WBC), which is the city’s public–private economic development agency. The study was based on a series of reports by subcommittees that focused on the recent strengths and weaknesses of Chicago’s economy. In the end, the report identified ten strategies, which included a focus on specific industry clusters—advanced manufacturing, professional services, and headquarters operations—as well as infrastructure improvements. The strategies are as follows:
- Support advanced manufacturing—high-value-added manufacturing.
- Increase the region’s attractiveness for business services and headquarters.
- Enhance the city’s competitive position as a transportation and logistics hub.
- Make Chicago a premier destination for tourism and entertainment.
- Make the city a leading exporter—support export activities, particularly for small and mid-sized businesses.
- Develop a work force in a demand-driven and targeted manner.
- Support entrepreneurship and innovation in both mature and emerging sectors (with an emphasis on product commercialization).
- Develop next-generation infrastructure and new models of public–private funding.
- Support neighborhood vitality that supports regional growth (small and medium-sized enterprises).
- Develop a good business climate. This includes streamlining regulation and providing businesses with a supportive infrastructure.
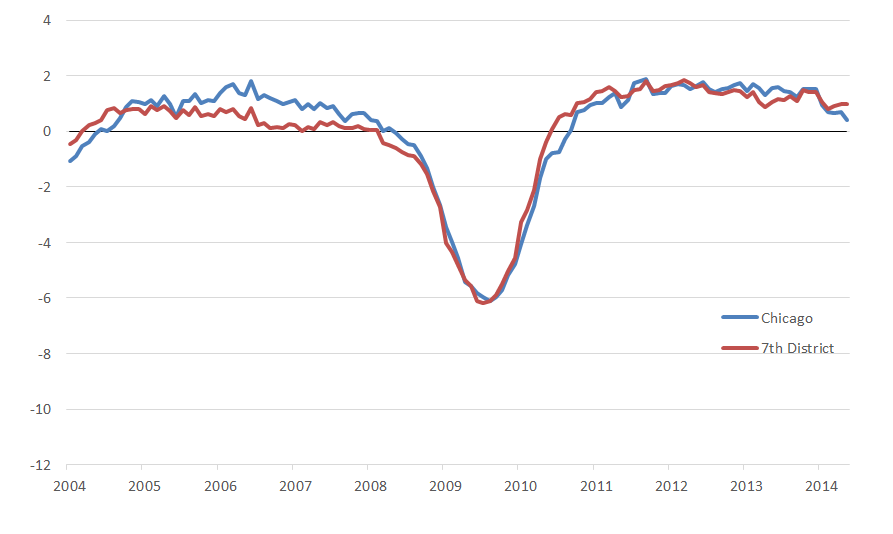
To implement the plan, WBC has created a series of task forces to develop specific metrics to measure progress toward each goal. As figure 2 shows, part of the desire to articulate a new development plan for the city came from the sluggish job growth that occurred coming out of the Great Recession. While Chicago had grown faster than the District as a whole leading up to the recession, its performance from 2010 to 2012 was lackluster and is still somewhat sluggish.
Figure 1. Employment growth: Chicago and Seventh District (percent change year-over-year)
Footnotes
1 William A. Testa and William Sander, “Household Location and Economic Development in the Chicago Metropolitan Area,” mimeo.
2 The U.S. Bureau of Labor Statistics (BLS) defines LQs as “ratios that allow an area’s distribution of employment by industry to be compared to a reference or base area’s distribution”.


