Introducing the Chicago Fed Survey of Business Conditions (CFSBC)
On January 13, 2016, the Chicago Fed published the inaugural release of its Survey of Business Conditions (CFSBC). This new data product offers a series of diffusion indexes that track a broad set of topics related to the business conditions of firms in the Seventh District: overall activity (or product/service demand), outlook for the U.S. economy, current and planned hiring, current and planned capital spending, and wage and nonwage cost pressures.
The indexes are derived from questions included in a survey of Seventh District business leaders (started in March 2013) that was originally designed to support the Chicago Fed’s contribution to the Beige Book. Table 1 shows that CFSBC respondents come from a variety of industries, with the largest representation coming from the nonfinancial services sector and the manufacturing sector. The survey has averaged about 75 respondents over its history, though more recent surveys have averaged about 100 respondents.
Table 1. CFSBC respondent composition

While the Beige Book is explicitly an anecdotal (or qualitative) account of current economic conditions, we decided to also include quantitative questions in our survey so that we can calculate indexes. These questions follow a seven-point scale. For example, here is our question about product/service demand:1
In the past four to six weeks, demand for my firm’s product or service has
- increased substantially.
- increased moderately.
- increased slightly.
- not changed.
- decreased slightly.
- decreased moderately.
- decreased substantially.
The diffusion indexes we calculate from questions such as the one above are designed to be leading indicators, capturing changes in the prevailing direction of economic activity. The formula for the indexes is:
![]()
In many ways, this is a very traditional formula for a diffusion index, but we make an important adjustment that we would argue improves it: we measure individuals’ responses relative to their respective average responses. To calculate a respondent’s average response to a question, we assign numerical values ranging from +3 to –3 along the seven-point scale, and take the average across all responses. We then count a response as positive if it is above a respondent’s average response and negative if it is below a respondent’s average response. For example, if a respondent’s average response is +1.5, substantial and moderate increases are counted as positive responses and all other answers are counted as negative responses. Given our formula, the index ranges from +100 to –100 and will be +100 if every respondent in a given survey has an above-average response to a question and –100 if every respondent has a below-average response.
Calculating the indexes using a survey participant’s average response as a baseline—also known as detrending—allows us to correct for two types of potential biases. First, individuals may interpret phrases such as “substantially increased” differently, so that our numerical scores have different meanings for different people. Second, the industries and firms represented in our data may have different growth trends than the overall economy, which could bias the indexes because we do not have a random sample of respondents. For example, because manufacturers represent a sizable share of our respondents, our index could overrepresent trends in the manufacturing sector. The share of manufacturing output and employment in the U.S. economy has been declining for decades, so that in general, trends in the manufacturing sector are becoming less and less representative of trends in the overall economy.
Respondents’ respective average answers to a question can be interpreted as representing their historical trends or long-run averages. Thus, when we summarize respondents’ detrended responses by calculating diffusion indexes, we interpret zero index values to indicate that, on balance, the activity indicators are growing at their trend rates (or that outlooks are neutral). Likewise, positive index values indicate above-average growth (or optimistic outlooks) on balance, and negative values indicate below-average growth (or pessimistic outlooks) on balance.
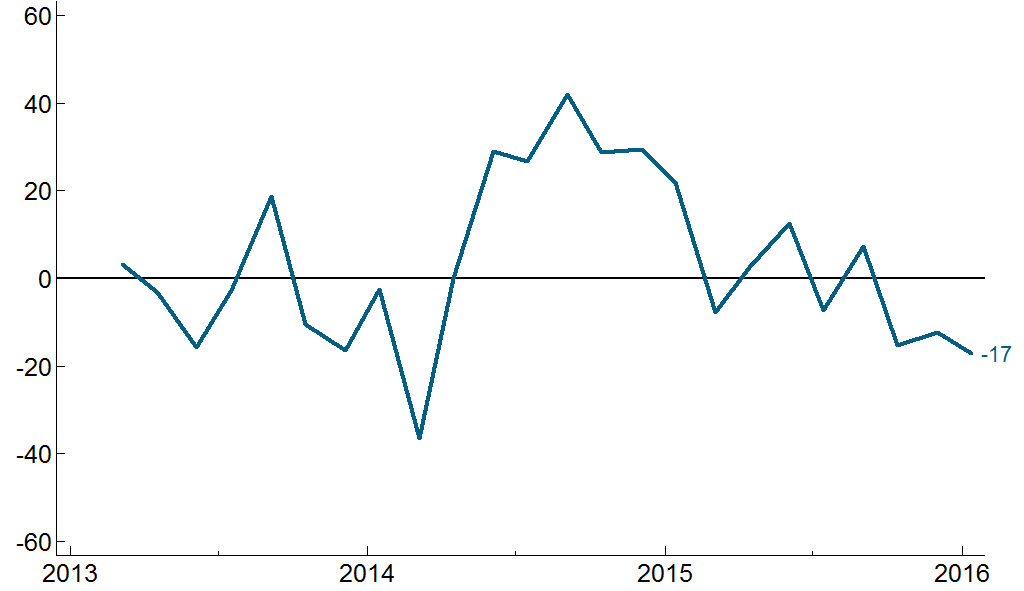
For a concrete example of how we interpret the diffusion indexes, consider figure 1, which shows the CFSBC Activity Index (which is based on the question about product/service demand). It shows that 2013 was a bumpy year, with growth in activity about at trend on average. According to the index, 2014 started slowly (as you may recall, there was a lot of bad weather in the winter of 2014–15), but growth was consistently above trend for the rest of the year. Activity then slowed throughout 2015 to the point that growth was below trend by year’s end.
Figure 1. CFSBC activity index
We’ve found that the CFSBC Activity Index seems to do a good job of tracking U.S. real gross domestic product (GDP) growth, so that the index may be a good early indicator of the current state of the economy. Figure 2 shows this relationship, where I’ve aligned a zero value of the CFSBC Activity Index with the average of real GDP growth over the comparison date range. In general, the CFSBC Activity Index is positive when real GDP growth is above average and negative when real GDP growth is below average.
Figure 2. CFSBC activity index and U.S. real GDP growth
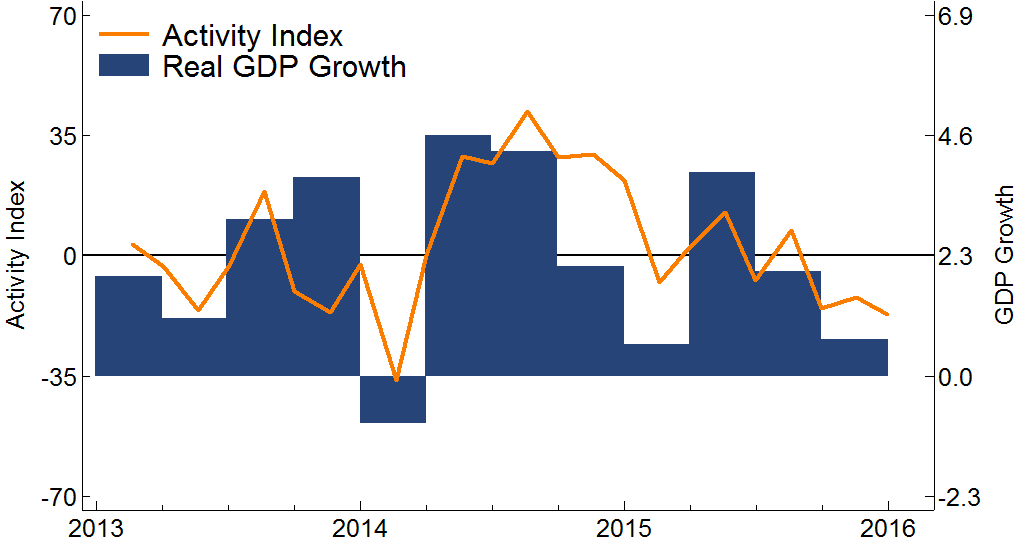
Source: GDP data from the U.S. Bureau of Economic Analysis from Haver Analytics.
Because we use the results of the CFSBC to write our contribution to the Beige Book report, we will be releasing the CFSBC index data in conjunction with the Beige Book schedule. The Beige Book is released at 1:00 p.m. ET on the Wednesday two weeks before FOMC meetings, which take place eight times per year. The CFSBC index data are released two hours later.
For a more detailed description of the diffusion indexes and their properties, see the Chicago Fed Economic Perspectives article titled “The Chicago Fed Survey of Business Conditions: Quantifying the Seventh District’s Beige Book Report.”
Footnotes
1 The full set of questions used for the CFSBC indexes is available here.


