What is Illinois’s Tax Capacity?
A recent study ranked Illinois 47th among U.S. states and Puerto Rico for its fiscal health.1 Particularly concerning was the report’s finding that the combination of total debt, unfunded pension liabilities, and underfunded other post-employment benefits amounts to 61% of total state personal income. In contrast, the same figure for other Seventh District states ranges from a high of 38% in Michigan to a low of 16% in Indiana. Given the magnitude of Illinois’s debt, any plan aimed at improving the state’s fiscal solvency will likely require both expenditure cuts and tax and revenue increases.
So what is the taxable capacity of Illinois? Two broad issues arise. First is the issue of fairness: Would further taxation violate society’s notions of imposing undue burdens on those who can least afford it? Second is the issue of impairing economic activity: Would further taxation discourage economic activity or otherwise drive out taxable wealth to an unacceptable degree?
In this blog post, we describe several methods for identifying a community’s tax capacity. In general, researchers have attempted to measure and compare capacities for specific places by calculating hypotheticals that rely on norms or averages across all places. For example, how much revenue might we expect to raise in a community if we imposed average tax rates there? And how much should a community be spending on public services, given its population characteristics and its need for services? And importantly, how do the two estimates differ? Are there obvious gaps between resources and needs?
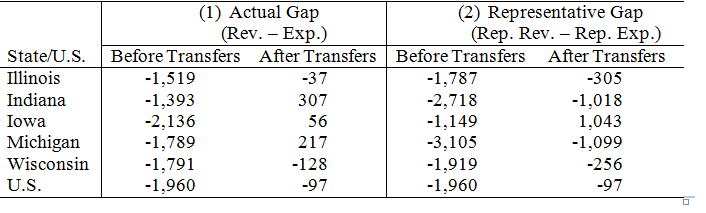
Gordon, Auxier, and Iselin (2016)2 used such a representative revenue and expenditure approach to estimate this hypothetical gap in funds a state has available for government operations. The study documents that there is enormous variation in the amount of revenue states collect and what they spend on public goods and services. To drill down to tax capacity, the study measures what each state would collect in revenues and spend on government services if it followed national averages, adjusted for state-specific economic and demographic factors. Table 1, section (1) shows the actual gap, or the difference between actual revenues and expenditures, in FY2012, assuming that states rely only on revenues that they raise themselves through taxes and fees. The gaps are sizable, but adding in federal transfers largely erases the gaps. Turning to the hypotheticals as they relate to tax capacity, Table 1, section (2) compares representative revenues, or revenues that a state would raise if it had an average tax structure, to representative expenditures, or expenditures if the state had an average spending per capita. In contrast to the actual gap, the representative gap remains even after the addition of federal transfers in all of the Seventh District states other than Iowa. In this hypothetical case, if Seventh District states (other than Iowa) adopted a nationally representative tax structure, they would not have sufficient resources even after federal transfers to provide a representative level of public expenditures.
1. Actual and representative fiscal gaps per capita (FY2012)
Haughwout et al. (2003)3 developed a more refined analysis, termed the “revenue-hill” method, that estimates the deterioration in tax capacity that takes place as higher tax rates discourage taxable activity. The revenue hill builds a hypothetical schedule of tax rates and revenues that demonstrates how fully a city is utilizing its tax base. The goal is to build a “Laffer Curve” that allows policymakers to estimate the economic effects of the next tax dollar (e.g., effect on employment). The closer the measure is to the top of the hill, the closer the city is to exhausting its tax capacity. Once a city is over the top of the hill, increases in tax rates will become so unproductive that revenues actually decline. These measures can be constructed for each tax base a city might use. Therefore, while a city may have reached capacity for one tax base (e.g., sales tax), it may still have capacity in another (e.g., property tax). Haughwout et al. (2003) examined four cities—New York, Philadelphia, Houston, and Minneapolis—and found that only Minneapolis was “comfortably” below its revenue hill, and thus had additional tax capacity. In the case of Minneapolis, additional taxes could provide net benefits to property owners. New York and Houston were at the top of their revenue hills, implying that additional taxes would have a negative impact on employment.
Finally, Bo Zhao and Jennifer Weiner of the Boston Fed suggested the “municipal-gap” method for measuring tax capacities across municipalities in Connecticut, by recognizing that taxable capacity can only be measured in the context of a government’s particular needs and resource costs in providing adequate services.4 For example, limited tax capacity can exist when a community faces higher costs or fewer resources for providing public services (or both). In both cases, it can be driven by economic, topographic, and demographic factors specific to the community (e.g., a relatively high rate of poverty or significant risk of extreme weather).
First, one identifies revenue capacity. Revenue capacity is defined as the ability of municipalities to raise revenue from all of the sources they are authorized to tax, even if they choose not to tax a particular base. Capacity is calculated using the “representative tax system” approach, where all communities use a standard uniform tax rate against the tax base. The rate is determined by ensuring that the statewide rate raises enough revenue to cover existing expenditures. Second, one identifies expected expenditures–the average level of spending based on the municipality’s underlying socioeconomic and physical characteristics. This number is is calculated using regression analysis to predict a municipality’s expenditures based on actual values of the underlying characteristics. One purpose of deriving expected expenditures is to remove the variation in expenditures due to the choices of local officials who may favor particular government programs.
The study focused on the costs of providing largely non-educational local services, primarily public safety. It found that large fiscal disparities in Connecticut were primarily driven by their differences in revenue raising capacity. The uneven distribution of the property tax base coupled with the relative dependence on property tax revenues in the state meant that resource-rich municipalities had, on average, per capita revenue capacity eight times that of resource-poor towns. The cost of providing municipal services was less dispersed, with the highest-cost municipalities spending 1.3 times that of the lowest-cost towns. Importantly, the study also found that non-school revenue grants from the state had limited effect in reducing fiscal disparities.
What can tax capacity studies tell us about Illinois’s fiscal problems?
Illinois has a particularly difficult choice when it comes to future tax adjustments. First, the debt overhang at the state level is so large that any future tax increases will necessarily be directed to paying down debt rather than purchasing new services. Incremental tax increases will pay for services already consumed and, as such, it is difficult to see how future taxes will provide governments with resources to support programs that enhance growth. Second, capacity studies, such as Gordon et al. (2016), suggest that Illinois has already reached its capacity limits. While it would be a stretch to adapt this to the revenue-hill concept of actual declines in revenues in response to tax hikes, it does imply that Illinois has little room to increase taxes without reducing economic activity in ways that would be damaging. The depth of the problem increases when recognizing that many Illinois municipalities also face revenue gaps that would make the compound effects of a state tax increase coupled with a local increase that much worse. As these studies show, there tends to be considerable variation in both the level of expenditures and available revenues across any state when it comes to financing government services. The question then becomes what is the geography of tax capacity in Illinois?
In a second blog, we will apply local revenue capacity and service cost to Illinois municipalities. Stay tuned to see what fiscal disparities might exist for municipalities in Cook County.
Footnotes
1 Norcross, E., & Gonzalez, O. (2016). Ranking the States By Fiscal Condition.
2 Gordon, T., Auxier, R., & Iselin, J. (2016). Assessing Fiscal Capacities of States.
3 Haughwout, A., Inman, R., Craig, S., & Luce, T. (2003). Local Revenue Hills: Evidence from Four U.S. Cities.
4 Zhao, B., & Weiner, J. (2015). Measuring Municipal Fiscal Disparities in Connecticut.


