Comparing the Finances of Illinois and Other States
Getting its fiscal house in order has been a perennial challenge for Illinois. Illinois is consistently at the bottom of the list of states when rated by fiscal health. Moreover, Illinois currently (as of June 2019) has the worst state bond rating in the country. Given these low rankings, Illinois clearly has a problem when it comes to fiscal health not only in absolute terms, but also relative to other states. Numerous commentators have both discussed the nature of this problem and put forth various solutions.
In this blog entry, I am neither diagnosing the root problem behind Illinois’s fiscal woes nor proposing any particular cures. Rather, using a range of fiscal measures, I want to document how Illinois has stacked up against its peers since 1960.
Each figure in this blog entry is created in an analogous way and compares the value of a fiscal measure for Illinois with values at the 20th, 50th, and 80th percentiles for all states in each year, using the available data from 1960 through the present.1 Dollar measures are calculated per capita and in real (2012) dollars. On most measures, Illinois is not an outlier, but on some, it is. Three particular patterns for Illinois (versus most other states) stand out from the graphs: a relatively larger role of local governments in total state and local finances; higher retiree compensation compared with current worker compensation among its government employees; and lower levels of federal government transfers received by the state.
Economic activity
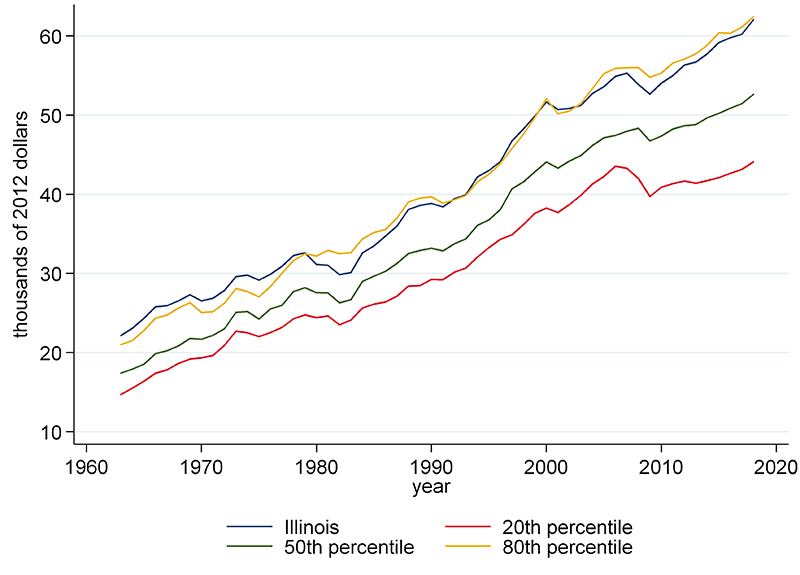
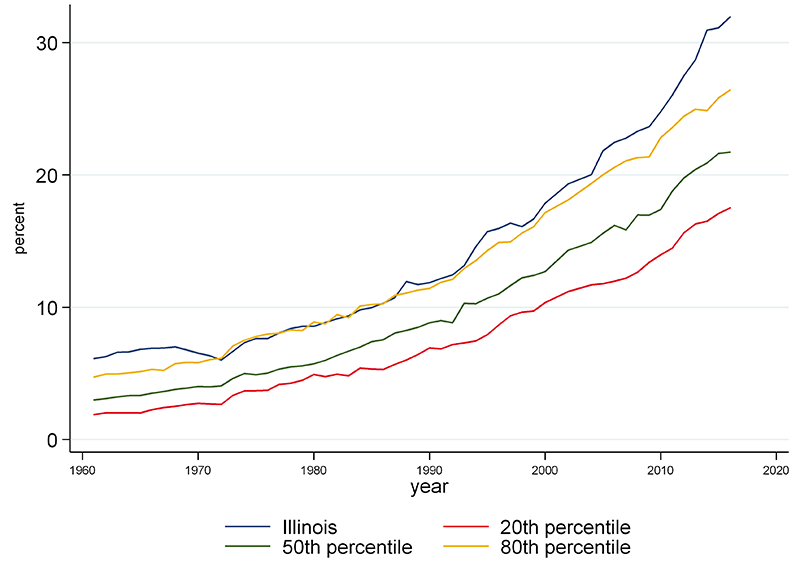
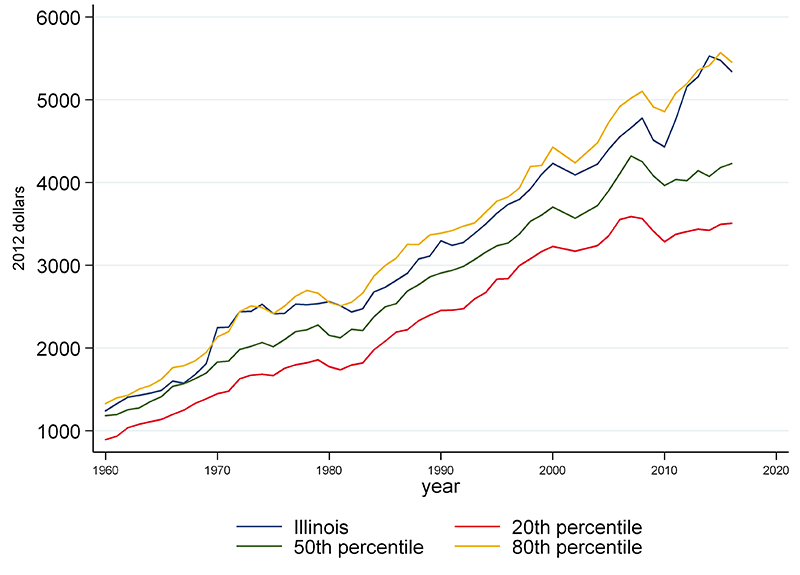
I begin with the broadest indicator of state economic activity—gross state product (GSP) per capita—to provide a measure of the overall economic output of the state. This measure, available since 1963, is shown in figure 1.
Illinois has hovered around the 80th percentile throughout the long time series for GSP per capita. Other data bear out that Illinois is not and has not been poor or unproductive during this time period. Over the sample period, Illinois’s poverty rates have been below the national average, and the state’s personal income is relatively high.
1. Gross state product
Government spending and revenues
I next turn to measures of government finances from the U.S. Census Bureau. The baseline government finance data that I present only show state government finances and as such do not include the expenditures and revenues of local governments. Among the 50 states, the roles of state versus local governments can differ dramatically. Where appropriate I show combined state and local financial data.
Expenditures
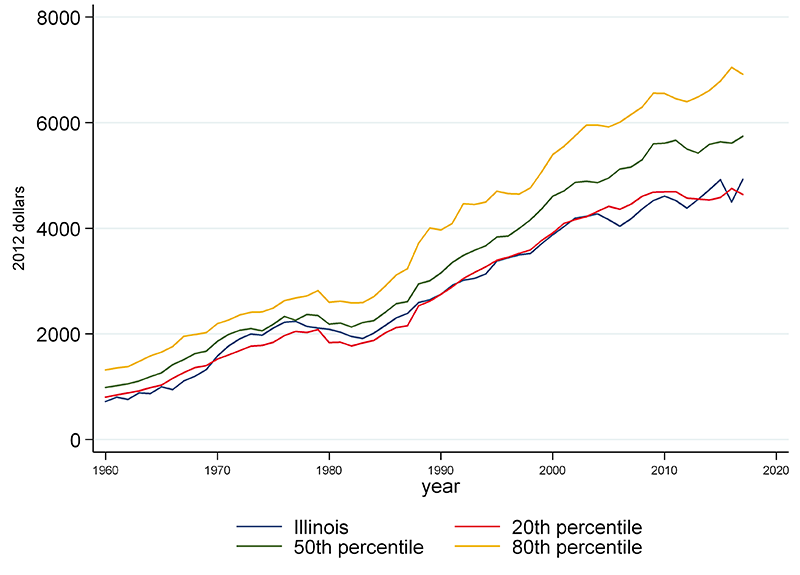
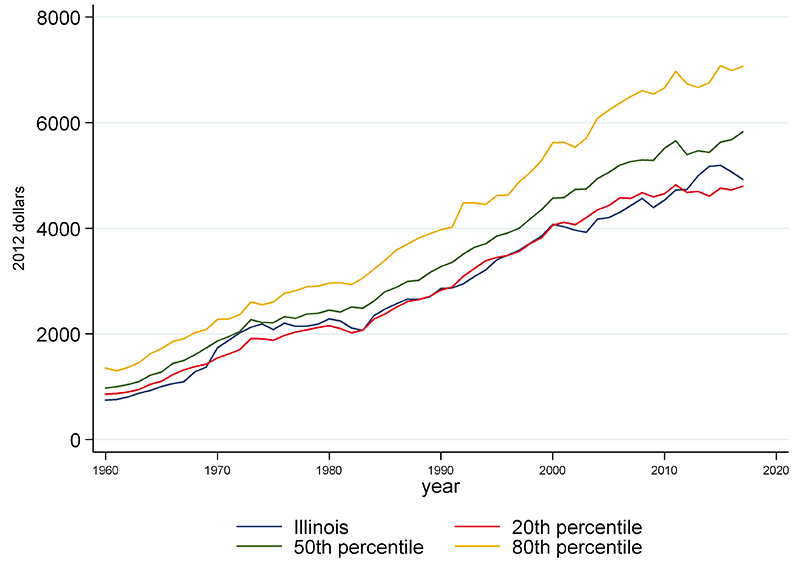
Figure 2 presents data on total expenditures per capita—which exclude insurance benefits and repayments. This is a broad measure of expenditures and includes operations, interest on the debt, government assistance, capital spending, and transfers to other governments. It excludes insurance benefits and repayments—which are made up of public employee retirement benefits and social insurance trust spending, including unemployment insurance and workers’ compensation.2
Illinois’s expenditures per capita have been consistently below the median since the 1960s. And they have hovered around the 20th percentile since the mid-1980s.
2. State non-insurance trust expenditures per capita
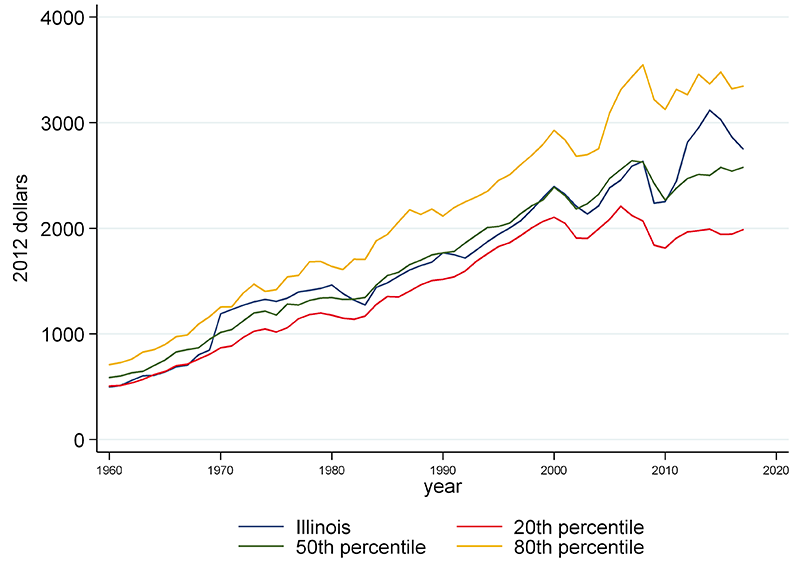
This low-expenditure story changes modestly if we include local governments’ spending (figure 3). State and local governments’ expenditures per capita in Illinois have consistently been at or near the median among the states. The difference between the state number (below the median) and the combined state and local number (at the median) implies that local expenditures make up a high share of total state and local non-insurance trust expenditures in Illinois. In fact, since 1960 Illinois has been close to or above the 80th percentile among all states in terms of local share of state and local non-insurance trust expenditures per capita. Much of this can be explained by the fact that K–12 education in Illinois is paid for mostly by localities. In other words, the state government of Illinois provides its local governments with a fairly small share of the total amount spent on the K–12 education system.
3. State and local non-insurance trust expenditures per capita
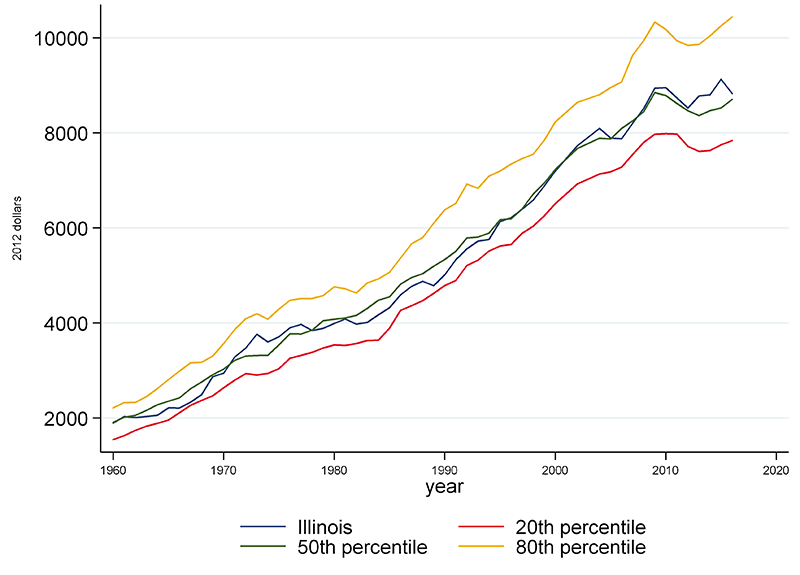
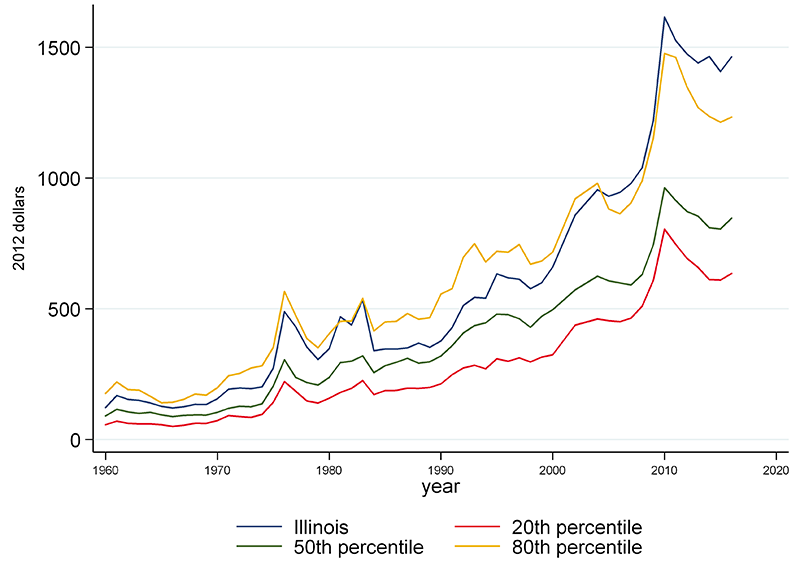
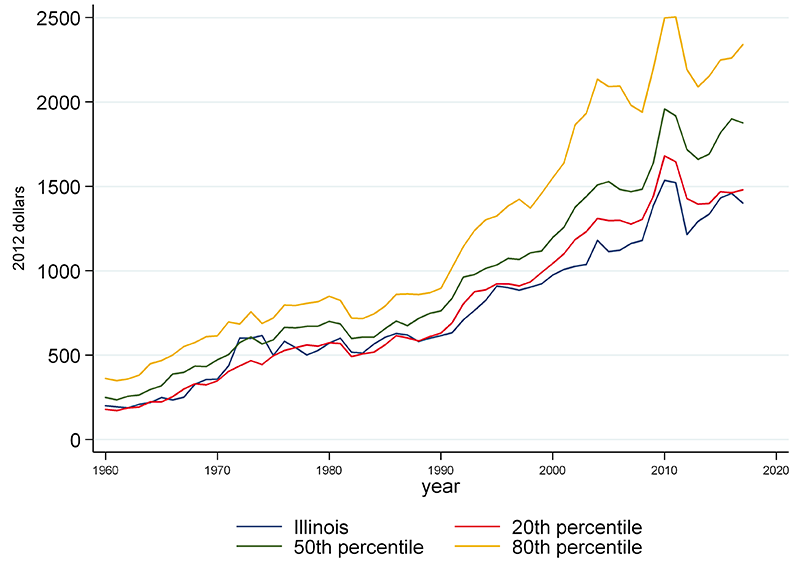
Figure 4 shows state and local insurance trust spending per capita (primarily for employee retirement funds, workers’ compensation, and unemployment insurance). For this figure, I show combined state and local spending because state-only measures can be highly misleading, given the level of government that’s funding local government employee pensions differs by state. Insurance trust spending per capita in Illinois has consistently been above the median, and in recent years, it’s been above the 80th percentile.
4. State and local insurance trust expenditures per capita
These trends hint at one potential source of the Illinois pension crisis. In particular, in Illinois there appears to be trade-off between current employee compensation (included in total expenditures, which again exclude benefits and repayments) and future compensation (included in insurance trust expenditures). Figure 5 shows state and local spending on retirees (via benefits payments and withdrawals) as a share of total current employee (in the form of wages and salaries) and retiree compensation. Retiree compensation as a share of total compensation for Illinois is above the 80th percentile among all states in most years. I want to underscore that this has been a long-running pattern: Illinois has been among the highest states on this measure since 1961.
5. State and local retired employee compensation as a percentage of total compensation
Revenues
I next turn to the revenues side of the ledger. As with total expenditures, I exclude revenues for employee retirement and social insurance trusts (figure 6). Figure 6 shows total state revenues per capita—which include tax revenues, revenues from current charges (such as parking fees and tolls), and revenues received from other levels of government. According to this graph, Illinois is not a high-revenue state.
6. State non-insurance trust revenues per capita
The figure masks an important difference between the two major sources of revenues for states—taxes and federal intergovernmental revenues. With respect to taxes (figure 7), Illinois has historically been close to the median, although its taxes have been above the median over the period 2011–17. For federal intergovernmental revenues (figure 8)—which largely come from federal public welfare, education, and highway programs—on a per capita basis, Illinois has been below the 20th percentile every year since 1988. This is largely a result of Illinois being high income per capita and populous—which lead to lower federal transfers per capita according to various federal funding formulas.
7. State tax revenues per capita
8. Federal intergovernmental revenues received by the state, on a per capita basis
The tax picture looks different when local taxes are included (figure 9). Consistent with Illinois’s high local share of total state and local expenditures, the state also has a high local share of total state and local taxes—in particular, Illinois has relatively high local property taxes.
9. State and local tax revenues per capita
Conclusion
A few patterns become apparent while reviewing the finances of Illinois and other states over roughly the past 60 years. First, relative to most other states, Illinois has a higher proportion of its state and local expenditures occurring at the local level rather than at the state level. This pattern also holds true for tax revenues—compared to most other states, Illinois has a higher proportion of its state and local taxes collected by localities. Second, unlike in most other states, compensation to government workers in Illinois has been tilted toward retired employees relative to current employees. Third, Illinois receives substantially fewer dollars per capita from federal government transfers than most other states. Most of these are longstanding patterns. With a few exceptions, Illinois has occupied a similar place in the distribution since 1960.
Notes
1 Because of the even number of states (50), there are no individual states at these exact percentiles. The 20th percentile is the average of the states ranked ten and 11; the 50th percentile is the average of the states ranked 25 and 26; and the 80th percentile is the average of the states ranked 40 and 41.
2 Note that employee retirement and other post-employment benefits are recorded when they are paid out, not when they are accrued.


