What Does Detroit’s 2019 Per Capita Income Growth Tell Us About the City’s Pre-Pandemic Renaissance?
Leading up to the Covid-19 pandemic and the related economic slowdown, many viewed Detroit as a city undergoing a renaissance. In 2018, just five years after Detroit’s historic bankruptcy filing, the city had reversed course, and the future looked promising.1 The city government was once again able to balance its budget; received multiple credit upgrades by the ratings agencies; improved many of its basic services to residents; lured billions of dollars of investment; and achieved a sense of fiscal discipline.2 Economic activity noticeably improved as private investment in Downtown Detroit rose. Moreover, Midtown Detroit, just north of Downtown, saw dozens of new mixed-use developments. And the city’s former warehouse district on the east riverfront was drawing the attention of developers for high-end condos and apartments. Similarly, Corktown—Detroit’s oldest neighborhood—was attracting both residential and commercial investment after it’d already become one of the trendiest parts of the city. Finally, farther north of Downtown, the New Center area, anchored by Henry Ford Hospital, was seeing development activity trending upward, including a planned $50 million expansion of the Motown Museum. All these areas were tied together by a streetcar line called the QLine, which had debuted in 2017.3 This injection of capital and investment improved Detroit’s economy and the quality of life for many of its residents.
From 2018 to 2019, Detroit’s per capita income (PCI) grew from $18,761 to $21,044 in real (2019 inflation-adjusted) dollars, according to data from the U.S. Census Bureau’s American Community Survey (ACS). This 12.2% increase in the city of Detroit’s PCI was large relative to both the state of Michigan’s PCI growth (2.5%) and the PCI growth rates of other similar U.S. cities. It was also much larger than what was predicted by the Chicago Fed’s measure of growth in Detroit’s economic activity, even when accounting for sampling error in the ACS. The goals of this blog post are to further explore the compositional changes that underlie this aggregate PCI number for Detroit and to figure out what this improvement in income tells us about the city’s pre-pandemic renaissance.
Real per capita income growth in 2019
According to the ACS, the city of Detroit’s real per capita income grew by 12.2% in 2019 from its 2018 level. In figure 1, for 2019 we plot the real PCI growth rates of the city of Detroit, other similar U.S. cities, and other cities within Michigan against the real PCI growth rates of the states in which these cities are respectively located.4 Detroit’s 2019 real PCI growth was the highest among the cities in the graph and also high relative to that of Michigan. Many of the other cities that experienced rapid PCI growth that year—notably, Boston and Nashville—were in states where PCI growth was high as well.
Figure 1. Real per capita income growth for Detroit and other midsize cities versus their states, 2019
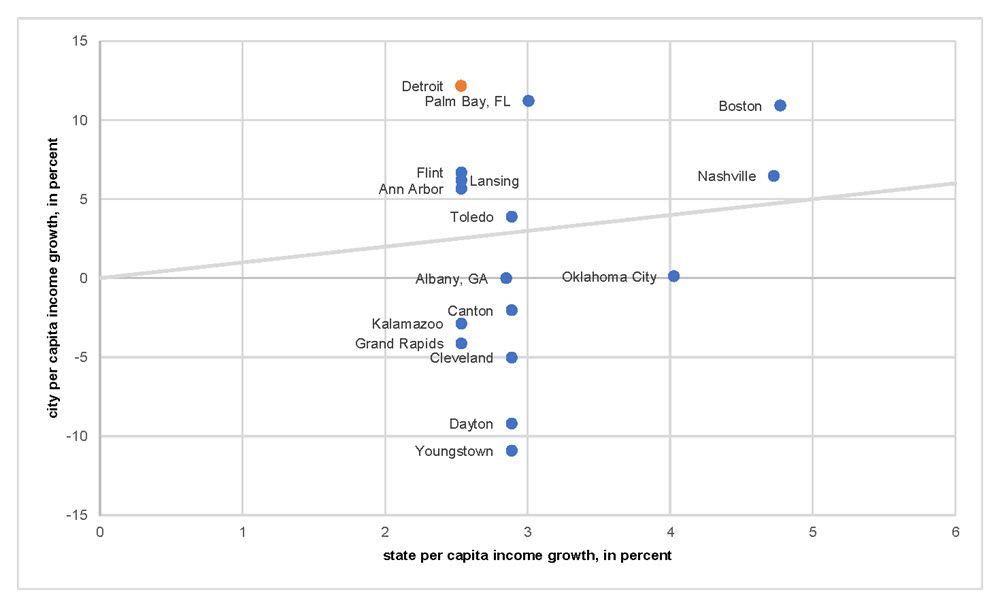
Source: Authors’ calculations based on data from the U.S. Census Bureau, American Community Survey 1-year estimates.
Detroit’s real PCI growth in 2019 was not part of a longstanding pattern. Between 2015 and 2018, average real PCI growth in Detroit had been more in line with that of Michigan and other peer cities (see figure 2).
Figure 2. Average real per capita income growth for Detroit and other midsize cities versus their states, 2015–18
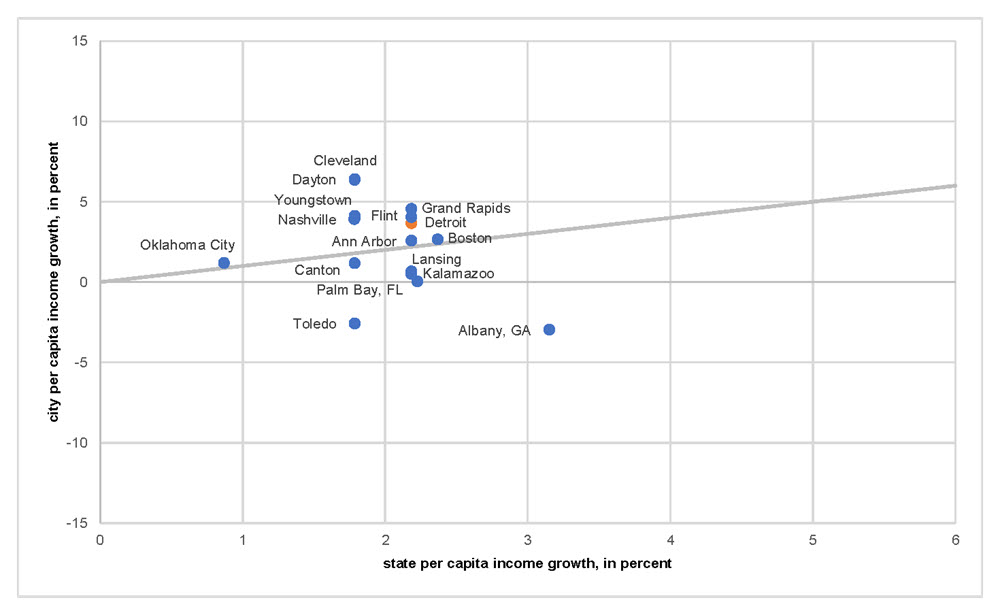
Source: Authors’ calculations based on data from the U.S. Census Bureau, American Community Survey 1-year estimates.
There are two notable features of these ACS data. First, this PCI growth was not predicted by our model of Detroit economic activity. The Chicago Fed’s Detroit Economic Activity Index (DEAI) uses a rich set of Detroit-specific data series to measure growth in the city of Detroit’s economic activity. The model also allows us to forecast inflation-adjusted per capita income for Detroit. Our model forecast usually performs quite well. For instance, for 2018, its prediction of the level of inflation-adjusted per capita income was off by about 1%. However, for 2019, the model predicted that inflation-adjusted per capita income would be $19,176, representing a growth rate of 2.2% relative to 2018 and about 10 percentage points below the actual growth rate shown in figure 1.
The difference between the DEAI model forecast and the actual per capita income data indicates that the high growth rate in inflation-adjusted per capita income for 2019 cannot be explained by the traditional relationships between the measures of economic activity in the model. These measures are the past values of inflation-adjusted per capita income growth; current labor market conditions (as measured by monthly employment growth, monthly changes in the unemployment rate, and the annual labor force participation rate); and other monthly, quarterly, and annual indicators of Detroit economic activity (the complete list of DEAI indicators is available online).
The second notable feature of these data is that the one-year growth estimates from the American Community Survey are subject to sampling error due to modest sample sizes. A 90% confidence interval of the real change in PCI in 2019 from 2018 is 5.4% to 19.0%. Given the sampling error, many researchers prefer to look at city-level data from the ACS at a longer (five-year) horizon. We chose to look at the data from the one-year horizon because this blog post was motivated by the high one-year growth rate and its deviation in the data from the DEAI’s one-year estimate. However, it is important to note that sampling error in these data is substantial.
Further analysis
To further explore Detroit’s high 2019 per capita income growth rate, we dig in to the data to ask where the increases occurred. The Census Bureau provides PCI breakdowns based on race and Hispanic origin. The Census Bureau also shows breakdowns in family income based on the number of workers and breakdowns in household income based on income sources.5 We investigate these breakdowns to highlight the sources of income growth.
Table 1 shows the breakdowns in 2018–19 Detroit per capita income data based on race and ethnicity. In addition to information on income by racial or ethnic group, the Census Bureau provides information on the number of people estimated to be in each group. In the final two columns, the table shows the growth rates in the population numbers and in the income measures from 2018 to 2019. These changes are only shown for those groups where the sampled population is sufficiently large to yield reasonably accurate estimates.6 Based on these breakdowns, we see that the Black population was stable from 2018 to 2019, whereas the White population and non-Hispanic White population fell. Per capita income grew solidly within all three of these population groups. Population numbers for other demographic groups are too small for reliable estimates. One potential explanation for Detroit’s PCI growth could have been that its economic renaissance had led to an increase in the share of the population that was White—and White people within Detroit tend to have higher incomes. But this is not borne out in the data. While the White population in the city does have higher-than-average income, the White population share decreased and the majority Black population experienced PCI growth in line with the city-wide level. There could have been changes within certain demographic groups—for instance, if higher-skilled or higher-educated individuals were moving into the city. But this is not observable in these tabulations.
Table 1. Real per capita income in Detroit, by race and Hispanic or Latinx origin, 2018–19
| Number of people in 2018 | Number of people in 2019 | Mean income in 2018 (dollars) | Mean income in 2019 (dollars) | % change of number | % change of mean | |
|---|---|---|---|---|---|---|
| Total population | 672,681 | 670,052 | 18,761 | 21,044 | –0.4 | 12.2 |
| By race | ||||||
| White | 103,779 | 98,275 | 23,319 | 28,298 | –5.3 | 21.4 |
| Black or African American | 522,070 | 521,857 | 17,884 | 20,150 | 0.0 | 12.7 |
| American Indian and Alaska Native | 1,770 | 4,427 | 20,383 | 12,274 | ||
| Asian | 10,597 | 11,705 | 32,997 | 22,677 | ||
| Native Hawaiian and other Pacific Islander | 184 | 25 | NA | NA | ||
| Some other race | 20,831 | 22,061 | 12,796 | 12,048 | ||
| Two or more races | 13,450 | 11,702 | 15,355 | 18,469 | ||
| By ethnicity | ||||||
| Hispanic or Latinx origin (of any race) | 52,718 | 55,289 | 12,637 | 15,253 | ||
| White alone, not Hispanic or Latinx | 72,982 | 70,901 | 28,007 | 31,975 | –2.9 | 14.2 |
Source: Authors’ calculations based on data from the U.S. Census Bureau, American Community Survey 1-year estimates.
Table 2 shows other income-related tabulations for Detroit in 2018–19 based on the number of workers in families. Across all families, family income grew by 9.8% in 2019, which is similar to the percentage growth in per capita income that year. Similar to table 1, the final two columns in table 2 show the growth in the number of families in each category and the growth in income within each category where sample sizes are sufficient in 2018 and 2019. There are two interesting things to note here. First, there were some changes in the distribution of families across categories—the number with no workers fell by 13% and the number with one worker and two workers increased by 6% and 3%, respectively. Both of these family categories with at least one worker have higher average incomes than the family category with no workers in 2019. Second, there were increases in income within all categories. These data and tabulations point to increasing employment levels within Detroit.
Table 2. Family income in Detroit, by number of workers in family, 2018–19
| Number of families in 2018 | Number of families in 2019 | Mean income in 2018 (dollars) | Mean income in 2019 (dollars) | % change of number | % change of mean | |
|---|---|---|---|---|---|---|
| All families | 137,717 | 138,731 | 50,546 | 55,497 | 0.7 | 9.8 |
| No workers | 32,794 | 28,566 | 28,448 | 29,112 | –12.9 | 2.3 |
| One worker | 58,183 | 61,859 | 39,888 | 43,425 | 6.3 | 8.9 |
| Two workers | 37,123 | 38,064 | 76,064 | 80,017 | 2.5 | 5.2 |
| Two workers, both spouses worked | 16,208 | 16,320 | 94,357 | 93,400 | ||
| Two workers, other | 20,915 | 21,744 | 61,888 | 69,973 | ||
| Three or more workers | 9,617 | 10,242 | 91,872 | 110,865 | ||
| Three or more workers, both spouses worked | 3,288 | 4,867 | 110,655 | 132,185 | ||
| Three or more workers, other | 6,329 | 5,375 | 82,114 | 91,560 |
Source: Authors’ calculations based on data from the U.S. Census Bureau, American Community Survey 1-year estimates.
In table 2, the decline in the number of families with no workers indicates that some of this may be due to an increasing labor force. The data on the employment status of the population in the ACS show an increase in both the size of the labor force (from 286,727 to 293,881) and the labor force participation rate (from 54.5% to 56.5%) in 2019 from the previous year, despite a declining city population (from 672,681 to 670,052). These annual labor force participation data were not available when the DEAI generated its forecast of 2019 real per capita income growth for Detroit.
Table 3 repeats similar tabulations for Detroit in 2018–19 based on household income sources. Note that one household can be in multiple income source categories. Average household income increased by 12.3% in 2019. There are a couple patterns to note here. First, there was a large increase in the number of households with earnings—in particular, with wages and salary income—and a very large increase in the number of households with retirement income.7 At the same time, there was an 11.5% decline in the number of households with income from public assistance or SNAP (Supplemental Nutrition Assistance Program). In addition, there was a modest decline in the number of households with Supplemental Security Income. There was also a modest increase in income among households with earnings. These findings that fewer households were receiving public assistance and more were earning wage and salary income are consistent with the finding in table 2 that the number of families with no workers fell.
Table 3. Household income in Detroit, by income source, 2018–19
| Number of households in 2018 | Number of households in 2019 | Mean income in 2018 (dollars) | Mean income in 2019 (dollars) | % change of number | % change of mean | |
| All households | 266,333 | 267,139 | 44,401 | 49,842 | 0.3 | 12.3 |
| With earnings | 170,444 | 182,024 | 49,608 | 52,039 | 6.8 | 4.9 |
| With wages or salary income | 166,316 | 176,820 | 49,070 | 51,772 | 6.3 | 5.5 |
| With self-employment income | 14,123 | 14,842 | 20,845 | 21,426 | ||
| With interest, dividends, or net rental income | 15,454 | 17,752 | 15,308 | 27,188 | ||
| With Social Security income | 90,101 | 89,138 | 16,066 | 16,265 | –1.1 | 1.2 |
| With Supplemental Security Income | 36,304 | 35,005 | 9,039 | 8,793 | –3.6 | –2.7 |
| With cash public assistance income or SNAP | 101,042 | 89,394 | NA | NA | –11.5 | |
| With cash public assistance | 10,719 | 8,803 | 2,354 | 1,512 | ||
| With retirement income | 51,047 | 62,266 | 21,115 | 21,655 | 22.0 | 2.6 |
| With other types of income | 24,893 | 23,032 | 10,226 | 10,441 |
Source: Authors’ calculations based on data from the U.S. Census Bureau, American Community Survey 1-year estimates.
Conclusion
Taken together, the breakdowns in Detroit income data for 2018–19 support the notion that the per capita income growth within Detroit in 2019 was caused by increases in the number of families with at least one worker and corresponding declines in the number of households receiving public assistance or SNAP, as well as in families with no workers in the household. There was also income growth within virtually all racial/ethnic, family-worker, and household income source categories where population sizes were large enough to present statistics (the exception being households with Supplemental Security Income).
The increases in the numbers of families with one or two workers, the increases in incomes within nearly all the income source categories, and the increase in labor market participation suggest that improvements in Detroit’s labor market (i.e., in both the number and quality of jobs) were at least partially responsible for the growth in income. It is notable that all these increases occurred in the context of a modest decline in the city’s population. We do not do comparable analysis for the other cities and states presented in figures 1 and 2. However, if we look at statistics for Michigan as a whole, we see more modest changes along a variety of dimensions. Statewide, the labor force participation rate increased by 0.4 percentage points in 2019 (from 61.5% in 2018 to 61.9% in 2019), as compared with the 2 percentage point increase in Detroit. In addition, for the entirety of Michigan, the number of families with no workers fell by 1.1% in 2019, as compared with the 12.9% decline in this number for Detroit. In Michigan as a whole, the numbers of families with one and two workers also declined modestly, whereas the numbers for them increased in Detroit. With regard to the income source categories, the percentage increases in income were also smaller in most of the categories for the whole of Michigan than for Detroit.
These findings also can partly explain why the DEAI did not fully predict the increase in income. While the model does condition on the labor force participation rate, the 2019 data were not available when the prediction was made. In addition, while the model uses information on the monthly level of employment, it does not have information on earnings from those jobs (other than annual aggregate real PCI data). So, monthly increases in income within jobs would not be captured by the DEAI.
Further analysis would be required to understand the root causes of the increase in the labor force between 2018 and 2019 and the increases in earnings. Some of the policies put in place to hire city residents for the projects related to Detroit’s renaissance could be partially responsible for additional jobs and higher incomes. For example, the City of Detroit’s Executive Order 2016-1 states that any entity entering into a “publicly-funded construction project” with a city contract or funding/assistance of over $3 million must meet specific residency targets for its workforce. This order’s impact on city employment was noticeable when the building of the new hockey arena required the hiring of many Detroiters for its construction. Another city policy called the Skilled Trades Employment Program (STEP) is an agreement that was established between local unions and the City of Detroit. STEP provides incentives to local unions to recruit and retain qualified Detroiters for all types of construction trades. Policies like these were implemented to help generate well-paying jobs for Detroiters.
Our tabulations suggest that from 2018 to 2019 the population of Detroit was partaking in some benefits of Detroit’s local renaissance—and of the economic growth experienced by the country as a whole. In spite of this, at the end of 2019, real per capita income for the city of Detroit ($21,044) was still substantially below real per capita income for the state of Michigan ($32,892), according to ACS data. That said, this gap had closed some in 2019 compared with the previous year. Unfortunately, the Covid-19 pandemic adversely affected Detroit’s public health and labor market in 2020, disrupting these encouraging trends.
Notes
4 We include a number of Michigan cities in figure 1. The cities comparable to Detroit from outside of Michigan that we feature in figure 1 were chosen based on the Chicago Fed’s Peer City Identification Tool, using 2019 data (accessed in January 2021): The peer cities with a similar level of economic resilience are Dayton, OH, and Palm Bay, FL. The peer cities with a similar economic outlook are Toledo, OH; Canton, OH; Cleveland, OH; Youngstown, OH; and Albany, GA. The peer cities with a similar population level are Boston, MA; Nashville, TN; and Oklahoma City, OK.
5 According to the U.S. Census Bureau, a household consists of all people who occupy a housing unit. People living in group quarters are not in households. A family consists of a householder and one or more related people living in the same household. Not all households contain families.
6 We show PCI growth rates where there are 65,000 people or more in a category or 26,000 households or families or more. Note that 65,000 is the minimum population of areas for which the ACS provides one-year estimates and that average household size is 2.5—which yields 26,000 households based on that minimum population threshold.
7 The increase in retirement income can also partly explain the DEAI model’s forecast miss because income of individuals who are not employed would not be picked up in the DEAI model anywhere. Note that some of the change in retirement income is due to changes in the ACS retirement income questions, which increased both the number of households with retirement income and the average level between 2018 and 2019. These changes affected household income measures for all places, not just for the city of Detroit.


