Each day, millions of parents rely on childcare workers to care for their young children. The labor market for childcare workers determines the wages paid to these workers and affects the operating costs of childcare businesses as well as the price and availability of childcare. As part of our Spotlight on Childcare and the Labor Market—a targeted effort to understand how access to childcare can affect employment and the economy—we use several data sources to study the paid childcare labor market.1 We first describe who childcare workers are, how many there are, where they work, and how much they make. Then we discuss how often these workers leave the childcare sector and where they go for other employment. Understanding the labor market for childcare workers is critical to understanding the challenges that families can face while attempting to access reliable, affordable, and convenient childcare.
We find the following:
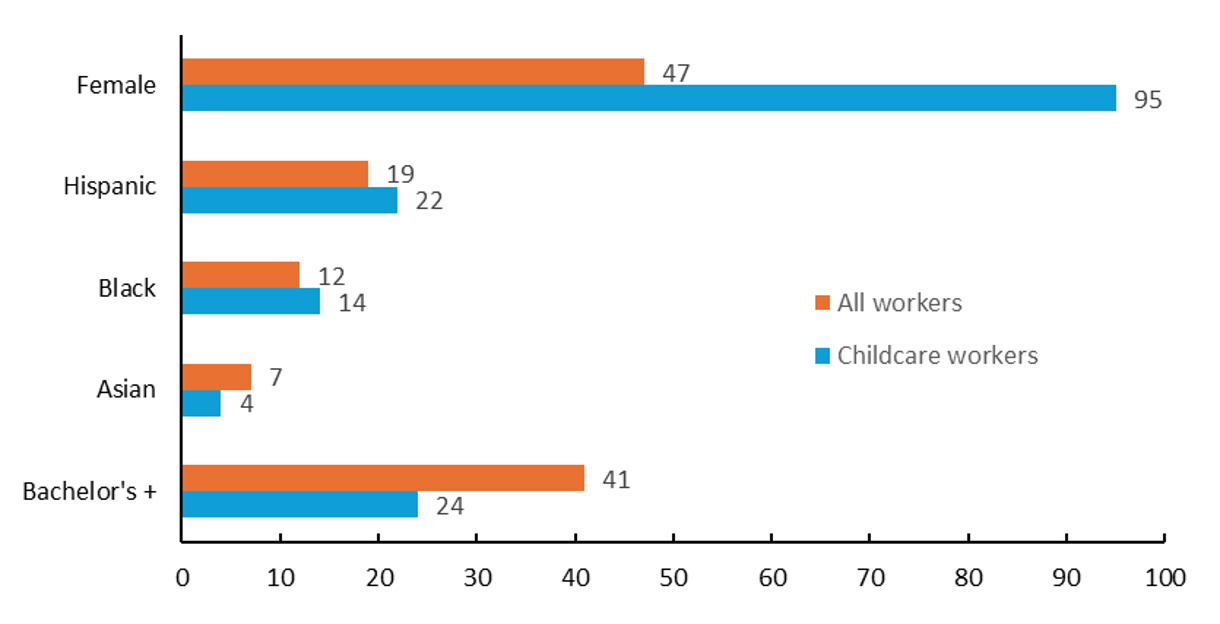
- Childcare workers are twice as likely to be women, about 15% more likely to be Hispanic or non-Hispanic Black, and 40% less likely to have a bachelor’s degree or higher education than the overall employed population.
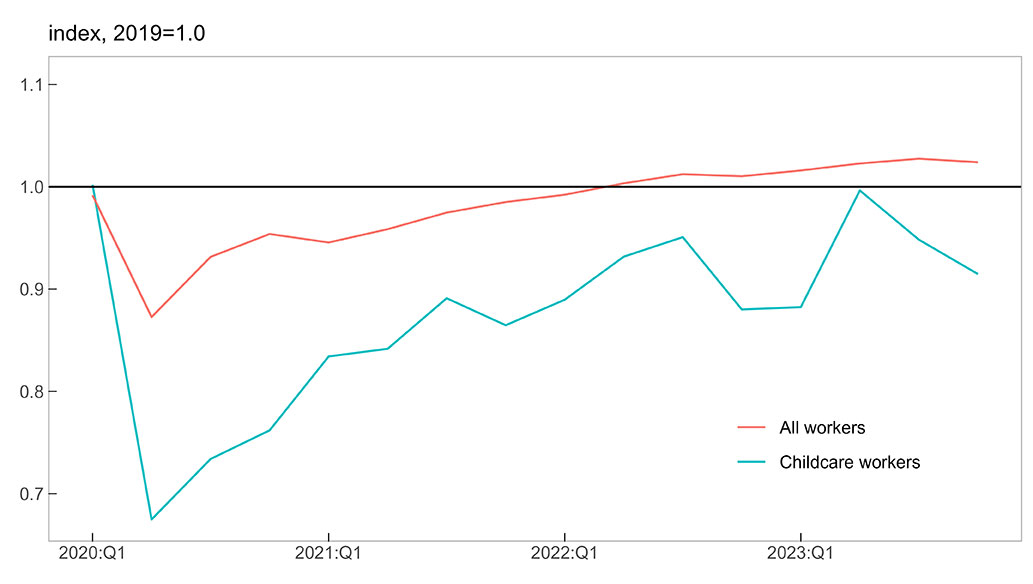
- The number of childcare workers, broadly defined according to reported occupations, remained 9% below its pre-pandemic level as of year-end 2023.
- The majority of childcare workers are employed in either the child day care services industry or private households. Employment within the child day care services industry is concentrated among small establishments (those with fewer than 20 employees or with 20 to 49 employees).
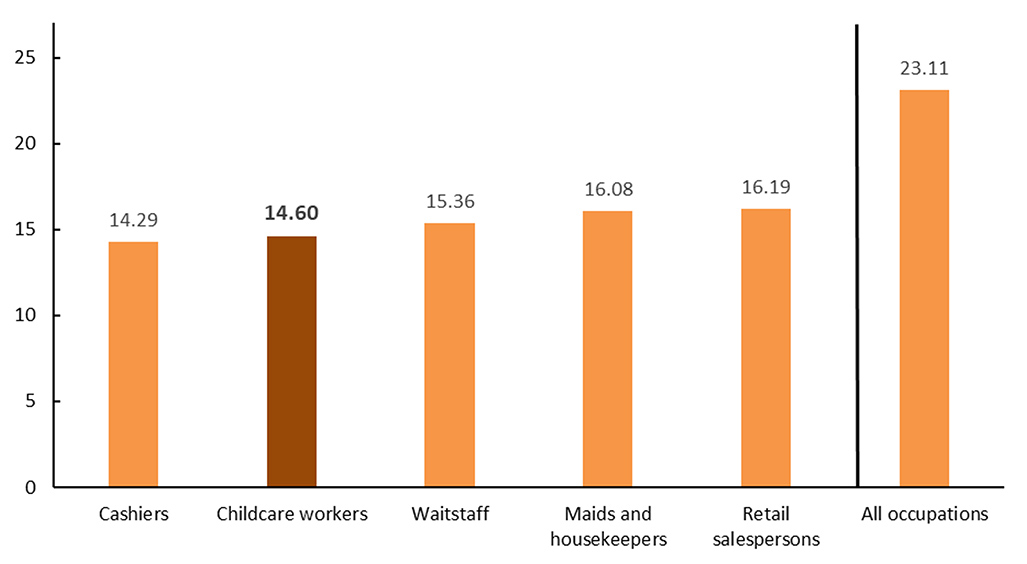
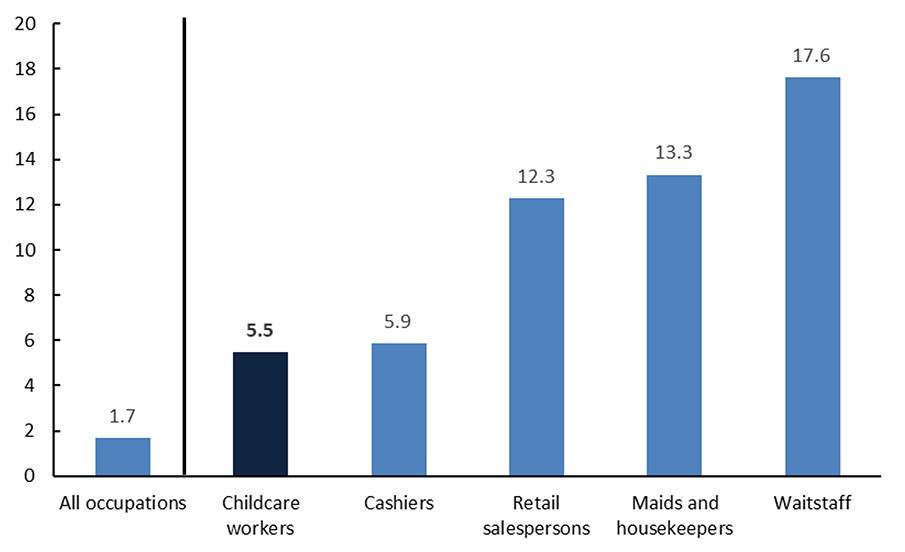
- The median wage paid to childcare workers is in the bottom 5% of all occupations and has grown less quickly than wages paid to workers in other service sector jobs in the post-pandemic period.
- Childcare workers leave the occupation relatively frequently, often exiting the labor force entirely. When these workers leave the childcare sector, it is often for jobs in another low-wage service sector, such as cashier, retail salesperson, waitstaff, or housekeeper; by the end of 2023, most of these occupations had higher wages than a childcare worker.
We end this article by considering some potential supply and demand side factors that can help explain why employment in the childcare industry has been slow to recover from the major disruptions caused by the pandemic.
Who are childcare workers?
We start by defining and describing childcare workers using the Current Population Survey (CPS), conducted by the U.S. Census Bureau for the U.S. Bureau of Labor Statistics (BLS).2 The monthly CPS asks people to report their industry and occupation. With the goal of describing workers who are doing the job of minding children, we broadly define childcare workers as individuals who meet at least one of two criteria. First, we include anyone who reports that their occupation is “childcare worker,” regardless of the industry they report. Second, we add to that anyone who states they work in the “child day care services” industry and reports an occupation other than “childcare worker,” but who we expect do tend to children (i.e., those who report either “preschool and kindergarten teacher” or “teaching assistant” as their occupation and “child day care services” as their industry).3
Figure 1 presents key demographic differences between childcare workers and all workers. The vast majority of childcare workers—95%—are female. Compared with the overall employed population, childcare workers are twice as likely to be female and are slightly more likely to be Hispanic or non-Hispanic Black. They are also less likely to be Asian or to have a bachelor’s degree or higher education relative to the overall employed population. Childcare workers are similar to all workers in terms of average age (38 years old), percentage who are non-Hispanic White (56%), and percentage who are foreign born (20%).
1. Key demographic differences between childcare workers and all workers, 2022–23
Source: Authors’ calculations based on data from the U.S. Bureau of Labor Statistics, 2022–23 Current Population Surveys, from IPUMS CPS.
How many childcare workers are there?
In 2019, prior to the Covid-19 pandemic, there were approximately 1.7 million childcare workers, about 1% of overall employment, according to CPS data. As with total employment, the number of childcare workers plummeted with the onset of the pandemic recession. Figure 2 shows the evolution of employment for childcare workers and all workers during the pandemic. Specifically, we plot the quarterly employment numbers for each group of workers from 2020 through 2023 relative to each group’s average quarterly employment in 2019.
The level of childcare workers fell to less than 70% of its 2019 level in the second quarter of 2020. As of the fourth quarter of 2023, childcare employment remained 9% below its pre-pandemic level. In contrast, employment for all workers fell to about 87% of its 2019 level in early 2020 but exceeded its pre-pandemic level in early 2022.
2. Quarterly employment for childcare and all workers relative to 2019 levels, 2020–23
Source: Authors’ calculations based on data from the U.S. Bureau of Labor Statistics, 2019–23 Current Population Surveys, from IPUMS CPS.
Where do childcare workers work?
Figure 3 shows the reported industries for those we designated as childcare workers. The majority of childcare workers report that they work in the child day care services industry, which provides facility-based care (i.e., care at locations such as child day care centers, nurseries/preschools, and Head Start program facilities).4 About 12% to 13% work in private households, likely as nonrelative caregivers or nannies; the remainder work in either schools or other locations for various other industries. Post-pandemic (i.e., in 2022–23), there was a small but statistically significant shift toward the child day care services industry and away from all these other settings.
3. Industry composition for childcare workers: Pre- and post-pandemic
| Pre-pandemic (%) | Post-pandemic (%) | |
|---|---|---|
| Child day care services | 70.8 | 74.3 |
| Private households | 13.1 | 11.7 |
| Elementary and secondary schools | 8.4 | 7.4 |
| Other | 7.8 | 6.6 |
Source: Authors’ calculations based on data from the U.S. Bureau of Labor Statistics, 2018–19 and 2022–23 Current Population Surveys, from IPUMS CPS.
Most people working in the child day care services industry work in small establishments. To see this, we use an alternative data set, the BLS’s Quarterly Census of Employment and Wages (QCEW), to identify the number and size of business establishments within the child day care services industry. There was an average of 78,757 child day care establishments across the United States in the first three quarters of 2023, up about 6.2% from 2019’s quarterly average. The composition of establishment sizes has remained stable in recent years, and the vast majority of workers work for small establishments. In the child day care services industry, 84% of workers work at establishments with fewer than 50 employees and 42% at establishments with fewer than 20 employees. In contrast, across all industries, 44% of workers work at establishments with fewer than 50 employees and 27% work at establishments with fewer than 20 employees.5
How much do childcare workers earn?
We use the BLS’s Occupational Employment and Wage Statistics (OEWS) to give insight into wages earned by childcare workers, as reported by employers. Note that the definition of a childcare worker is different here than in the CPS data discussed in the previous sections. These data are collected through a survey of employers—i.e., they are not self-reported data, as in the CPS. The OEWS data do not include the self-employed or household workers, for example (a thorough description of the types of workers excluded and included in these BLS data are available online).
Figure 4 shows the hourly wages overall and for selected low-wage occupations in 2023. The median hourly wage for childcare workers is $14.60, less than two-thirds of the median wage for all occupations. In fact, the median wage of childcare workers is in the bottom 5% of all occupational median wages—similar to the median wages of cashiers, waitstaff, maids and housekeepers, and retail salespersons.
4. Median hourly wage, by occupation, 2023
Source: U.S. Bureau of Labor Statistics, 2023 Occupational Employment and Wage Statistics.
In figure 5, we show how the wages of these occupations have changed since pre-pandemic times. We calculate the real wage growth as the percent change in median wages between 2019 and 2023 (with all wages having been adjusted to 2023 dollars). The median real hourly wage for childcare workers increased by 5.5% from 2019 through 2023, corresponding to an inflation-adjusted $0.76 increase in the hourly wage. While median real wage growth over this span was higher for childcare workers than for all occupations (5.5% versus 1.7%), it was lower for childcare workers than for other low-wage occupations.
5. Growth in real median hourly wage, by occupation, 2019–23
Source: Authors’ calculations based on data from the U.S. Bureau of Labor Statistics, 2019 and 2023 Occupational Employment and Wage Statistics.
How often do childcare workers leave the occupation and where do they go?
Returning to the CPS data, we measure monthly employment transitions for childcare workers, again using our broad definition of the child-minding occupation explained earlier. Overall, a little over 12% of childcare workers left the childcare sector each month during the period 2019–23. These job separations, of course, spiked during 2020, driven by a large share who became jobless as a result of the pandemic. With the exception of 2020, the transitions out of the childcare sector have remained stable over the period 2019–23.
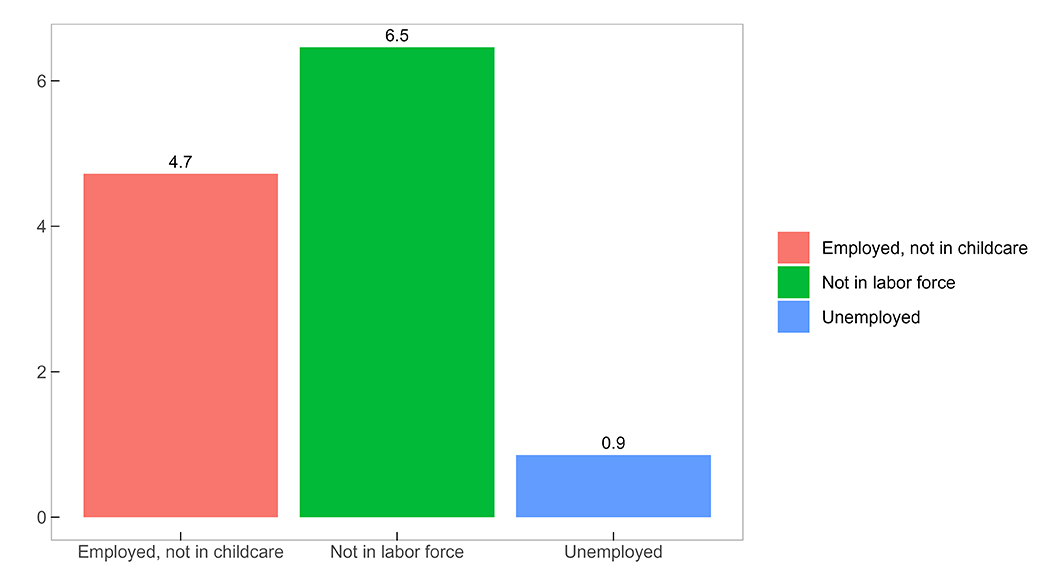
Figure 6 shows the average monthly transition rates from employment in the childcare sector to three different labor force statuses. Many former childcare workers left the childcare sector and exited the labor force entirely, a small share of them transitioned to unemployment, and the remainder transitioned to employment in other sectors.6
6. Average monthly transition rates out of employment in the childcare sector, 2023
Source: Authors’ calculations based on data from the U.S. Bureau of Labor Statistics, 2023 Current Population Survey, from IPUMS CPS.
While these average monthly outflow transitions for childcare workers are similar to those of other low-wage occupations, they are higher compared with the outflow transitions for all workers in the aggregate economy. In 2023, the average monthly transition out of the labor force was 6.5% for childcare workers and only 2.9% for all workers. An average of 4.7% of childcare workers per month transitioned to other types of employment in 2023. This is more than double the roughly comparable employer-to-employer transition rate in the aggregate economy, which was an average of 2.3% per month in 2023.7 Finally, average monthly transitions from employment to unemployment in 2023 were similar across both groups of workers, with less than 1% transitioning like this among both childcare workers and all workers in the economy as a whole.8
Of those workers who leave the childcare sector for other employment, less than a quarter find work as teachers or teaching assistants in primary or secondary schools, according to our analysis of the CPS data. The majority move into other low-wage occupations, such as cashiers, retail salespeople, waitstaff, maids and housekeepers, personal and home care aides, and customer service representatives.
Discussion: Demand and supply side factors in the slow-to-recover childcare labor market
While the pandemic caused major disruptions in employment nationwide, the childcare labor market was particularly hard hit and generally slower to recover. Total employment of childcare workers, as we’ve broadly defined, was still about 90% of its 2019 level by the end of 2023 (see figure 2). This recovery is slower than the recovery in overall employment, which returned to its pre-pandemic level by early 2022.
We consider both supply and demand side factors that can help explain why employment in the childcare sector has been slow to recover. First, regarding the supply side, child-minding is a low-paid occupation that comes with a great deal of responsibility. There is always a robust share of workers who leave the childcare sector, either by exiting the labor force altogether, by becoming unemployed (i.e., not employed but looking for a new job), or by taking another job outside the sector. Since 2019, wages in childcare have grown more slowly than wages in the other service jobs (e.g., cashier, retail salesperson, housekeeper, and waitstaff) that workers frequently begin after leaving the childcare sector. Thus, the supply of workers in this sector may be lower than in the past—and lower than in other comparable service sectors.
Regarding the demand side, there are fewer young children today than there were before the pandemic, potentially putting downward pressure on demand. With that said, women with young children are more likely to be participating in the labor force and are working more hours, conditional on participating, than prior to the pandemic.9 This suggests there is now a greater demand for childcare, especially among women with young children. While those opposing forces play out against a backdrop of shifting work-from-home arrangements, employers and families continue to report access to affordable, high-quality childcare as a major barrier to employment (Anderson, Healey, and Heissel, 2024).
One might assume that over time, if demand for childcare workers is robust, then wages will rise, enticing more people to take childcare jobs over other service sector jobs. However, childcare is a sector where prices charged to families are very tightly tied to wages paid to childcare workers, so as wages rise, more families could find care unaffordable and thus cut back on their own work hours or exit the labor force altogether.
Notes
1 Some families also use unpaid childcare, mainly provided by relatives (see Hartley and McGranahan, 2024). While we do not specifically analyze this group of childcare providers, they are an important part of the childcare market, and those who live close to family (who are willing and able to provide childcare for free) may be more price sensitive.
2 We accessed the CPS data through IPUMS CPS.
3 The CPS groups together preschool and kindergarten teachers in the same occupation code. However, because we require these individuals to be within the child day care services industry (rather than the elementary school industry) to meet our childcare worker definition criteria, we suspect there are very few kindergarten teachers in our sample. About 67% of respondents that we classify as childcare workers report “childcare worker” as their occupation. The remainder work in the “child day care services” industry—with 26% of the total respondents in our sample reporting “preschool and kindergarten teacher” and 7% reporting “teaching assistant” as their occupation.
4 See the BLS’s Quarterly Census of Employment and Wages webpage for the definition and examples of establishments in the child day care services industry.
5 From the QCEW, we only have information on establishment size for private establishments across all industries. However, because over 95% of all child day care establishments in the QCEW are private, these statistics on establishment size are likely representative of the industry as a whole.
6 See Fee (2024) for a related analysis from the Federal Reserve Bank of Cleveland.
7 We recognize that the employer-to-employer transition rate for the aggregate economy is not a direct comparison to our measure of employed in childcare to employed outside of childcare because the aggregate economy transitions comprise both those within the same sector and those across sectors.
8 The 2023 average monthly transition rates from employment to unemployment and from employment to not in the labor force for all workers are from our own calculations using data from the BLS’s labor force statistics. The average monthly employer-to-employer transition rate for all workers come from our own calculations using Fujita, Moscarini, and Postel-Vinay (FMP) Employer-to-Employer (E2E) Transition Probability data, accessed on May 30, 2024.
9 Camilo Garcia-Jimeno and Luojia Hu, 2024, “Female labor force participation in the post-pandemic era,” Chicago Fed Insights, Federal Reserve Bank of Chicago, available online.


