

For many parents, working during the years when children are too young for school requires figuring out arrangements for childcare. As part of our Spotlight on Childcare and the Labor Market, a targeted effort to understand how access to childcare can affect employment and the economy, we analyze recent survey data on which types of childcare arrangements working women with young children rely upon in the U.S. and the five midwestern states of the Chicago Fed’s Seventh District. We also examine how much these care options cost. We analyze how childcare costs and arrangements differ by household income, across the five states of the Seventh District, and across the District’s two largest metro areas, Chicago and Detroit.
We have four main findings:
- Care from relatives and care at childcare facilities are the most common types of care arrangements both nationally and in the Seventh District.
- A large portion of care is not paid for, particularly care provided by relatives.
- Care arrangements vary by location and income. Households with lower incomes and households in Detroit are more likely to have care provided by relatives, and households with higher income and households in Iowa are more likely to use childcare facilities.
- The cost of care also varies by location and income. Households with lower incomes are both less likely to pay for care and pay less on average than households with higher incomes. Among those who do pay, costs are lower in the Seventh District than nationally, although costs in Chicago are higher than the national average.
The Census Pulse provides recent data on childcare arrangements used by households with a working woman, who lives with at least one child under five years old and no older children.
Our data come from the U.S. Census Bureau’s Household Pulse Survey(the Census Pulse), which is a periodic 20-minute online survey of U.S. households that began during the Covid pandemic. Through the end of 2023, there were 63 weeks of the survey and multiple phases. In a number of these phases, the survey asked questions about childcare. For this article, we focus on questions about types of care and childcare cost asked in nine waves of the survey from September 2022 to May 2023.1 We focus on responses by working women with young children. Specifically, we analyze responses only from households where the survey respondent is a working woman, who lives with at least one child under five and no children over the age of five. Just under 20% of working women respondents with any kids in the household are in this category.2
The most common childcare arrangements are childcare facilities and relatives.
We begin by focusing on a question that asks, “In the last 7 days, did your household use any of the following individuals or arrangements to look after the children in the household?” Respondents were asked to “select all that apply,” meaning that they could select more than one answer.
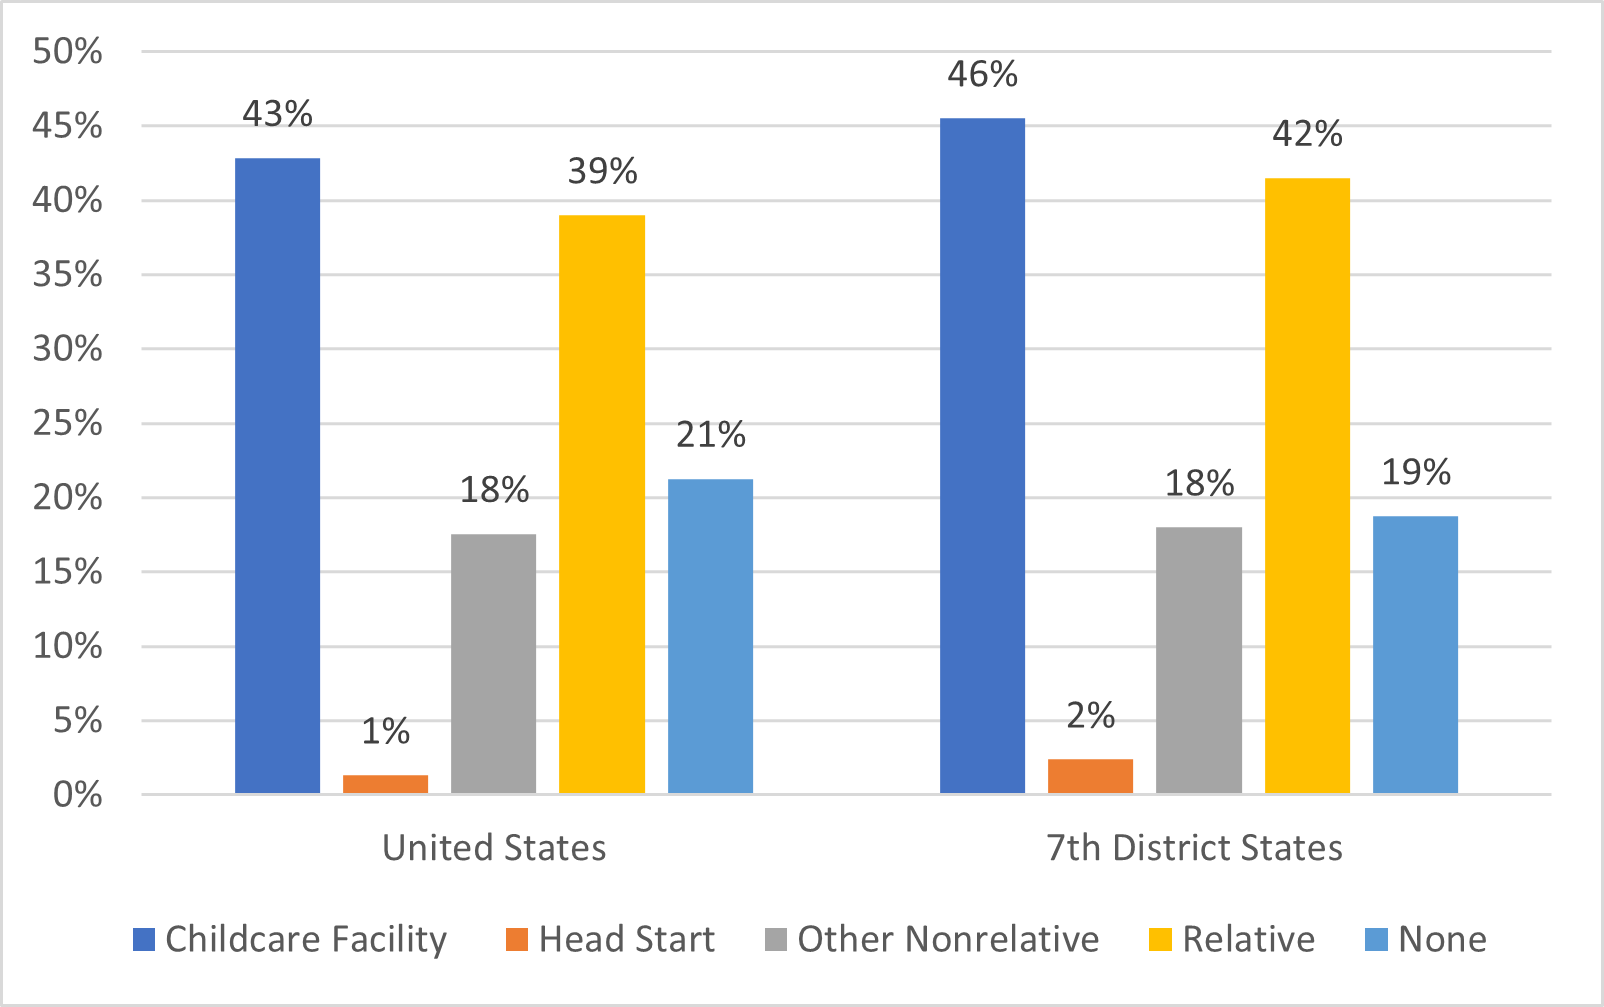
In figure 1, we provide tabulations on the share of these households who report using one or more of four different care arrangements or who report using no care, both nationally and in Seventh District states.3,4
Care Arrangements
Childcare facility: This is care at a childcare or day care center, at a nursery school or preschool, school-based before or after care, or summer camp. Although Head Start programs are also offered at facilities, we measure them separately.
Head Start: This is the federally supported Head Start Program, a free income-based federal program that provides childcare while also linking families to other services.
Other nonrelative: This includes care provided by a broad group of non-relatives such as a friend, neighbor, sitter, nanny, au pair, and family day care where a provider is caring for two or more children outside of the child’s home.
Relative: Care provided by a relative other than the parents, such as a sibling or grandparent.
None: Indicates that the household did not use any of the listed arrangements to look after their children. Given the comprehensive nature of the options, this is interpreted as meaning that parents provided all the care for their children.
We find that care in childcare facilities is the most common arrangement. This is followed by relative care and none. The high levels of relative and childcare facility care are consistent with the longstanding Census series, which was last released in 2013 (covering data through 2011) and showed that relative care, particularly from grandparents, and care in childcare facilities were the most common arrangements for working mothers with preschoolers. This publication also provides breakdowns within the “none” category for employed mothers (that are not available in our more limited data source). It finds that through 2011, the most common type of arrangement within this category is for the father to provide care while the mother works.
1. Childcare arrangements for working women with young children in the U.S. and Seventh District
As noted, respondents can report using multiple care arrangements. For working female respondents who only have kids under five, both in the Seventh District and nationwide, over 70% of those reporting any of the four listed care arrangements report only one, with the great majority of the remainder reporting two.5 Among those reporting two, relative care is part of the combination in most cases. The two most common combinations are childcare facility care and relative care (about 60% of combinations) and other nonrelative care and relative care (about 25% of combinations).
About 40% of working women living only with children under five do not pay for childcare. Among the 60% who do pay, their costs are lower in the Seventh District than in the nation as a whole.
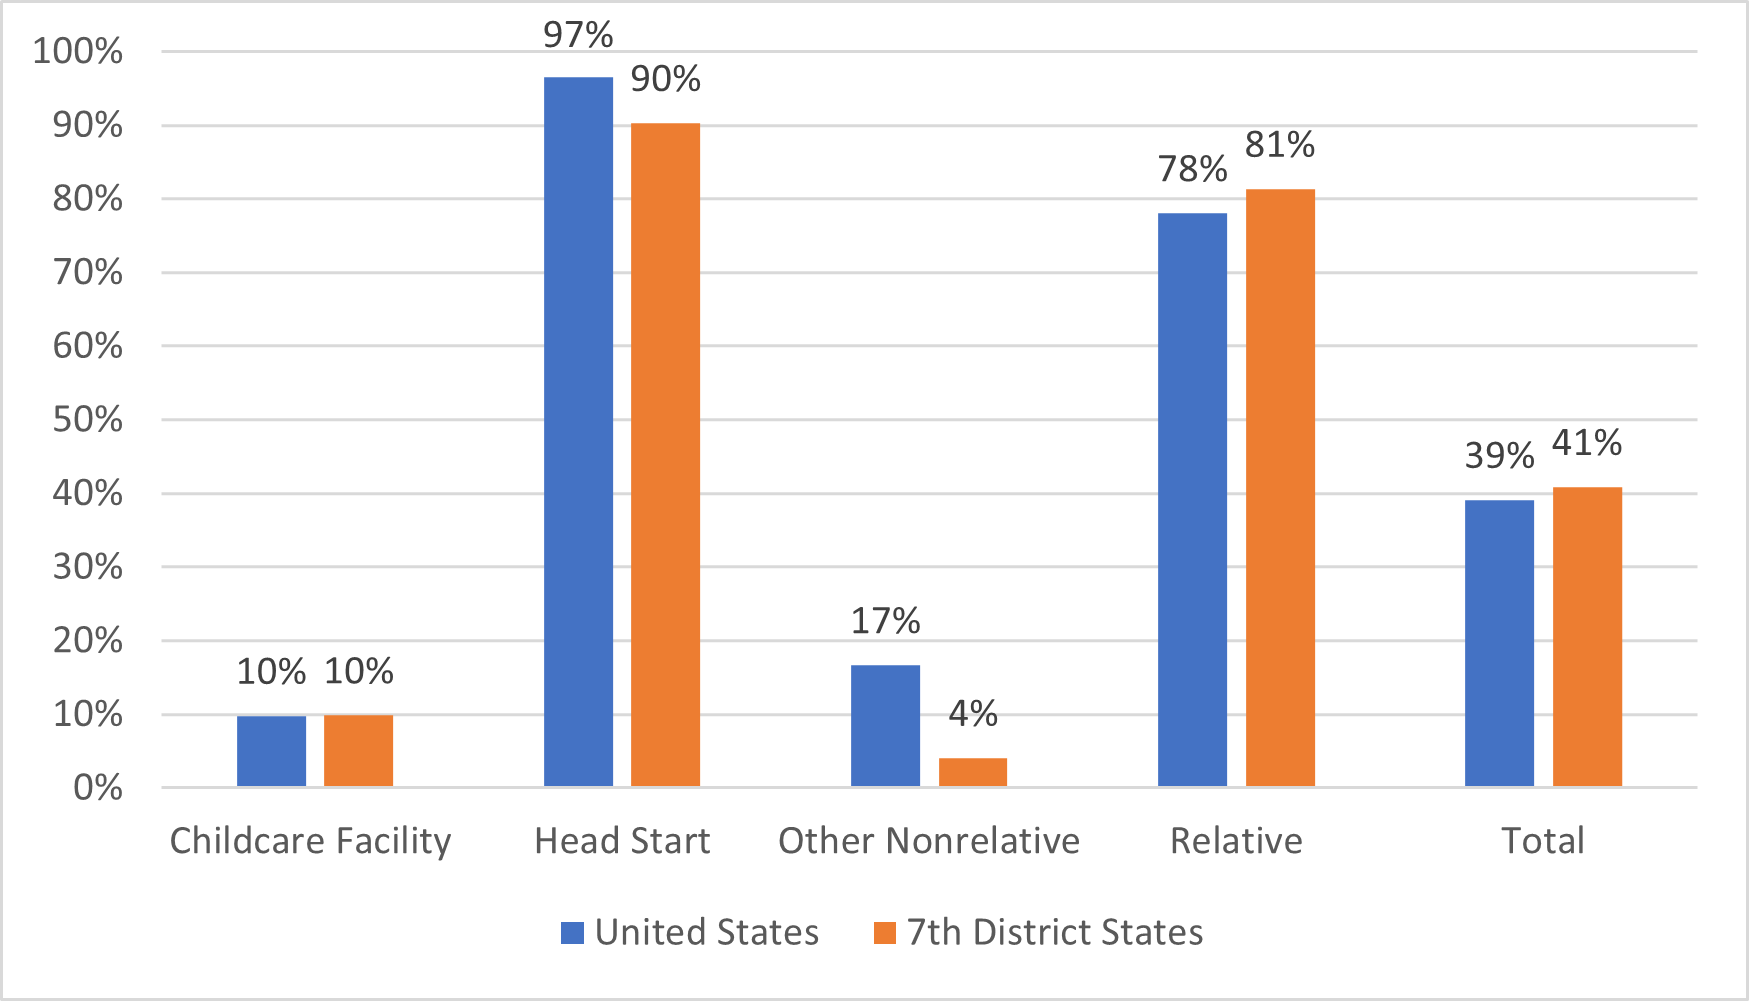
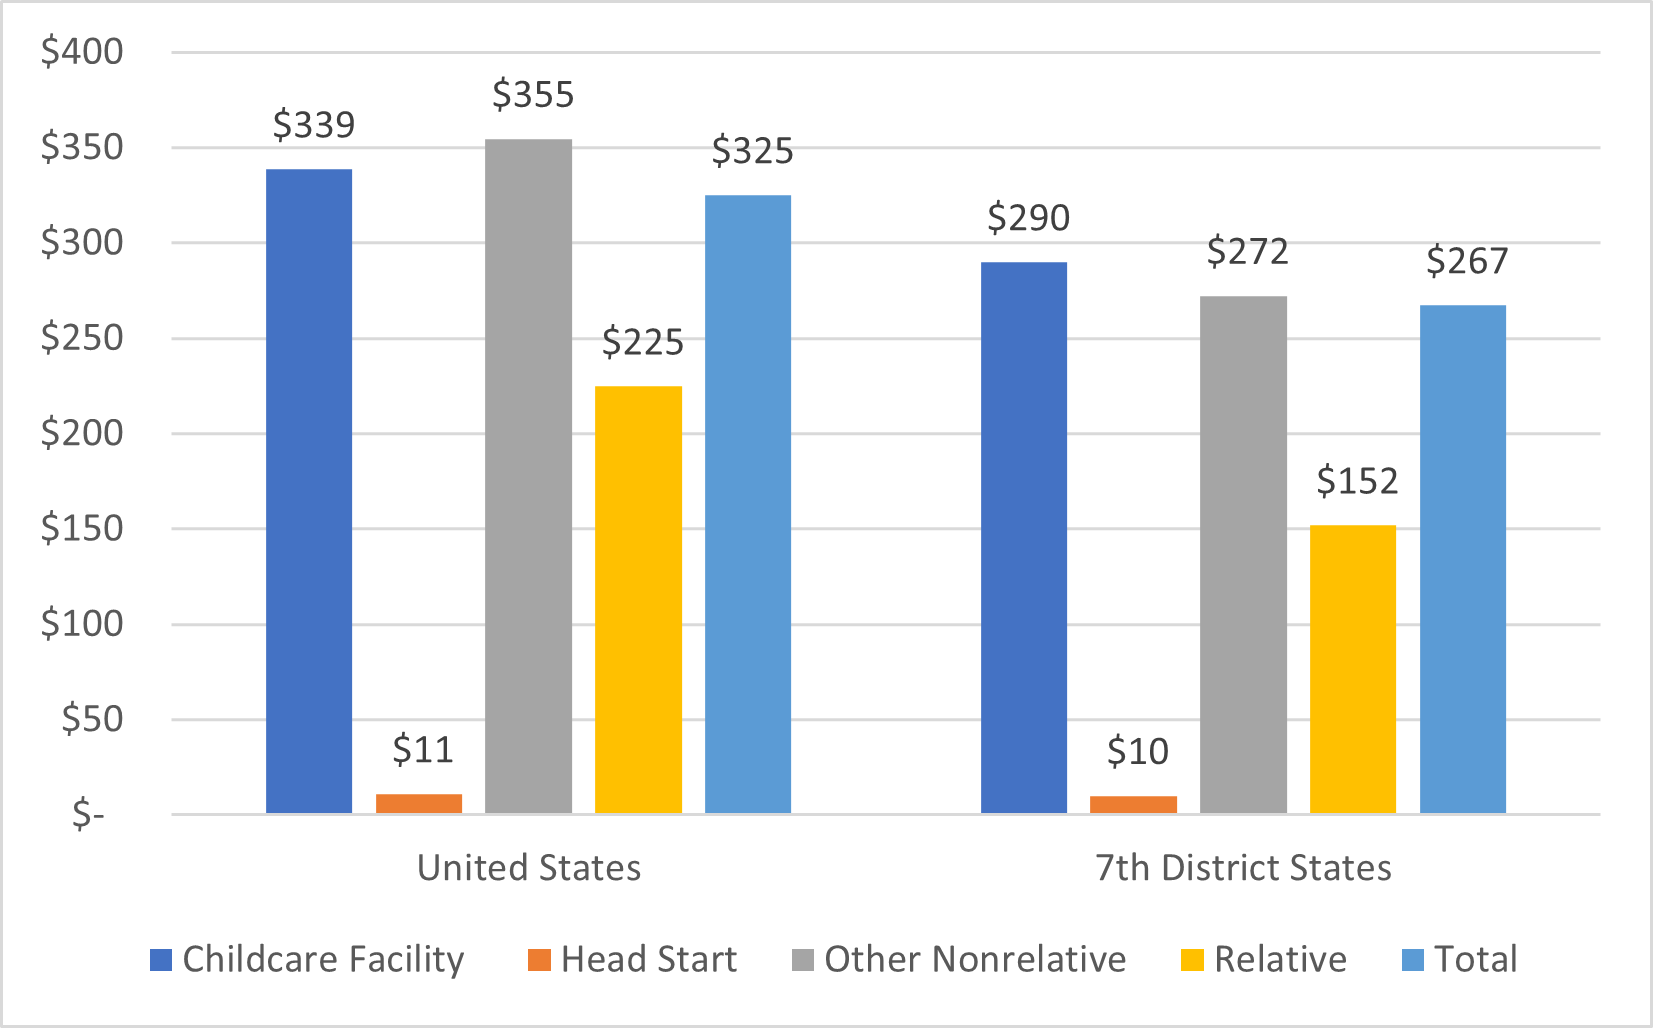
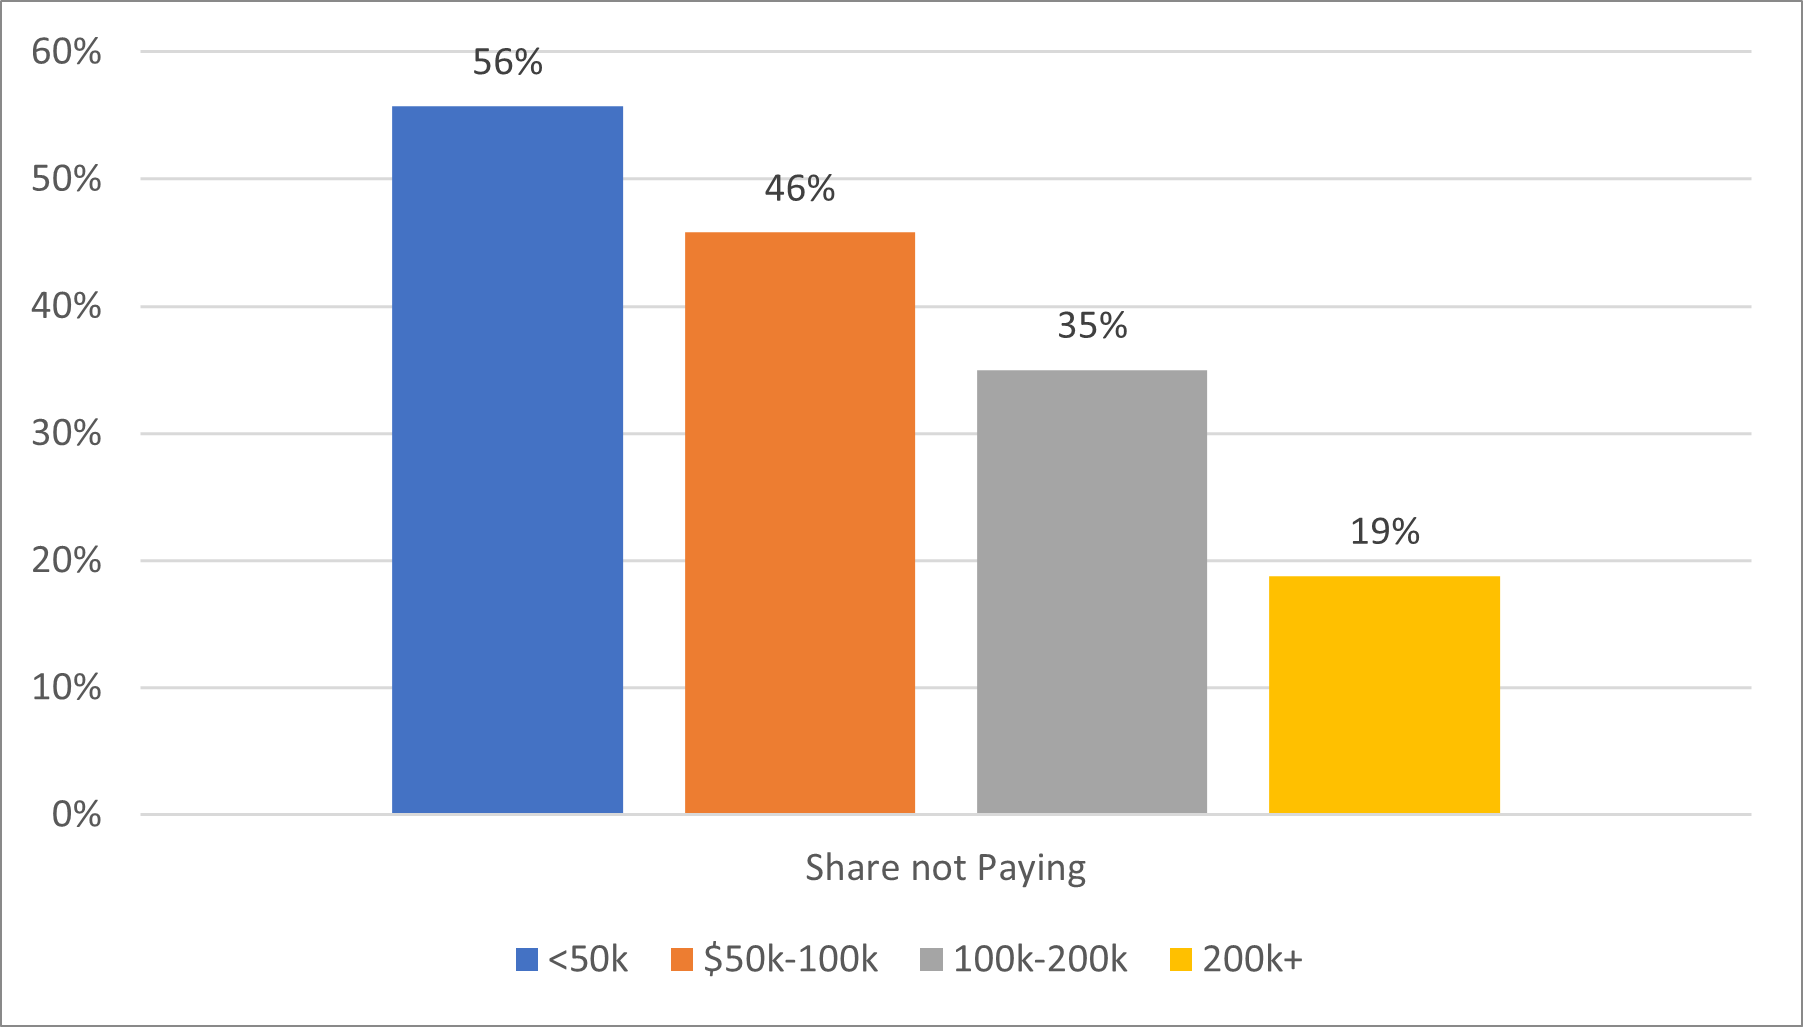
The survey also asks respondents whether they paid for care in the prior week and if so, how much. In figure 2, we show the percentage who did not pay and in figure 3, the average per-child cost of each care arrangement conditional on paying. To calculate the per-child cost of each type of arrangement, we only look at working women respondents with one child (under five) and with a single childcare arrangement, because the data do not provide information on the cost of care by type (only the total) or by child.6
A few things stand out in these figures. First, much childcare is not paid for. Among households with working women respondents, only kids under five, and only one kid, 40% using one type of care do not pay for it. The share of households that do not incur any costs is highest for the federal Head Start program (97%), but also high among the many households relying on relatives to provide care (78%). Second, among those who pay, and outside of relative care and Head Start, the average cost is quite similar across arrangements. In particular, facility-based care is similar in average cost to other nonrelative care—both in the Seventh District and nationally.7
When we compare the U.S. to the Seventh District, we find that the percentages of households not paying are broadly similar, except for nonrelative care, where more Seventh District households pay. However, conditional on paying, the average costs of care are lower in the Seventh District for all types of care arrangements, except Head Start where the minimal average cost is about the same.
2. Share of respondents not paying for care, households with only one child and one care arrangement
3. Average weekly cost of care, households with one care arrangement and one child
Households with lower incomes use less facility-based care and more relative care, are less likely to pay for care, and pay less on average.
The survey also includes data on respondents’ total annual household income, so we investigate how care arrangements, the cost of care, and whether households pay for care varies by household income.8
Figure 4 shows the types of care arrangements used by Seventh District households with working women respondents by household income.
4. Care arrangements by income category, Seventh District households with one care arrangement and only children under five
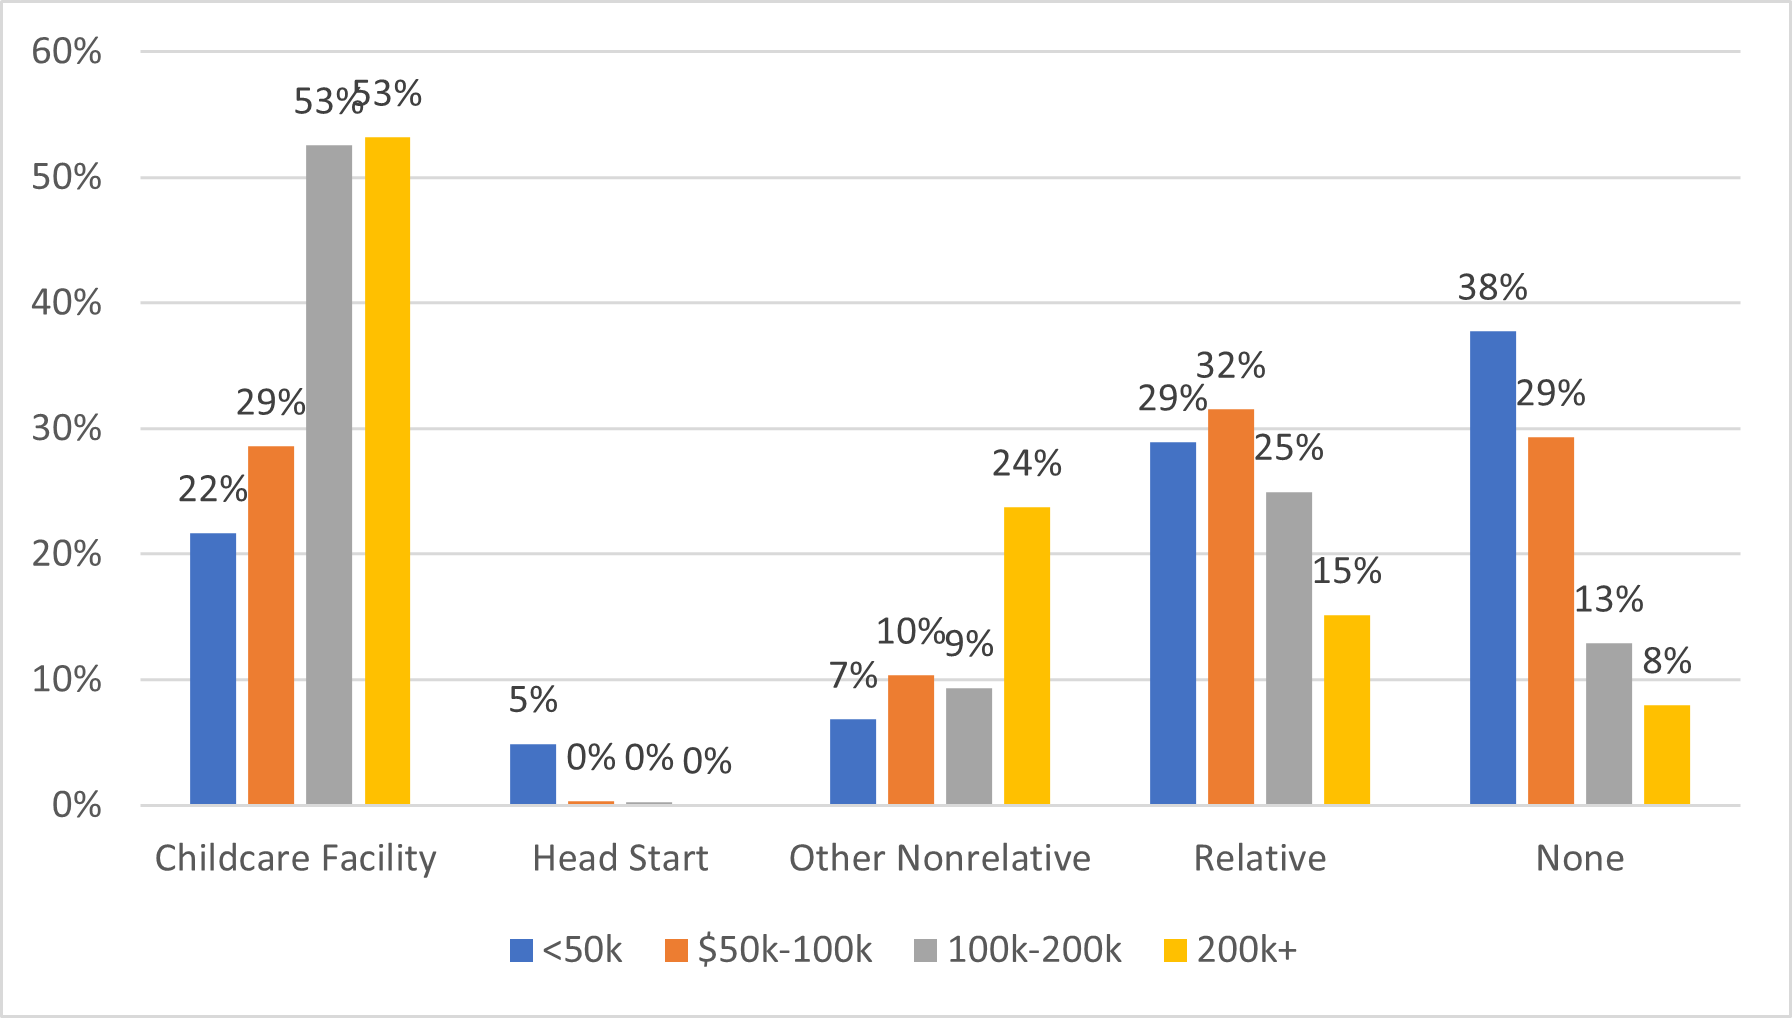
As can be observed in figure 4, there are differences across income categories. The households with the lowest incomes have high shares of none and relative care and low shares of nonrelative and facility-based care. In addition, the lowest income category is the only group with non-trivial Head Start participation, which is consistent with the targeted nature of the program. The households with the highest incomes have low shares of relative care and none and high shares of facility-based care and other nonrelative care. This may reflect both that they are better able to afford to pay for facility-based and nonrelative care and that these arrangements better meet their childcare needs. Patterns for the entire U.S. (not shown) are broadly similar.
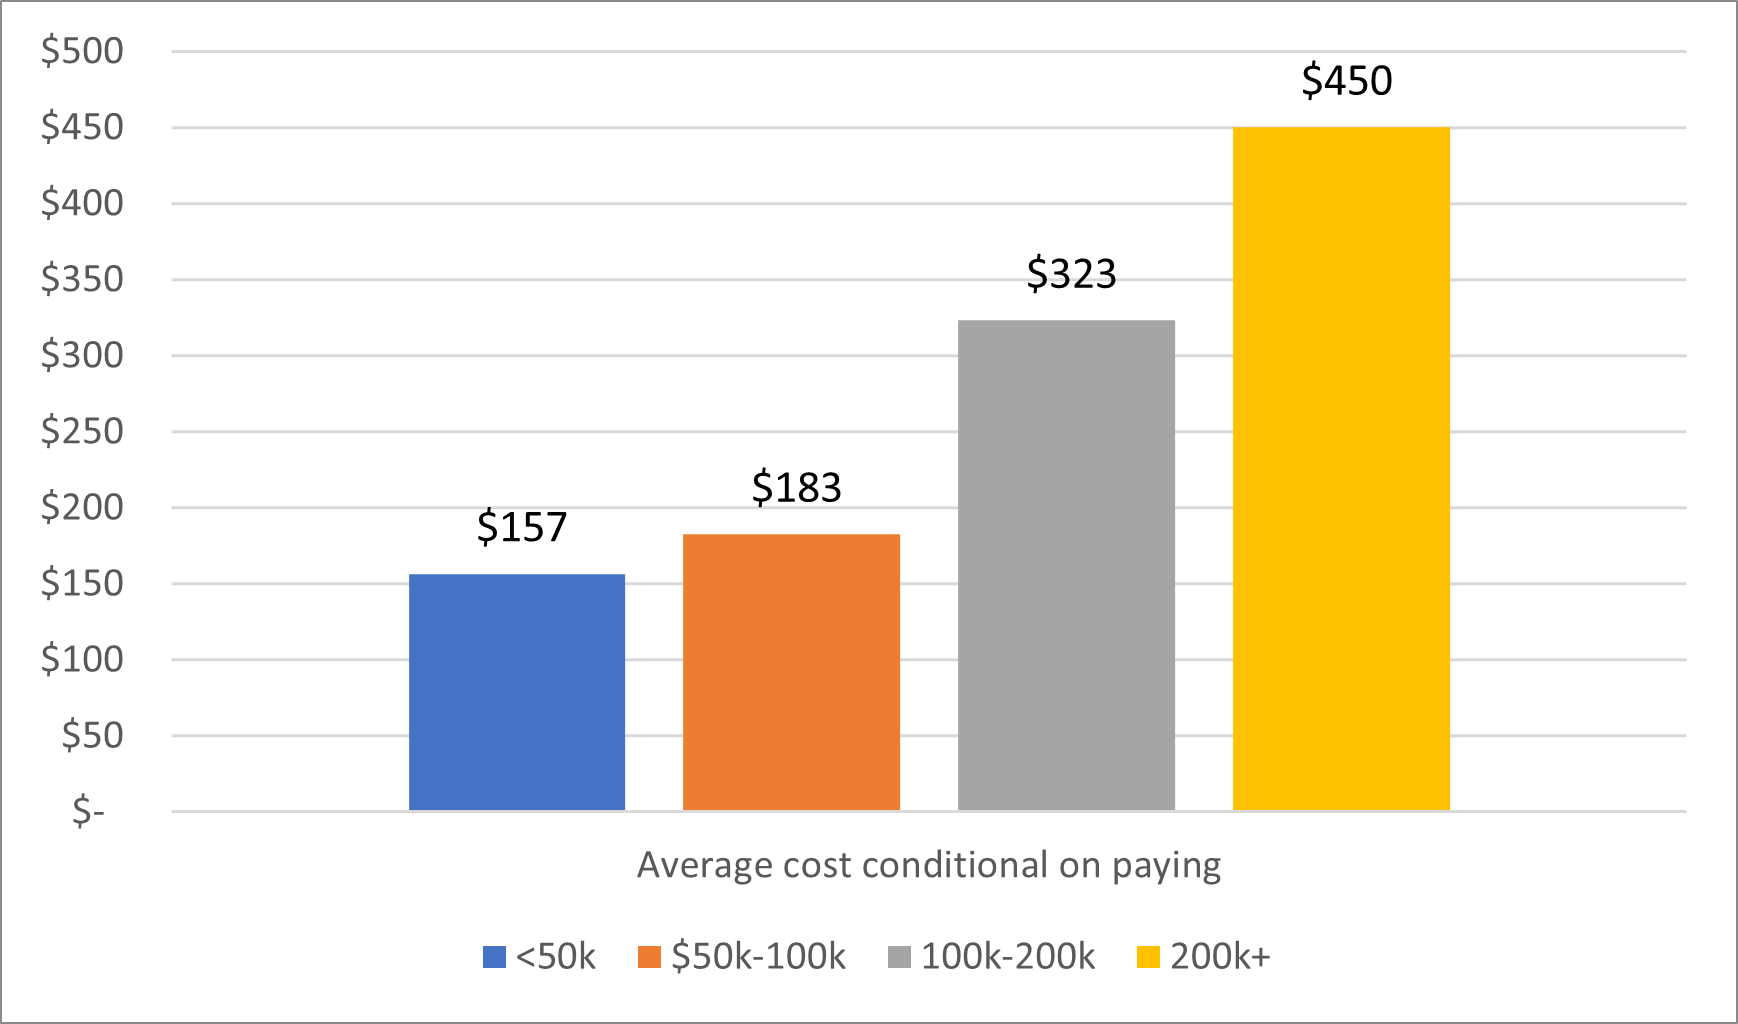
Figure 5 shows the percentage of households not paying for care by income category within the Seventh District, restricted (as in figure 2) to households with only one kid who use only one type of care arrangement, while figure 6 shows the average cost of care for the same population. The percentage paying for care increases with income, as does the average cost of care. Households in the top income category are almost twice as likely to pay for care and conditional on paying, pay nearly three times as much as households in the lowest income category. Since the question on cost of care excludes households that report no care arrangement, this is in addition to the finding (in figure 4) that the households with income in the lowest category are nearly five times as likely as those with income in the highest category to have no care.
5. Share of respondents not paying by income category, Seventh District households with one care arrangement and one child
6. Average weekly cost by income category, Seventh District households with one care arrangement and one child
Usage of care arrangements varies dramatically across the cities and states in the Seventh District.
We next examine how the usage of different childcare arrangements and overall spending patterns vary within the cities and states of the Seventh District. Again, our focus is on households that only had children under five with working women respondents and only used one care arrangement.
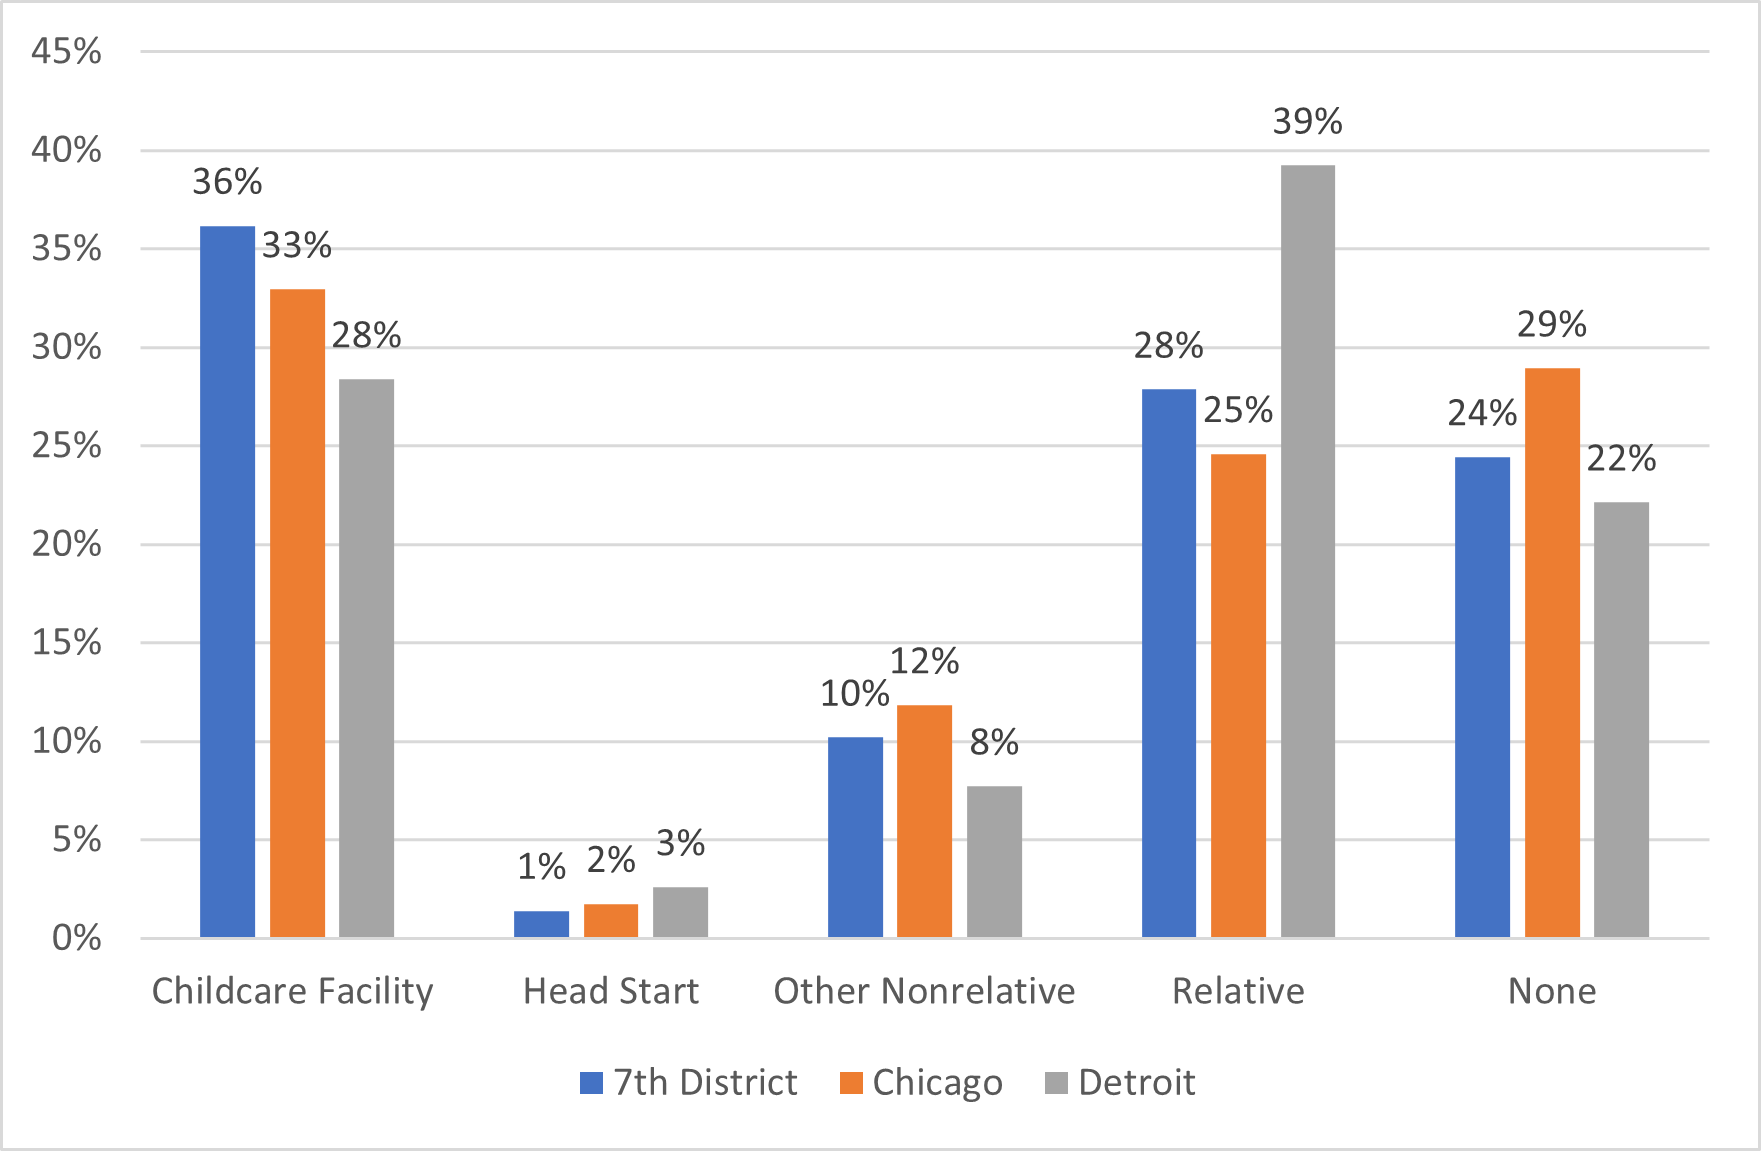
We look at two sets of data—In figure 7a, the Seventh District states combined (Iowa, Indiana, Illinois, Michigan and Wisconsin) and the two Seventh District metropolitan areas with available data, Chicago and Detroit; in figure 7b, the Seventh District states combined, as well as each of the five states.
7a. Care types in Seventh District states, Chicago and Detroit, households with one care arrangement and only children under five
7b. Care types in Seventh District states and by state, households with one care arrangement and only children under five
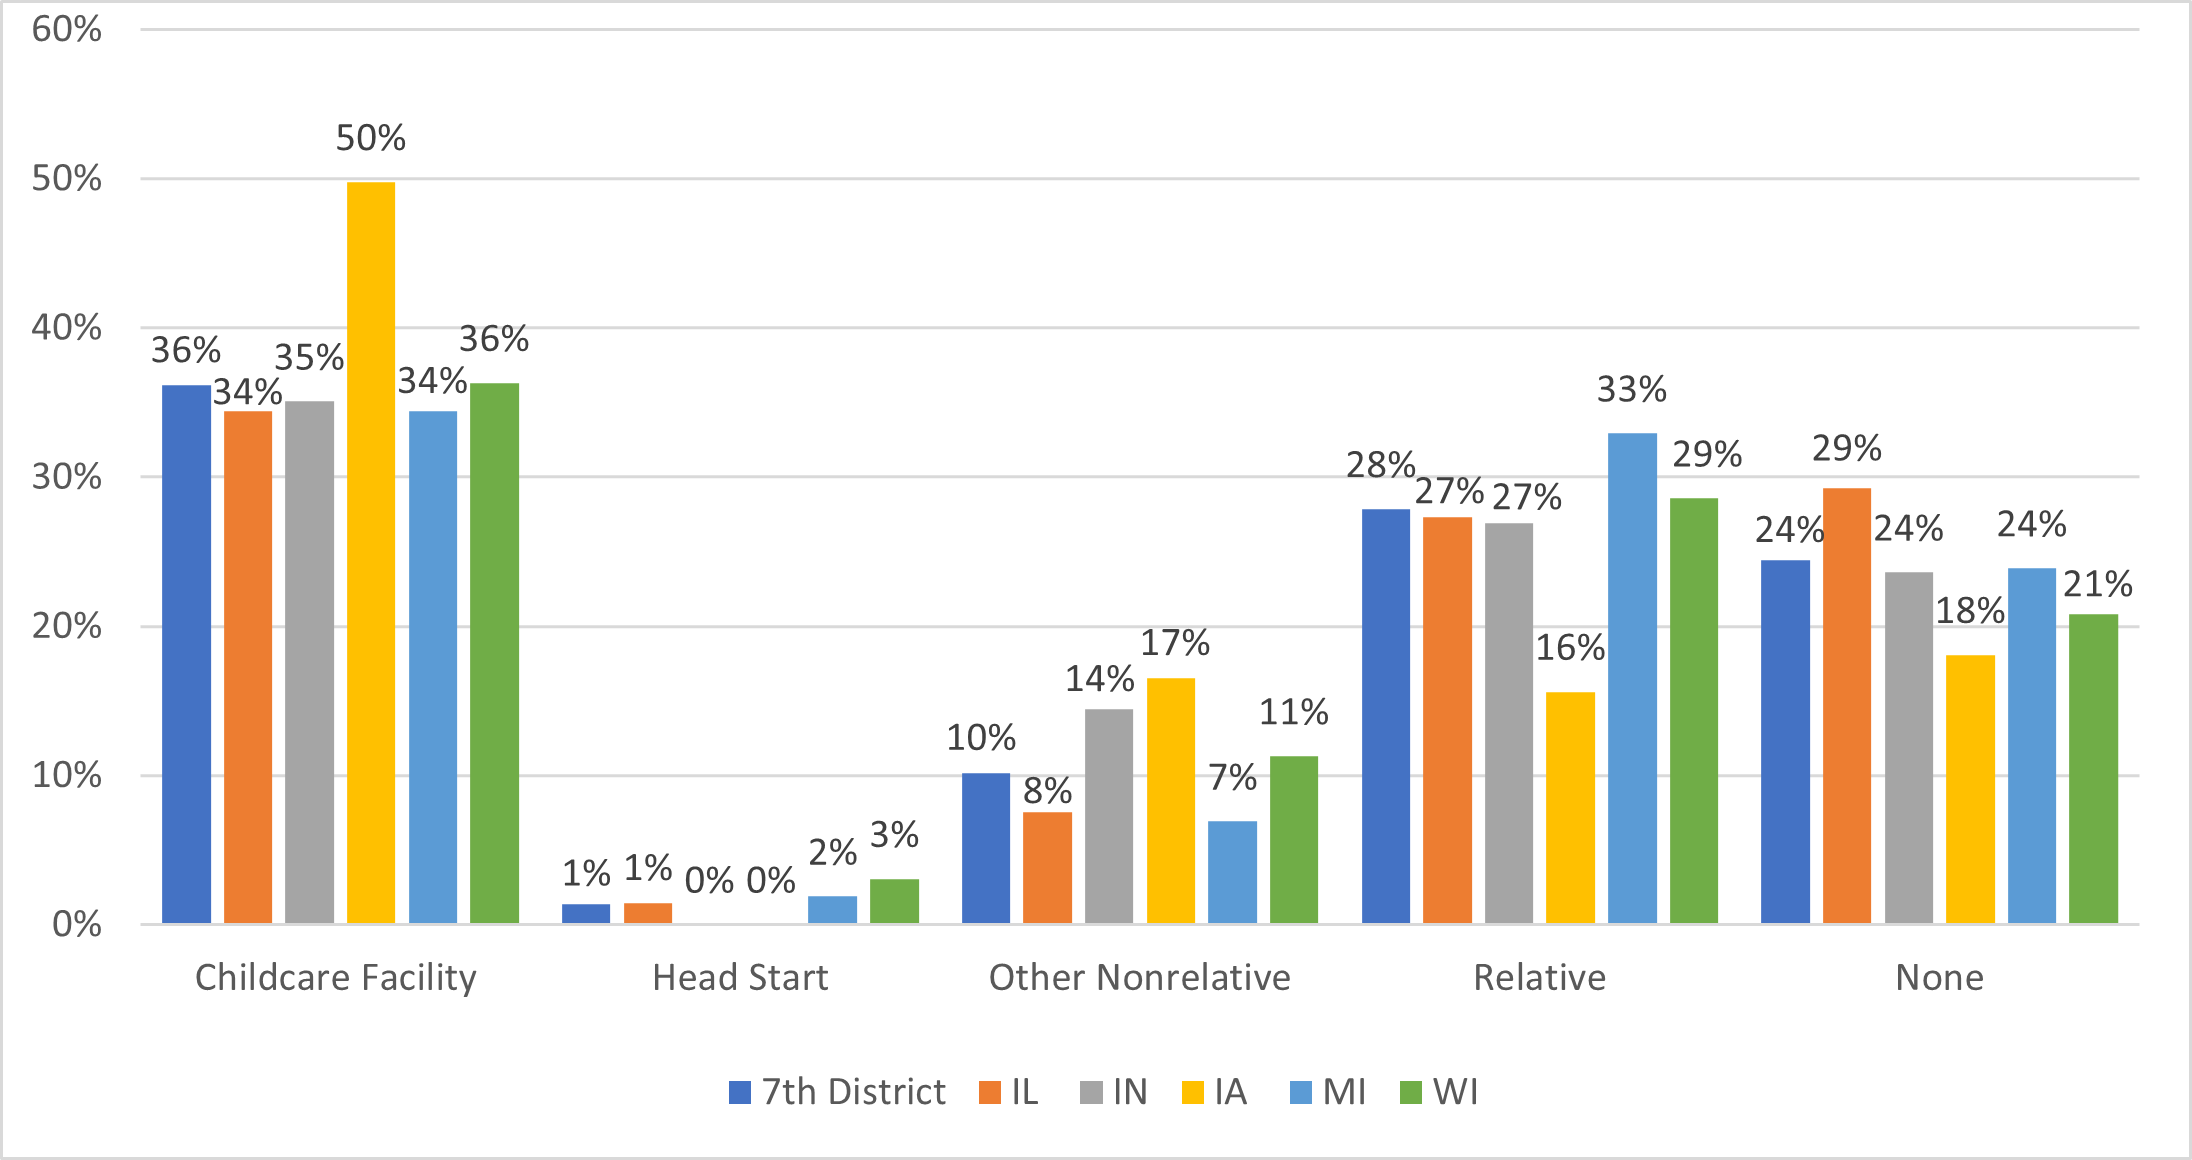
There are notable differences in care arrangements by location. Two particular patterns stand out from the figures. First, as shown in figure 7a, Detroit is an outlier. Relative care is 11 percentage points more prevalent among households in Detroit than in the Seventh District as a whole and 14 percentage points more prevalent than among households in Chicago. Second, as shown in figure 7b, the patterns for households in Iowa differ from those in the other Seventh District states. Households in Iowa use over 10 percentage points more facility-based care and over 10 percentage points less relative care than households in any other Seventh District state.9
Next, we investigate whether differences in household attributes across the cities and states in the Seventh District can explain these dramatic differences in the use of childcare arrangements. In particular, we look at whether differences in income, race, ethnicity, and other household attributes among respondents in the Detroit metro and in Iowa versus those in the rest of the Seventh District might explain the greater provision of childcare by relatives in Detroit and greater use of facility-based care in Iowa. We use the household-level survey data to estimate whether being in Detroit predicts the use of relative care, while controlling for income range, race, ethnicity, marital status, and educational attainment. We find that even with these controls, Detroit households are 13 percentage points more likely to use relative care than households in other locations in the Seventh District. We perform a similar analysis for facility-based care in Iowa and find that households in Iowa are 20 percentage points more likely to use facility-based care than households located in the rest of the rest of the Seventh District, controlling for respondent characteristics.10 From this analysis, we conclude that differences in income and other attributes do not fully explain why relative care use is so much higher in Detroit and why facility-based care use is so much higher in Iowa.
Costs also vary across cities and states and are particularly high in Chicago.
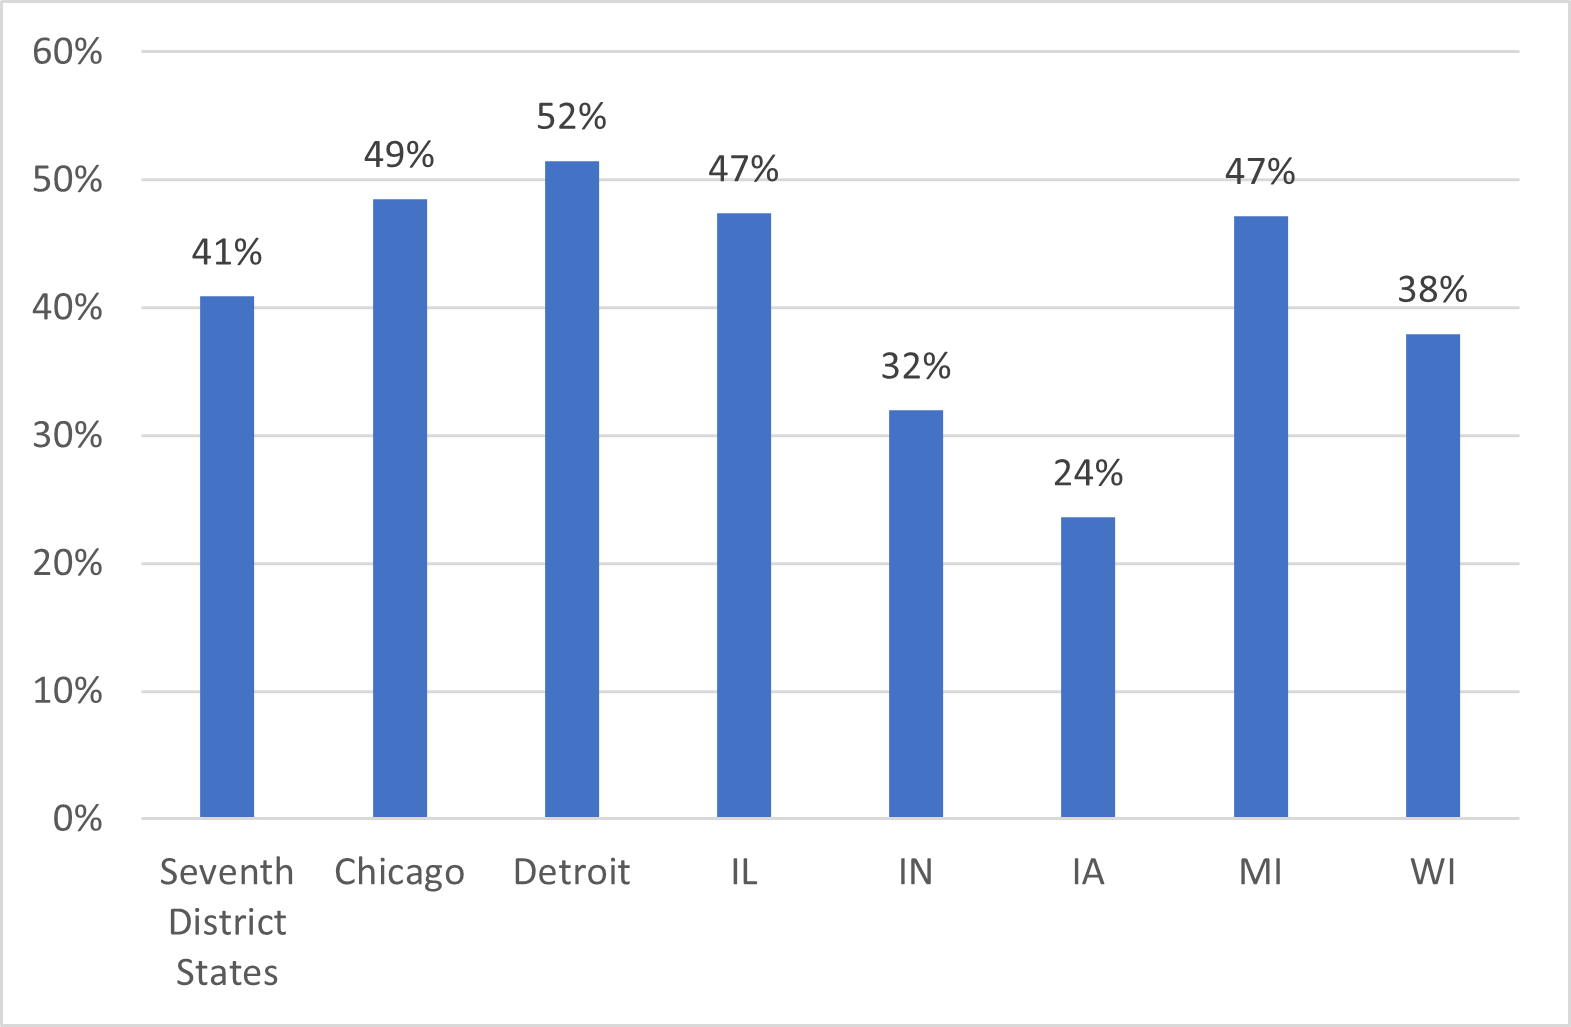
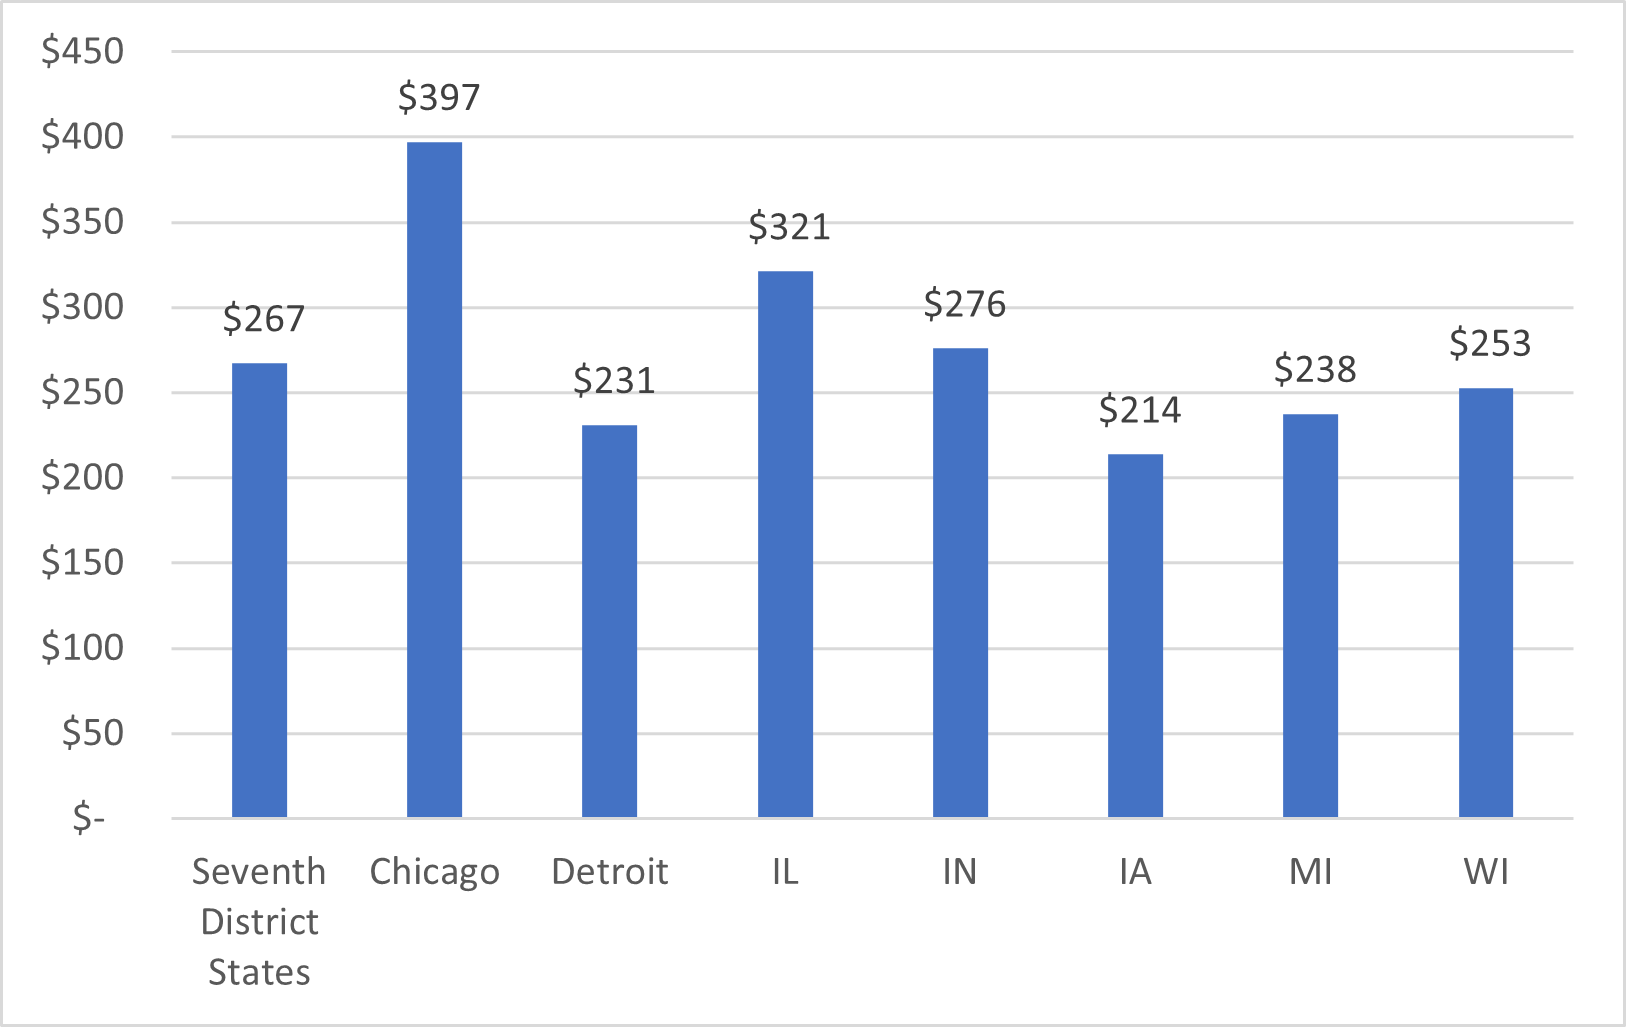
For our final tabulations, we show in figure 8 the percentage of households that do not pay for care and in figure 9, the average cost for the cities and states in the Seventh District. Again, we look only at households with a working woman respondent, one care arrangement, one child under five, and no older children. The share not paying is highest in Chicago and Detroit and therefore, highest in Illinois and Michigan. The share not paying is lowest in Iowa, which is consistent with the relatively high levels of center-based care in that state. The average cost in Chicago is substantially higher than in the remainder of the Seventh District, as well as being higher than the national average cost.
8. Share of respondents not paying by location, households with one care arrangement and one child
9. Average weekly cost by location, households with one care arrangement and one child
Conclusion
We analyzed data from the Census Pulse from fall 2022 to spring 2023 on childcare arrangements in the U.S. and in the Seventh District. We find that households with working women survey respondents and young children primarily rely on facility-based care and relatives for childcare. A substantial share also have no care arrangement, indicating that either the survey respondent or the other parent cares for the children while the respondent works. We also find that when households arrange care at childcare facilities or with nonrelatives, they typically pay for care. But households typically do not pay when they use relative care and the federal Head Start program. We also find that the type of care arrangement that households use varies by household income and that families with lower incomes are less likely to have care and less likely to pay for care; and when they do pay for care, they pay less. Finally, we find there are substantial differences in the types and costs of care used in different places in the Seventh District. Detroit and Iowa have distinct care profiles, with care provided by relatives more common in Detroit and facility-based care more common in Iowa. Costs also vary by location, and costs in Chicago are higher than in other parts of the Seventh District.
Notes
1 The Census Bureau did some analysis of responses to the childcare questions for four of these nine weeks.
2 The Census Pulse asks about gender at birth and current gender identity. We include only those respondents who currently identify as female.
3 Although many of the questions are at the household level, we do not know the employment status of all adults in the household, only of the respondent who is asked, “In the last 7 days, did you do ANY work for either pay or profit?” Note that just under two-thirds of the households that only have kids under five have only one child in the household.
4 The data source provides information on eight types of care arrangements (including none), which we group into the five categories we show in figure 1. In particular, “childcare facility” is the combination of care at a childcare or day care center, at a nursery school or preschool, and before care, after care, and summer camp. Among our sample and within this category, about 70% is center-based, 27% nursery school or preschool, and 3% before care, aftercare, or summer camp in the U.S. Other nonrelative care is the combination of nonrelative care and family day care. Among our sample and within this category, about 68% is nonrelative care and 32% is family day care in the U.S.
5 If we expand to the seven care arrangements in the survey (excluding none—listed in footnote 4), the share of households using more than one type only increases by a small amount, indicating that most care combinations are across our four categories rather than within them.
6 About 70% of households that only have kids under five and only one type of care only have one kid. Because care prices often depend on the number of children, this is the cleanest way to get a sense of costs.
7 The cost of care variable appears to be top-coded at $1,000 per week because no household reports paying more than $1,000. About 7% of paying households report a cost of $1,000. We do not adjust for this top-coding.
8 The survey asks the respondent to select an interval (e.g., $35,000–$49,999) for total household pre-tax income in 2021. We group the eight categories into four for the figures.
9 All of these differences are statistically significant at the 5% level.
10 These differences are statistically significant at the 5% level.


