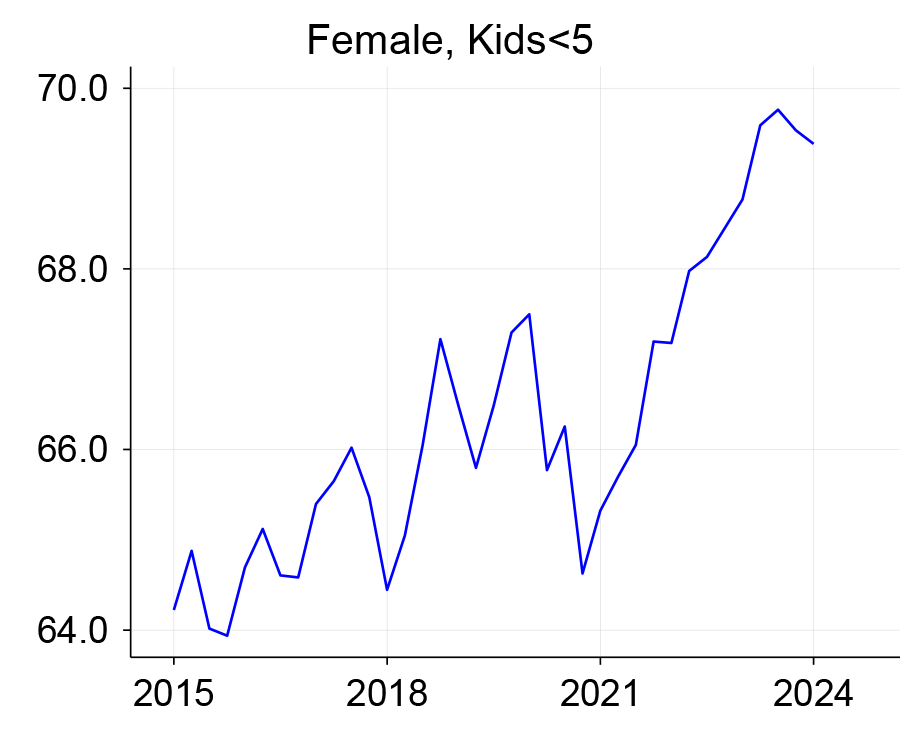
As part of our Spotlight on Childcare and the Labor Market, a targeted effort to understand how access to childcare can affect employment and the economy, this article documents a striking change in the American labor market: The labor force participation rate for women is higher than it was prior to the pandemic. Most strikingly, women with young children at home, those most in need of childcare, have experienced the largest increases in labor force participation. In contrast, the labor force participation rate of men and the overall labor force participation rate are still below their pre-pandemic levels. Among women with young children, college-educated women have experienced the largest increases in labor market participation.
In this article, we discuss several possible explanations for the increase in the labor force participation rate of women with young children: increases in part-time and flexible-hours work, the ability to work from home, fertility delays, and more help with childcare from men and retired grandparents. We find suggestive evidence for the last three of these four explanations.
We conclude by showing that the increase in labor force participation for women with young children holds in four of the five states within the Federal Reserve Bank of Chicago’s Seventh District—Iowa, Illinois, Indiana, and Michigan. The exception is Wisconsin, where the labor force participation rate for women with young children remains below its pre-pandemic level.
Labor force participation among women with young children
The labor force participation rate for a population group is the fraction of the group’s population either working or actively looking for work. It is a standard indicator of the evolution of the labor supply. We use the monthly Current Population Survey (CPS) to estimate the labor force participation rate for different groups and report quarterly seasonally adjusted averages.1 Our focus is on women between the ages of 25 and 54 with children at home.
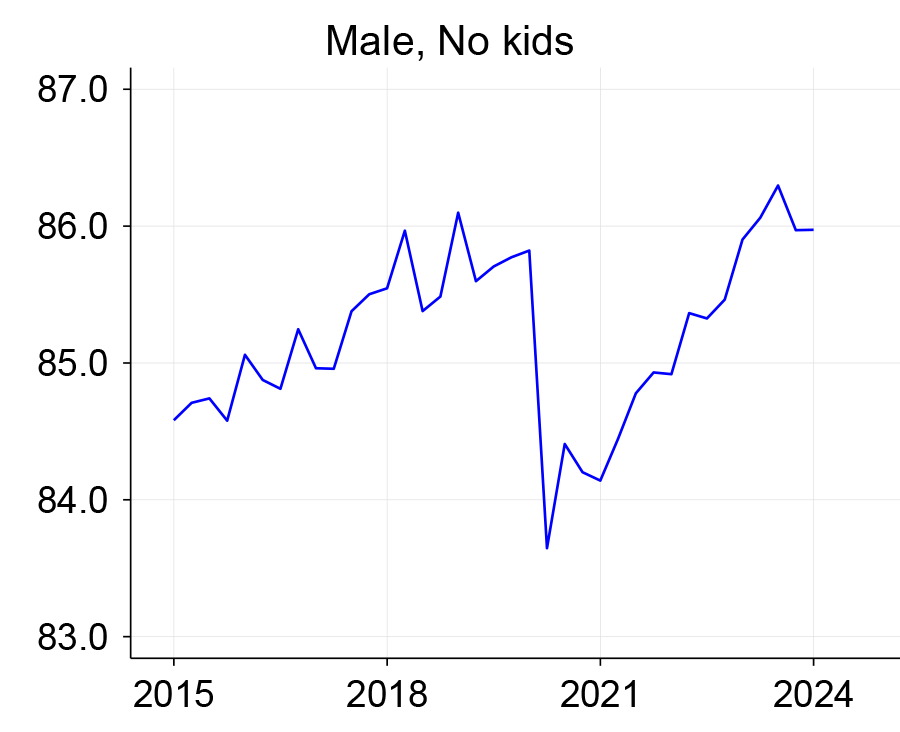
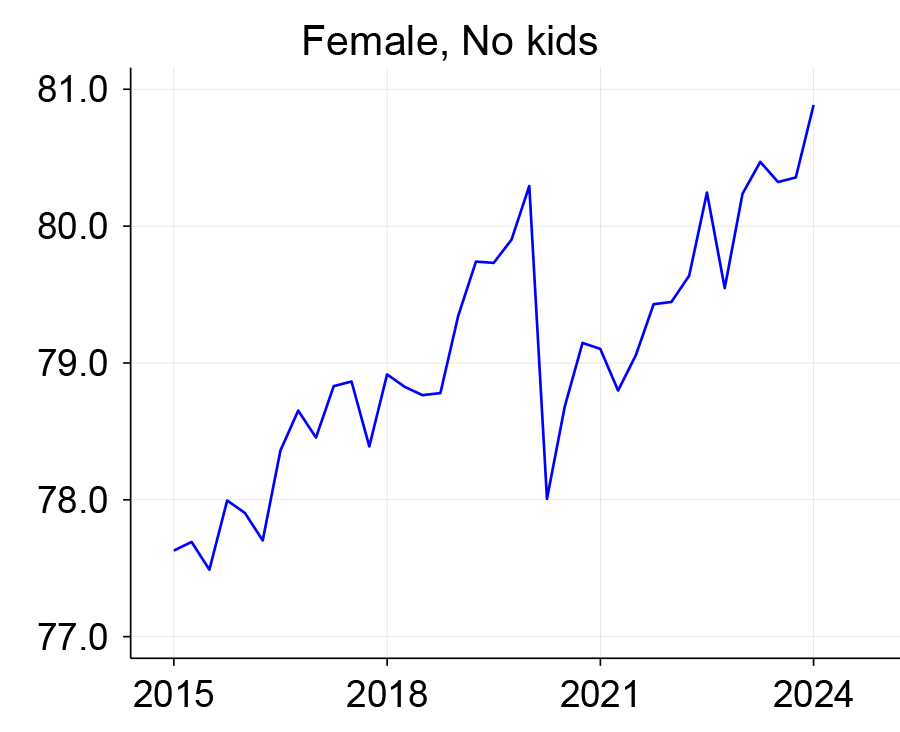
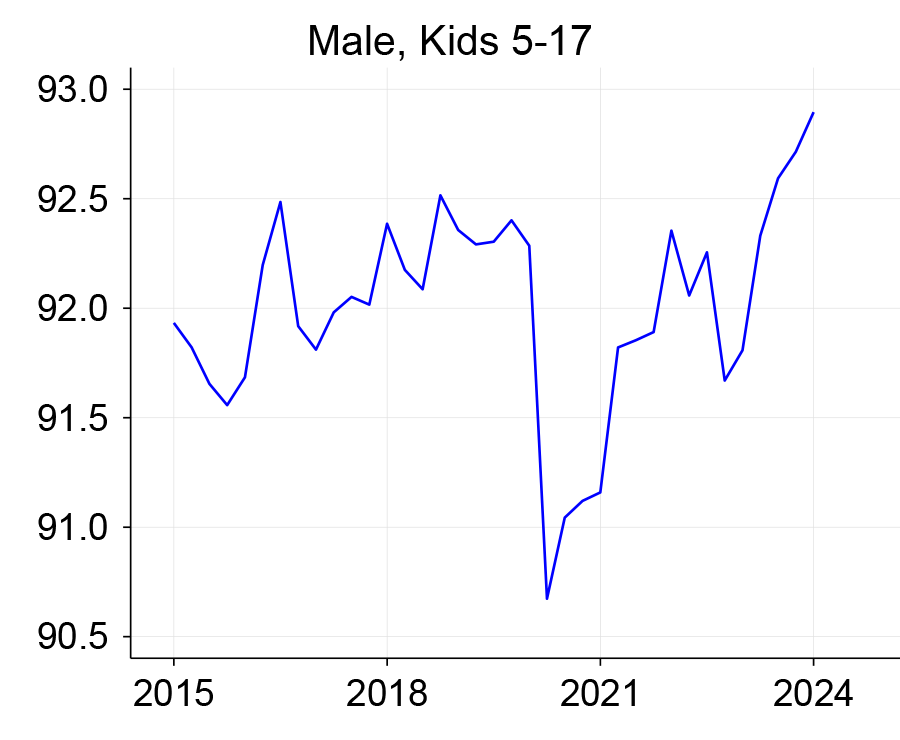
The post-pandemic economy has seen large changes in the American labor market. Among the most striking changes, the labor force participation rate of women between the ages of 25 and 54 fell sharply in the pandemic but has recovered quickly to above its pre-pandemic level. Most strikingly, women with young children at home, those most in need of childcare, have experienced the largest increase in labor force participation relative to their pre-pandemic level. In contrast, the labor force participation rate among men between the ages of 25 and 54 and the overall participation rate for this age group are still below their pre-pandemic levels. We illustrate these trends in figure 1.
1. Labor force participation rate, 25–54 year olds

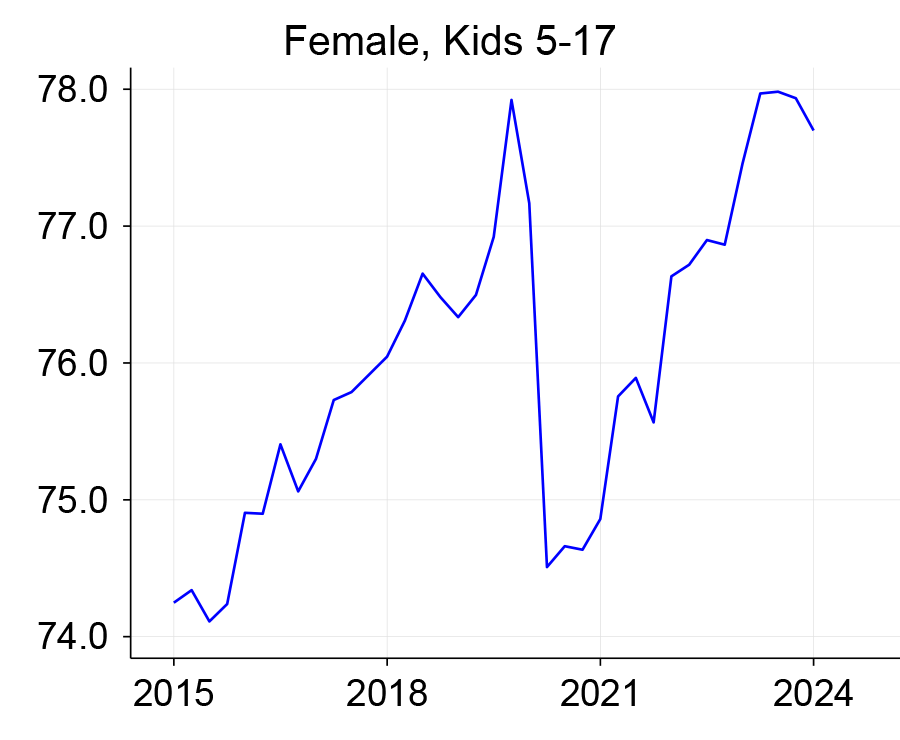
Among women with young children, college-educated women are the ones increasing their labor market participation the most.
In figure 2, we compare the evolution of the participation rate since the pandemic between two sub-groups: women with less than a college degree and women with a college degree or more. Although the participation rate of the group with less education did recover from its pandemic fall (panel A), it is now just back to its pre-pandemic level. The participation rate of women with more education, in contrast, has recovered very fast, from 74% to 80%, and is now well above its pre-pandemic level (panel B). It appears that the women with more educational attainment are the ones increasing their labor market participation the most.
2. Labor force participation rate among 25–54 years old women, by educational attainment
A. Some college or less
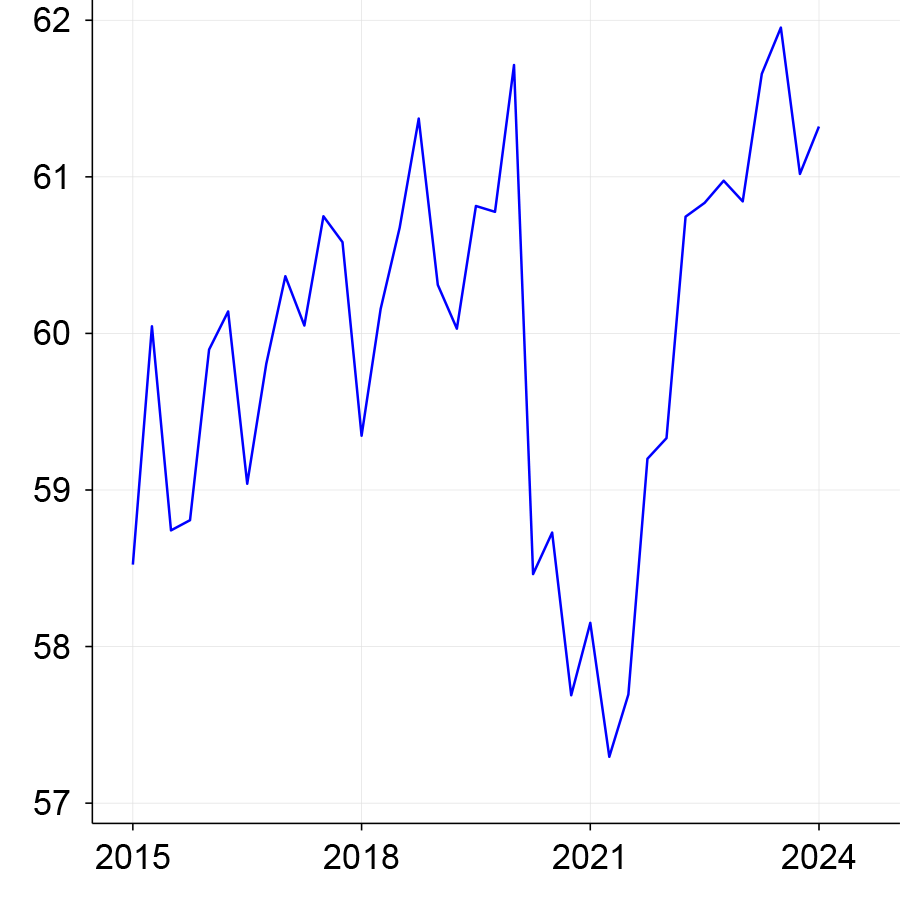
B. College or more
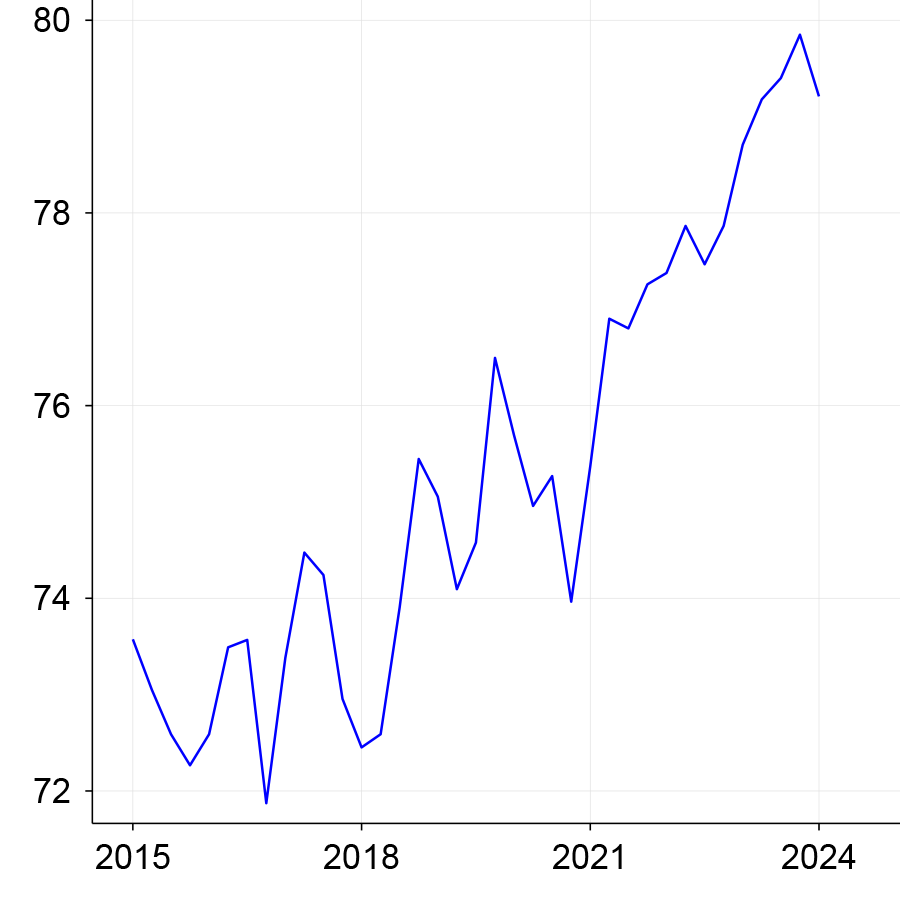
Post-pandemic, non-White women’s labor force participation has recovered fast.
In figure 3, we then compare labor force participation between White and non-White women. While the pandemic hit the participation of non-White women much more sharply, its recovery has been fast (panel B). Today, the participation rate for both sub-groups is around 2 percentage points above what it was before the pandemic.2
3. Labor force participation rate among 25–54 years old women, by White/non-White
A. White
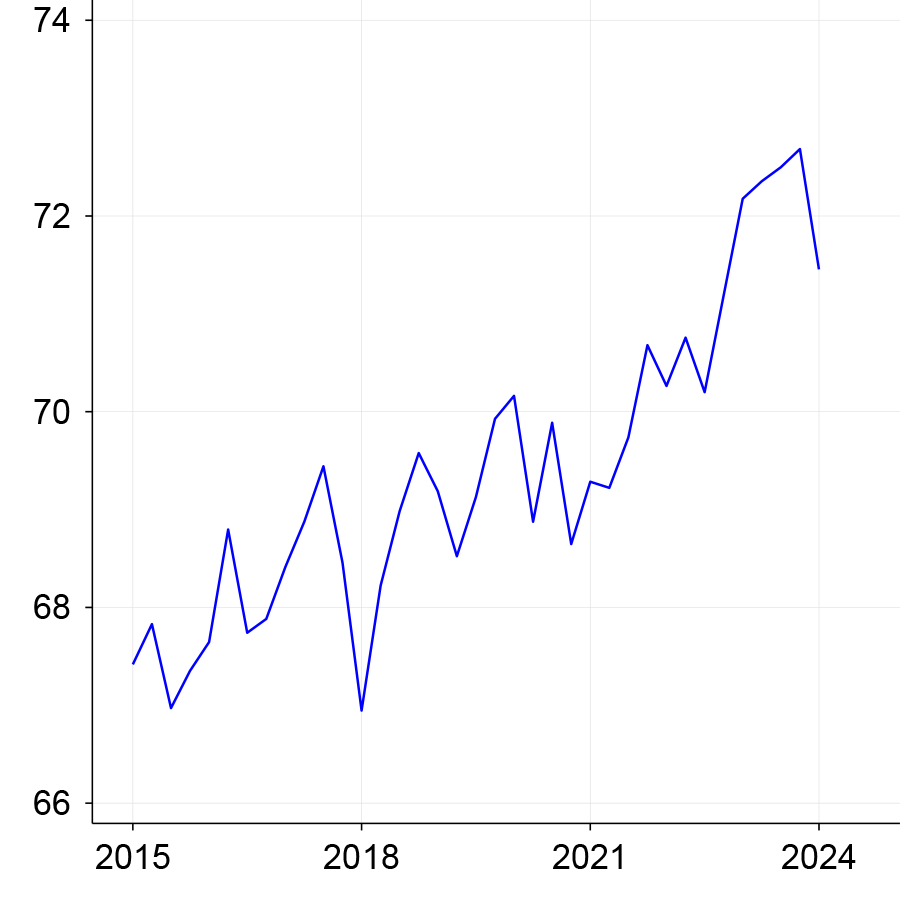
B. Non-White
Because women with young kids are working more hours, an increase in part-time or flexible-hours jobs does not appear to explain the increase in female labor force participation.
The sharp rise in female labor force participation since the pandemic tells us that a growing share of women—especially those with young kids who most require childcare—are participating in the labor market. How are they managing? The increasing prevalence of flexible work arrangements raises the possibility that part-time jobs or jobs with flexible hours account for a good part of the rise in female participation. This would be the case if some of the fixed costs of participating in the labor market, for example, commuting costs—which may have been a barrier for some parents joining the labor force—are now less important thanks to the rise of those flexible arrangements. If this is the case, we would expect to see a fall in the average hours worked by women, as the pool of female workers would include more part-time and flexible-hours workers.
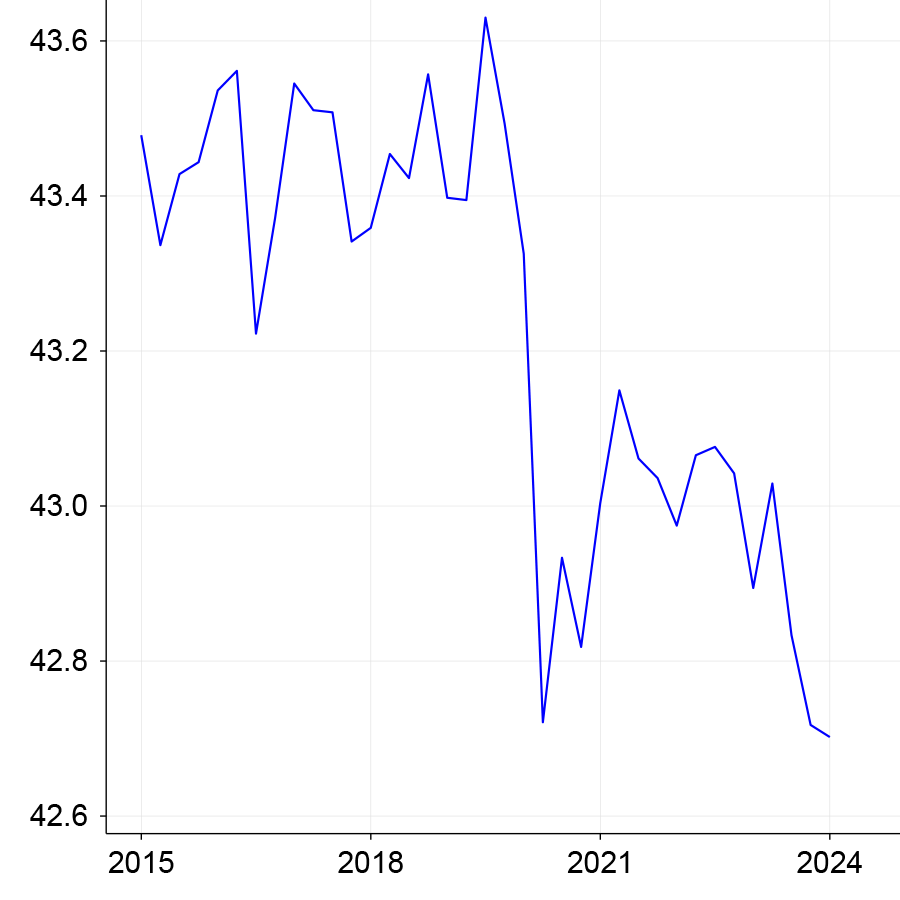
However, the evolution of average weekly hours worked among women 25–54 years old does not suggest that their increased labor force participation has been the result of part-time employment or more flexible hours. Among women in this age range with or without children, average hours worked have been trending up since 2010. And although the pandemic generated some disruption, work hours did not fall. In panel A of figure 4, we zoom into the evolution of the average weekly hours worked for 25–54 year old women with young kids (youngest kid below the age of five). Surprisingly, average hours worked among women with young kids jumped up in 2020; and this measure has remained at a higher level, although it has fallen off a bit in the past few quarters. In contrast, average hours worked among men with young kids and in the same age range fell sharply with the pandemic and have remained lower by around half an hour a week since (figure 4, panel B). These patterns suggest an increased potential availability of fathers’ time to provide childcare.
4. Average usual weekly hours of work among the 25–54 years old employed
A. Female, kids<5
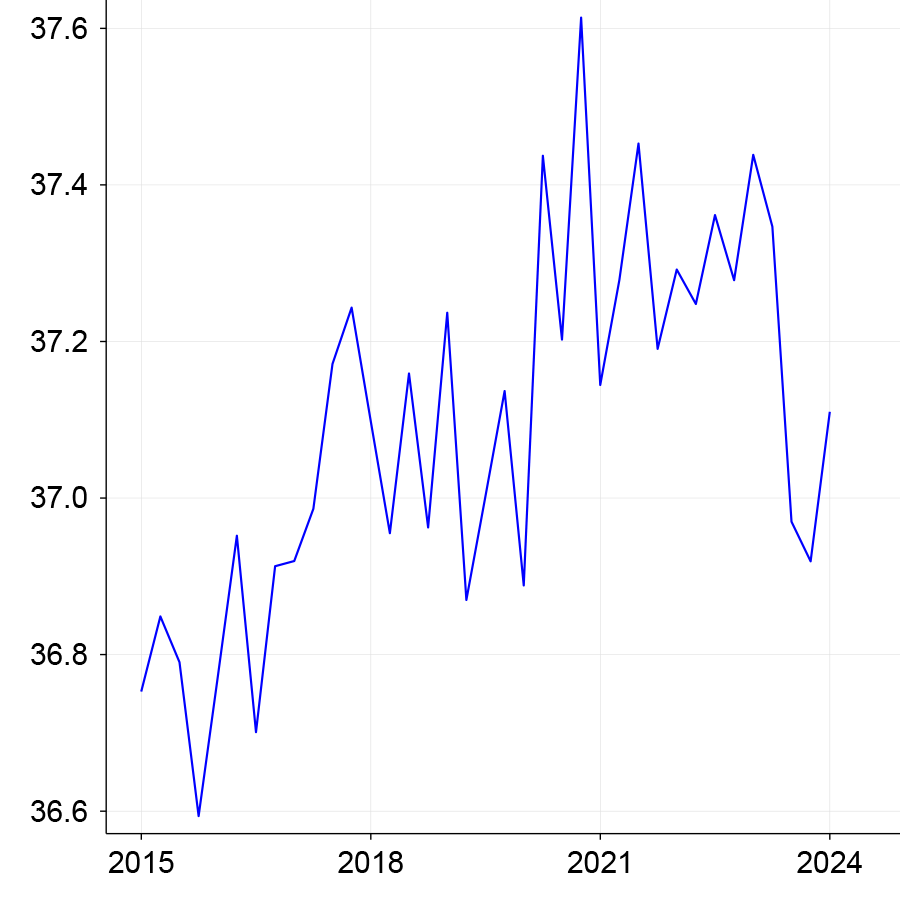
B. Male, kids<5
Work-from-home trends can explain some of the increase in labor force participation and work hours among college-educated women.
To examine whether an increase in the ability to work from home can help explain the increase in labor force participation and hours for women with young children, figure 5 plots the evolution of average hours worked separately for women with less than a college degree (panel A), and those with a college degree or more (panel B). It illustrates that the level jump in hours worked post-pandemic is all concentrated among women with the higher level of educational attainment. Part of this increase may be about college-educated women taking advantage of the very tight post-pandemic labor market and of work-from-home opportunities.
5. Average usual weekly hours worked among 25–54 years old employed women, by educational attainment
A. Less than completed college
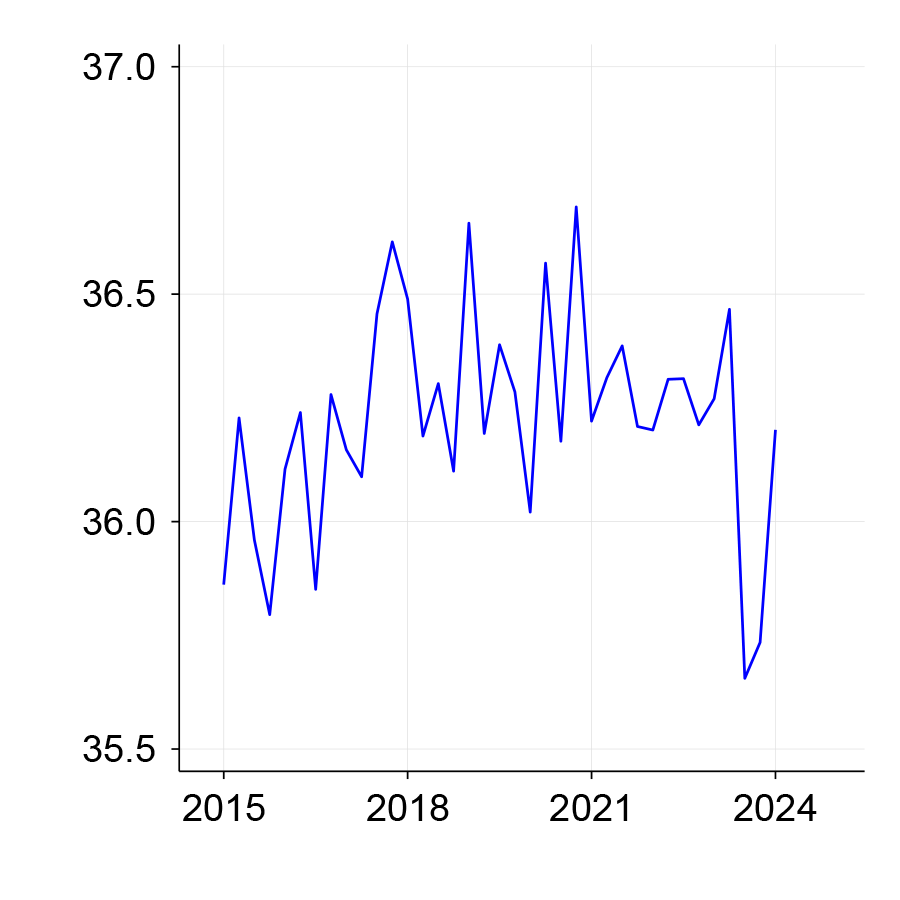
B. College or more

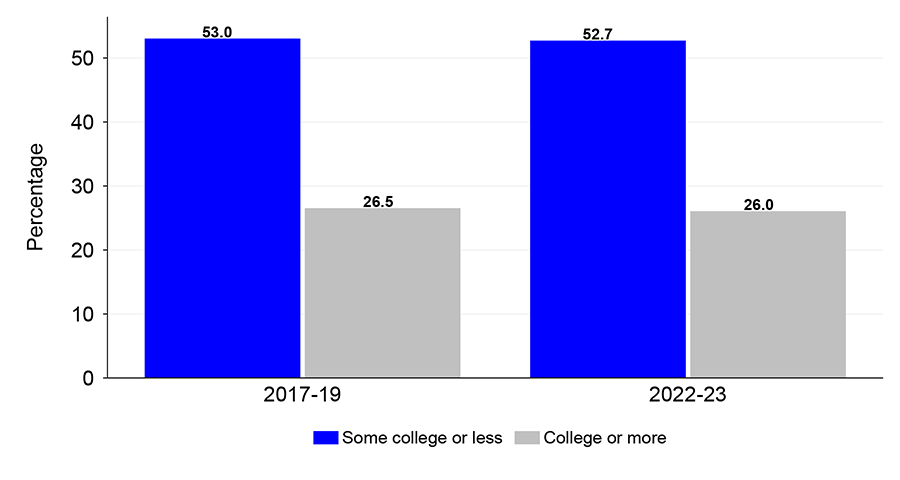
We use a “work-from-home friendly” (WFH-friendly) classification of occupations to evaluate whether work-from-home opportunities may be behind the increased work hours of college-educated women. In figure 6, we compare the share of female employment in “non-WFH-friendly” occupations for women with and without a college degree. While these shares were almost identical before and after the pandemic, non-college-educated women are much more likely to work in occupations that are not WFH-friendly (53%) than women with a college degree (26%). Thus, a much larger share of college-educated women with young children are in jobs where it is easier to take advantage of the increasing use of WFH and hybrid work arrangements post-pandemic.
The composition of employment between jobs that are more or less amenable to working from home has not changed substantially. As a result, changes in this composition cannot account for the sharper increase in labor force participation of college-educated women compared to women with lower educational attainment. However, part of the observed increase in labor force participation and hours of women with young kids could be accounted for by an increased intensity of work from home and hybrid arrangements in those work-from-home friendly occupations.
6. Percentage of employment among 25–54 years old women with young kids in non-WFH-friendly occupations
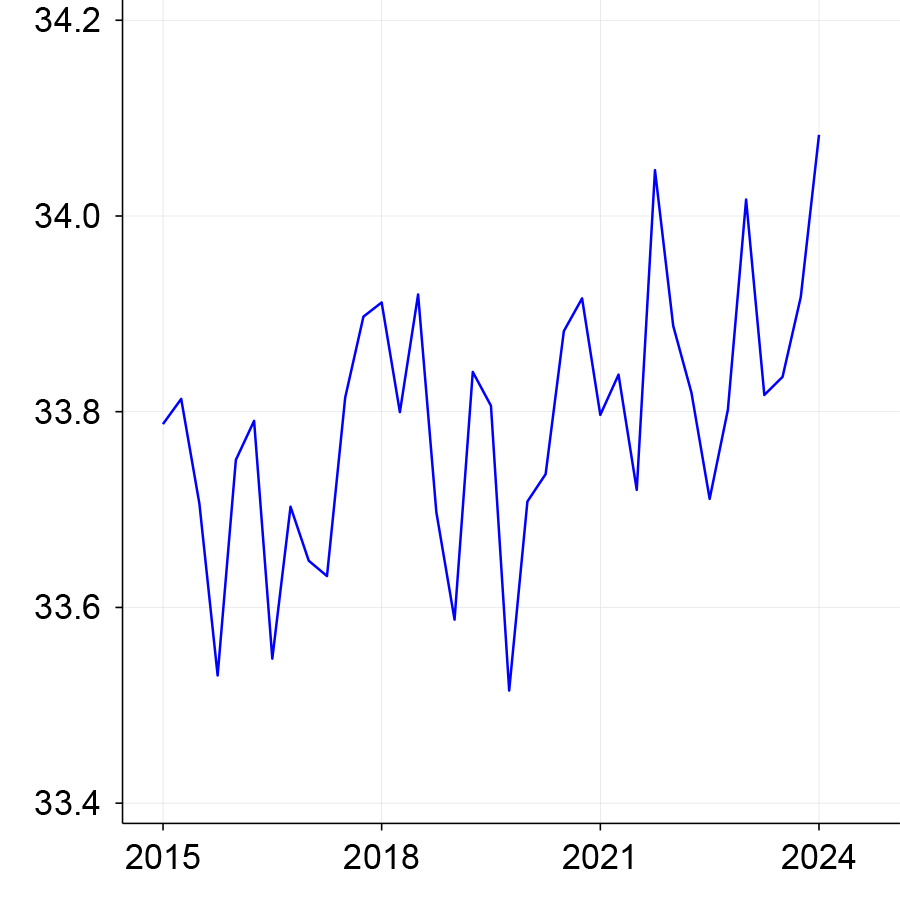
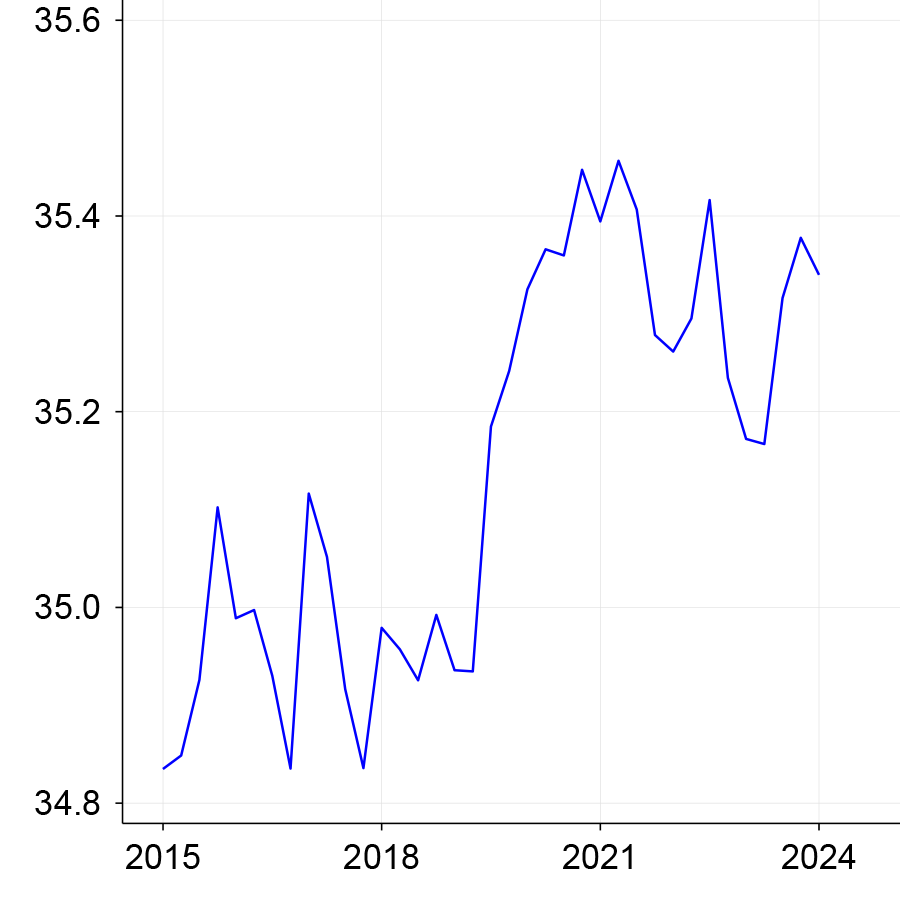
Part of the increase in both labor force participation and in hours worked for women with young kids could simply reflect changes in the composition of this group. In fact, when we look at their age composition, we see a large increase (of around half a year) in the average age of women with young kids and more than college compared to the pre-pandemic period (see panel B of figure 7). Fertility delays related to the pandemic crisis could explain the aging of the group of women with young kids. Because older women in the 25–54 range tend to work more, delayed fertility can directly raise the measured participation and average hours worked for the group. The increase in the participation rate of college-educated women, however, is too large to be accounted for only by this compositional change. The average age of women with young kids and less than a college degree, in contrast, has not changed as much post pandemic (see panel A of figure 7).
7. Average age of working women, 25–54, by educational attainment
A. Less than completed college
B. College or more
Could increased childcare from men and grandparents help explain the increase in labor force participation and hours?
Figure 4 (panel B) shows that hours worked for men were hit particularly hard with the pandemic and have not recovered. Indeed, they had been trending down for years. It may be worth investigating whether this reduction in men’s hours has been increasingly allocated toward childcare, in part explaining the ability of women with young kids to increase their hours and labor force participation post pandemic. Another possibility is that the pandemic led to more inter-generational household formation, and mothers are relying more heavily on childcare support from their parents. Two suggestive pieces of evidence consistent with these ideas are the fall and lack of recovery of the labor force participation of older adults after the pandemic and the recent (post-pandemic) downward trend in the share of households with a female head (not shown), suggesting a higher fraction of households with other adults present, such as partners or grandparents.
The Seventh District
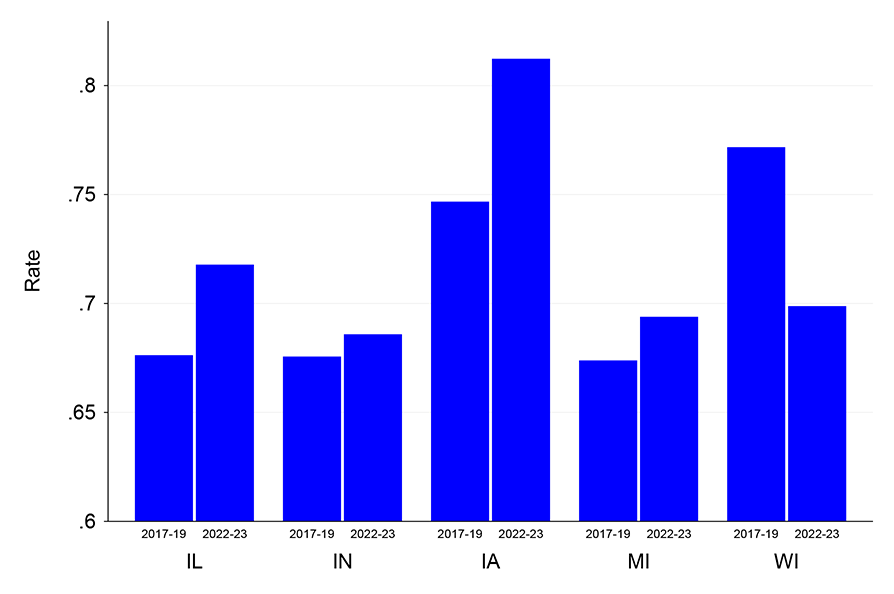
The increase in labor force participation we documented above among all 25–54 year-old women with young children also shows up in four of the five states that compose the Seventh District. In figure 8, we report participation rates for the five states, before and after the pandemic. Iowa shows the largest increase. In contrast, participation of women in Wisconsin has been atypical: It is lower today than in the two years prior to the pandemic.
8. Labor force participation rate among 25–54 year old women with young kids, by state
Conclusion
The U.S. labor market has seen large changes in the aftermath of the Covid-19 pandemic. Among the striking changes, the labor force participation rate for women between the ages of 25 and 54 is higher than it was prior to the pandemic. Most strikingly, women with young children at home, those most in need of childcare, have experienced the largest gain in participation relative to pre-pandemic levels. Moreover, they are also working more hours. On the one hand, the increase in participation and work intensity for this group, and especially for those with a college degree or more, has likely been boosted by the increasing flexibility in work arrangements (e.g., WFH and hybrid arrangements) for the most WFH-friendly occupations. On the other hand, for women who do not have a college degree or the option of working from home, help from other household members might have played a bigger role in sustaining their participation. Family support and flexible work notwithstanding, childcare remains a challenge for millions of working parents of young children, as well as for employers whose current and potential employees are parents of young children (Longworth, Walstrum, and Lavelle, 2024). Consistent with our findings, another study from our Spotlight on Childcare and the Labor Market finds that for households with working women and young children, care from relatives and care at childcare facilities are the most common types of childcare arrangements both nationally and in the Seventh District. Therefore, whether the recent progress in participation is sustainable would depend on how the childcare market and policy concerning it makes childcare easier to access and more affordable.
We thank Ross Cole and Nathan Anderson for their help and suggestions.
Parents and the Labor Force
See data on parents in the labor force and what parents say about how childcare affects their work.
Learn MoreNotes
1 We accessed the CPS data through IPUMS CPS.
2 It is also the case that within the sub-groups defined by educational attainment form figure 2 and by race from figure 3, women with young children have increased their labor force participation the most (in line with the patterns from figure 1). Those sub-groups are smaller, however, so the trends are noisier.


