

In many ways, people's lives have returned to the way they were before the pandemic. However, the rise of remote work appears to be one lasting change. In this article, we update a Midwest Economy post from August 2021, and show that across all sectors, many firms have a higher level of remote work than before the pandemic. Our results come from the Chicago Fed Survey of Economic Conditions (CFSEC), in which we asked about remote work from July 2021 through March 2024.
CFSEC respondents are business, nonprofit, and government leaders from a wide range of sectors across the Seventh Federal Reserve District, as shown in figure 1. While the CFSEC is not a representative sample of employers in the Seventh District, aggregate results from a survey question on economic activity have been shown to track the macroeconomy quite well. For the results that follow, we split respondents by whether or not their industry has a large share of occupations for which remote work is possible based on research by Dingel and Neiman.1 We classify an industry as “high-teleworkable” if at least 40% of its jobs can be done remotely; otherwise, we classify an industry as “low-teleworkable.”2
1. Distribution of CFSEC respondents’ industries
| Sector | Share of responses (%) |
|---|---|
| High-teleworkable sectors | 37.3 |
| Finance and insurance | 13.4 |
| Information | 0.4 |
| Professional, scientific, and technical services | 13.4 |
| Real estate and rental and leasing | 5.0 |
| Wholesale trade | 5.1 |
| Low-teleworkable sectors | 62.7 |
| Administrative and support services | 0.8 |
| Construction | 4.9 |
| Education and health services | 4.2 |
| Government | 7.7 |
| Leisure and hospitality | 1.4 |
| Manufacturing | 35.2 |
| Natural resources and mining | 0.1 |
| Other services | 4.6 |
| Retail trade, transportation, and utilities | 3.6 |
Source: Authors’ calculations based on data from the Federal Reserve Bank of Chicago, Chicago Fed Survey of Economic Conditions.
In early July 2021, we started asking CFSEC respondents to estimate the share of the workforce at their organizations that currently works remotely four or more days per week (which is how we define remote worker in this article). The July 2021 survey also asked respondents about remote worker shares in each quarter since the beginning of the pandemic in the U.S. (i.e., from the second quarter of 2020 onward), as well as for the share prior to the pandemic.3 Figure 2 displays the distribution of CFSEC responses by high- and low-teleworkable sector groups (in panels A and B, respectively) and by date (in each panel). In each panel of figure 2, the navy dots represent the CFSEC’s median remote worker share and the navy vertical lines with caps show its 25th to 75th percentile range of the remote worker share. As a reference, we also include in figure 2 data from the U.S. Survey of Working Arrangements and Attitudes (SWAA), which was first fielded in May 2020 and reports national teleworking patterns on a monthly basis.4 While respondents to the SWAA are workers rather than organization leaders, we can calculate a related measure: the share of respondents who telework at least 80% of the time.
Figure 2 shows that the there was a surge in telework at the onset of the pandemic. Prior to the pandemic, most organizations in both high- and low-teleworkable industries reported that only a small percentage of their employees worked remotely. However, the CFSEC indicates that in the second quarter of 2020, the median share of remote workers for high-teleworkable sectors increased to 80% and this share for low-teleworkable sectors increased to 25%. While nearly all industries experienced a large increase in their share of remote workers, our results make clear that the size of the increase depended strongly on whether the industry had a sizable share of occupations for which remote work is possible.
As workers and employers adjusted to life with Covid-19 and its effect on the economy waned, remote worker shares started falling in both the CFSEC and SWAA. By mid-2022, the proportion of employees who telework had largely stabilized, suggesting a lasting shift in the prevalence of remote work. The CFSEC results indicate that in high-teleworkable sectors, the median share of remote workers remains 15 percentage points higher than the pre-pandemic level, while in low-teleworkable sectors, firms have had most of their employees return to fully in-person work. Interestingly, the share of people who work remotely in low-teleworkable sectors is much higher in the SWAA than in the CFSEC. This is likely because of differences in sample composition and in how telework is measured. The SWAA is national and directly polls individuals about their jobs, while the CFSEC covers only the Seventh Federal Reserve District and relies on respondents’ estimates of the share of remote workers for the entirety of an organization.
2. Share of workforce working remotely four or more days per week: CFSEC versus SWAA
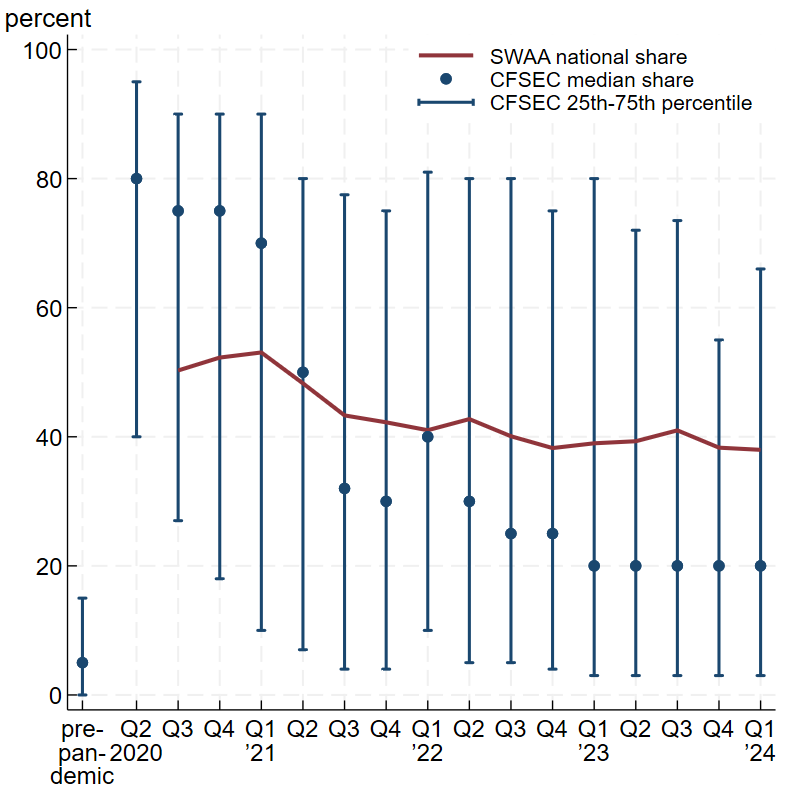
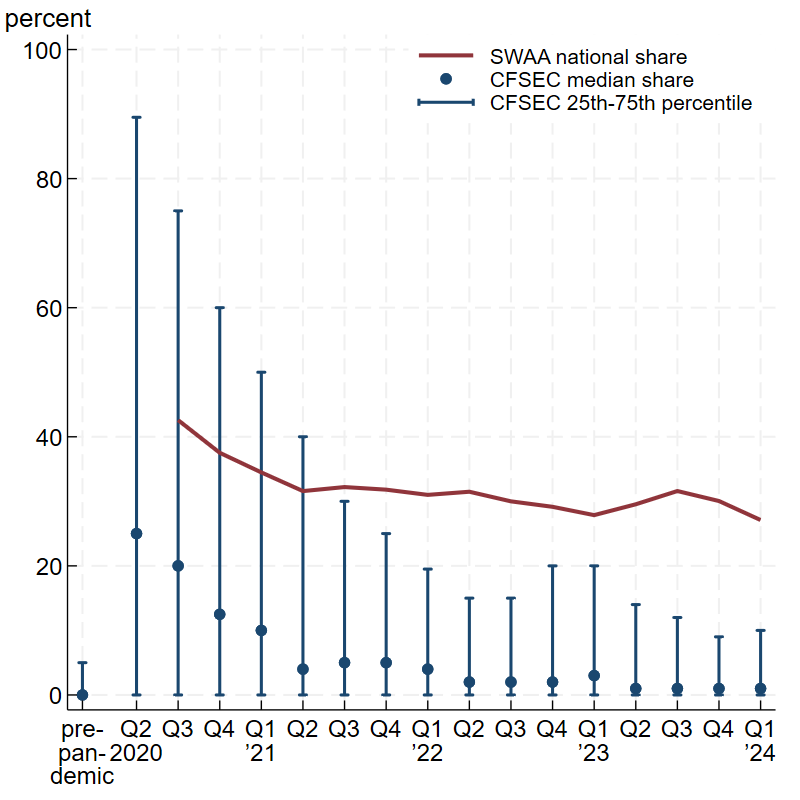
Sources: Authors’ calculations based on data from the Federal Reserve Bank of Chicago, Chicago Fed Survey of Economic Conditions, and the U.S. Survey of Working Arrangements and Attitudes.
Conclusion
The results from both the CFSEC and SWAA suggest that the pandemic has had a long-lasting impact on where people work. While most employees across high- and low-teleworkable sectors still commute to a work site at least one day per week, many firms are maintaining a higher level of remote work than prior to the pandemic. There is still much to learn about how remote work affects job satisfaction, productivity, and the demand for office space, but higher rates of remote work seem to be here to stay.
Notes
1 Jonathan I. Dingel and Brent Neiman, 2020, “How many jobs can be done at home?,” Journal of Public Economics, Vol. 189, article 104235. Crossref
2 Although Dingel and Neiman (2020) found that most education jobs are remote-capable, we classify education as a low-teleworkable sector because many teaching jobs swiftly returned to being done in person. This happened because of learning loss from virtual instruction, along with other factors.
3 Some of the results from that special July 2021 survey are discussed in the Midwest Economy post from August 2021.
4 The SWAA was developed by Barrero, Bloom, and Davis; see Jose Maria Barrero, Nicholas Bloom, and Steven J. Davis, 2021, “Why working from home will stick,” National Bureau of Economic Research, working paper, No. 28731, April, Crossref


