There are about 60 million adults in the United States between the ages of 25 and 54 who live with at least one child under 18 years old. Roughly 50 million of these parents are in the labor force—either employed or actively seeking work—and they represent about 30% of the total U.S. labor force and nearly half of the labor force between the ages 25 to 54. As part of our Spotlight on Childcare and the Labor Market, a targeted effort to understand how access to childcare can affect employment and the economy, we examine these parents’ responses to questions in the U.S. Census Bureau’s Current Population Survey (CPS) that ask them, if they are not in the labor force, the main reason they are not seeking a job, and if they are in the labor force, the main reason they work part-time rather than full-time, or the main reason they missed work in the past week, if they are employed but did not work. Collectively we refer to parents citing childcare problems as the main reason for any of these outcomes as “childcare affected.” We use parents’ responses—for two-year periods before, during, and after the peak of the Covid-19 pandemic—to estimate the number of childcare-affected parents in the United States. We show what these estimates imply about the size of the effects of childcare problems on parents’ labor force participation rate and hours worked.
Our analysis generates the following key results:
- Mothers living with a child under five are more than twice as likely to be childcare affected than mothers living with children five and older and fathers living with children of any age.
- The number of childcare-affected parents was 19% higher during the two years between April 2022 and March 2024 that followed the peak of the Covid-19 pandemic than it was in the two years between April 2018 and March 2020 prior to the pandemic.
- We estimate that if all childcare-affected parents were instead in the labor force, working full-time, and not missing work, the average total hours worked each week by all parents would increase by about 1%.
- About 80% of this increase in hours would come from parents that work part-time rather than full-time due to childcare problems.
- We estimate that if all parents who cite childcare problems as the main reason they are not seeking a job were instead in the labor force (either seeking a job or employed), the labor force participation rate for parents would increase by a relatively small amount (0.17%).
- The estimated effects on hours and labor force participation rates are largest for mothers with children under five.
We use the CPS to identify childcare-affected parents who are not job-seeking, are working part-time rather than full-time, or miss work due to childcare problems.
The CPS is a key source of monthly labor force statistics like the unemployment rate and the labor force participation rate. We use it to examine three aspects of the employment of parents ages 25 through 54:1 job seeking, working part-time, and missing work. All references to parents refer to individuals aged 25–54 who live with at least one child under 18 years old.
For comparisons over time, we define three different periods: Pre-pandemic begins with April 2018 and concludes with March 2020; peak pandemic begins with April 2020 and concludes with March 2022; and post-peak pandemic begins with April 2022 and concludes with March 2024. Each period is two years long and contains results from 24 CPS monthly survey rounds.2 By considering periods of equal length and evenly divisible into years, we hope to minimize the effects of seasonality upon inter-period comparisons.3
We now review the relevant CPS questions and respondents.4
1. Not seeking a job. The respondents are a group of parents who are out of the labor force—neither employed nor actively seeking work—and who answered the question, “Would you like a job?” with “Yes, or maybe.”5 These parents represent about 1.4% of the total parent population in the post-peak pandemic period, 1.9% in the peak pandemic, and 1.2% in the pre-pandemic.6 Each month this is about 790,000 parents pre-pandemic, 1.1 million parents peak pandemic, and 730,000 parents in the post-peak pandemic. The larger group size during the peak-pandemic period corresponds to a dip in labor force participation among parents. Note that parents who respond that they would not like a job are not included in this sample.
These parents receive a follow-up question, “What is the main reason you were not looking for work in the last 4 weeks?”
2. Working part-time rather than full-time. The respondents are a group of parents who typically work part-time and worked fewer than 35 hours during the previous week.7 These parents represent 8.6% of the total parent population in post-peak pandemic period, 8% in the peak pandemic, and 8.8% pre-pandemic. This is equivalent to 5.2 million parents in the pre-pandemic period, 4.6 million in the peak pandemic, and just under 5 million in the post-peak pandemic.8
These parents receive a follow up question, “What is your main reason for working part-time?”
3. Missing work. The respondents are two groups of parents: those that typically work full-time but did not work full-time in the past week and those that typically worked part-time but were completely absent from work in the past week.9 Together, these parents represent 9.2% of the total parent population in the post-peak pandemic period; 9.6% in the peak pandemic, and 7.8% in the pre-pandemic. These percentages correspond to 4.6 million working parents pre-pandemic, 5.5 million peak pandemic, and 5.3 million post-peak pandemic. Within this group, the large majority are full-time workers.10
Here the follow up question depends on whether the parent works full-time or part-time. The parents that typically work full-time receive one of two questions, depending on whether they worked part-time last week or were completely absent from work the past week: “What is your main reason for working part-time?” or “What was the main reason you were absent from work last week?” Parents that typically work part-time are asked only the “absent from work” question.11
Each of these follow-up questions is an open-ended question, and the CPS has a set of harmonized response categories that interviewers use to categorize the responses.12 CPS methodology instructs interviewers to include in the harmonized response category “childcare problems,” any response that specifically mentions childcare as the main reason, and “other family/personal obligations,” all other family-related reasons.13
In the next three sections, we show the share of respondents that are childcare-affected.
Not job-seeking
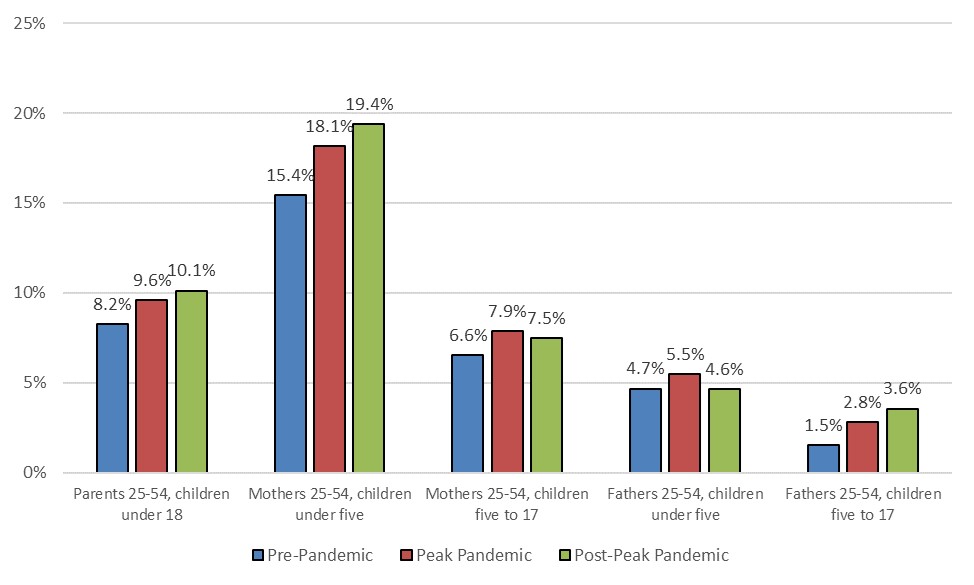
Figure 1 shows that post-pandemic it is more common for parents who are out of the labor force but might want a job to cite childcare problems as the main reason they are not seeking a job. Among these parents, 10.1% cited childcare problems as the main reason they were not seeking a job in this period. This is up from 8.2% pre-pandemic and 9.6% peak pandemic.
1. Share of respondents citing childcare problems as main reason not seeking work
Source: IPUMS CPS, University of Minnesota, www.ipums.org.
Figure 1 shows that mothers of young children are the most likely to cite childcare problems as the main barrier to job-seeking—mothers with their youngest child under five cite childcare problems much more frequently than mothers with only older children and fathers regardless of child age. Mothers with children under five also account for most of the increased reporting of childcare problems as the main barrier to job-seeking: increasing from 15.4% to 19.4% over the three periods.14
All these parents, except for fathers with their youngest child under five, are more likely to cite childcare problems as the main barrier to job seeking post-pandemic than pre-pandemic.15
Part-time
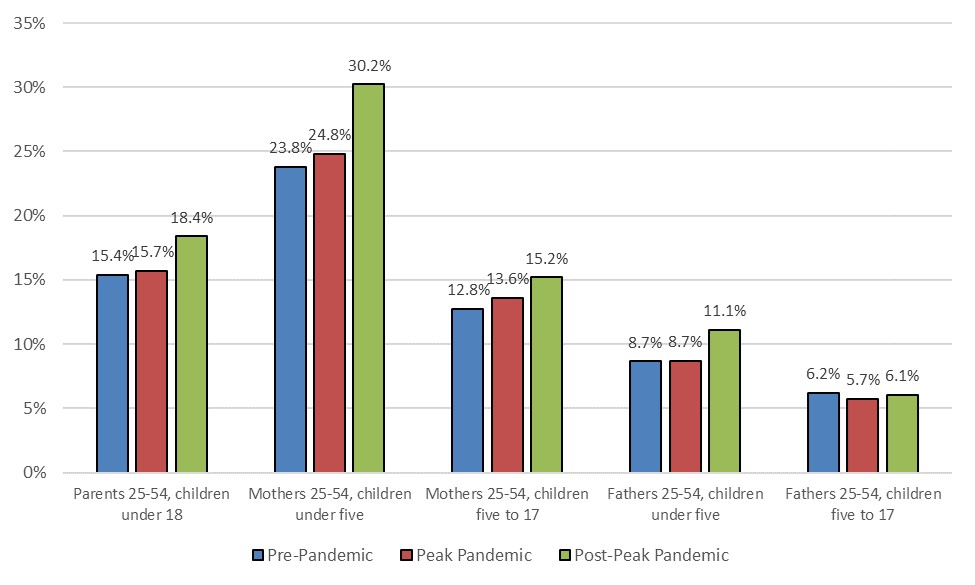
Figure 2 shows that the share of parents citing childcare problems as the main reason they work part-time rather than full-time has increased. Pre-pandemic, this share was about 15.4% and it increased to 18.4% post-peak pandemic.
2. Share of part-time working parents citing childcare problems as main reason not working full-time
Source: IPUMS CPS, University of Minnesota, www.ipums.org.
As with the job-seeking results, childcare problems were cited by mothers of young children as the main reason for part-time work. Mothers of young children are the most likely to cite childcare as the main reason for usual part-time work in all periods, and they cite it increasingly over time. Pre-pandemic, 23.8% of mothers who usually work part-time and have children under five cited childcare problems as the main reason for part-time rather than full-time work. This percentage increased to 30.2% post-peak pandemic.
Mothers of older children are less likely than those with young children to cite childcare problems as the main reason they work part-time rather than full-time. However, during the post-peak pandemic period, a higher share of mothers of older children cite childcare problems, compared with the pre-pandemic period.16 Fathers of young children are less likely to cite childcare problems as the main reason they work part-time than mothers; but the share of these fathers citing childcare problems also increased from pre-pandemic to post-peak pandemic. Fathers of older children are the least likely to cite childcare problems, and the share citing childcare problems was similar across all three periods.
Missed work
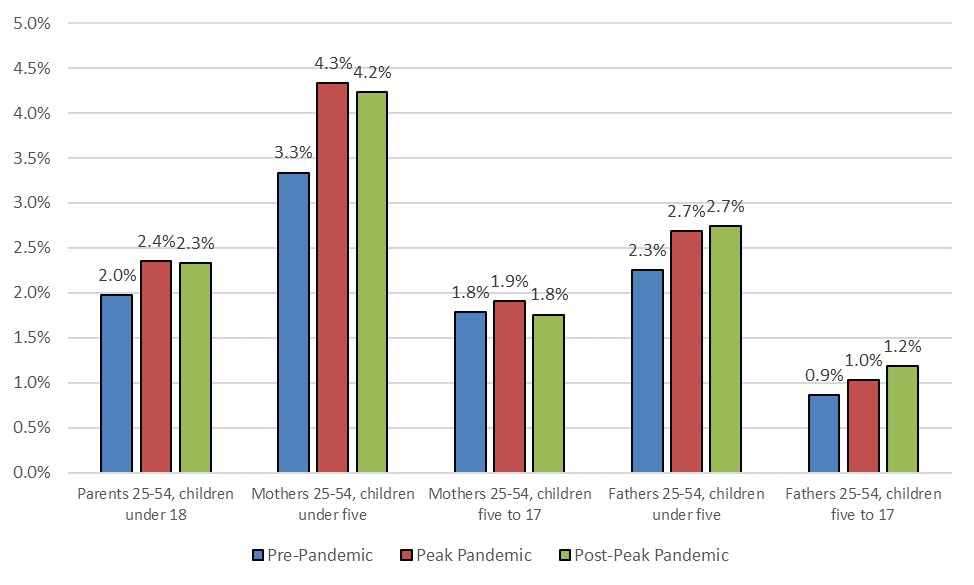
Figure 3 shows that in the post-peak pandemic period, the fraction of working parents that cite childcare problems as the main reason for missing work is roughly 2.3%. This is higher than the shares for the pre-pandemic and peak-pandemic periods.17
3. Share of respondents citing childcare problems as main reason for missing work in past week
Source: IPUMS CPS, University of Minnesota, www.ipums.org.
Again, mothers of young children are the most likely to cite childcare problems as the main reason for missing work. In all periods, mothers with children under five were more likely to cite childcare problems as the main reason for missing work during the prior week; the share rose from 3.4% pre-pandemic to 4.6% peak pandemic, before falling slightly to 4.5% post-peak pandemic. The rates changed little for mothers of older children. Unlike the results for job-seeking and part-time work, child age appears to matter more here than the sex of the parent. In every period, fathers with children under five are more likely to cite childcare problems as the main reason for missing work than mothers of older children.
Estimates of the number of parents experiencing childcare problems as a barrier to work
Next, we summarize the responses in terms of the scope of their impact on parents in the United States.
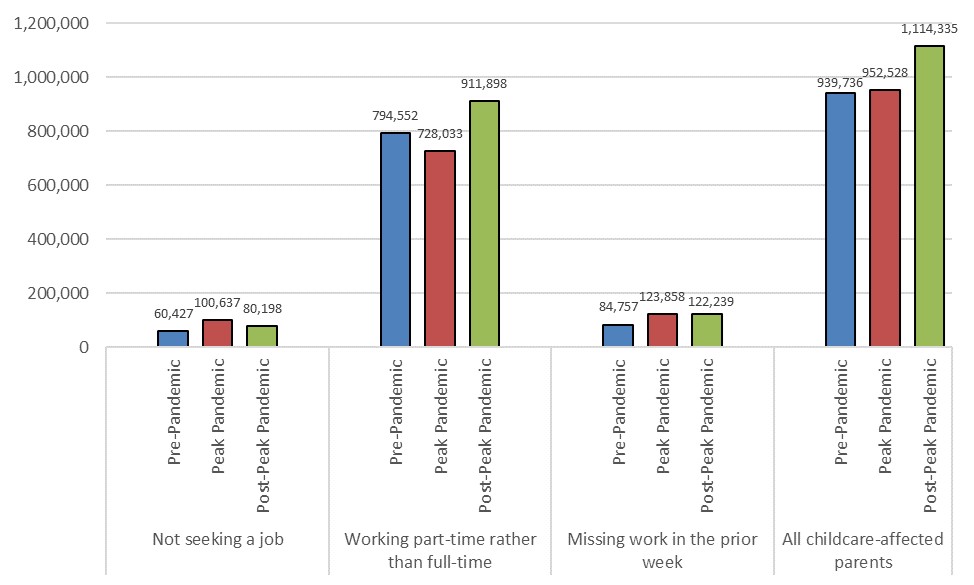
Figure 4 shows estimates of the number of parents that are: 1) not seeking a job, 2) working part-time rather than full-time, or 3) missing work due to childcare problems.18 Our estimates are higher post-peak pandemic for all three outcomes. The figure also shows the sum of our estimates. In each succeeding period, more parents have a childcare-affected work status.19 The number of childcare-affected parents post-peak pandemic is 19% larger than pre-pandemic.
4. Number of childcare-affected parents
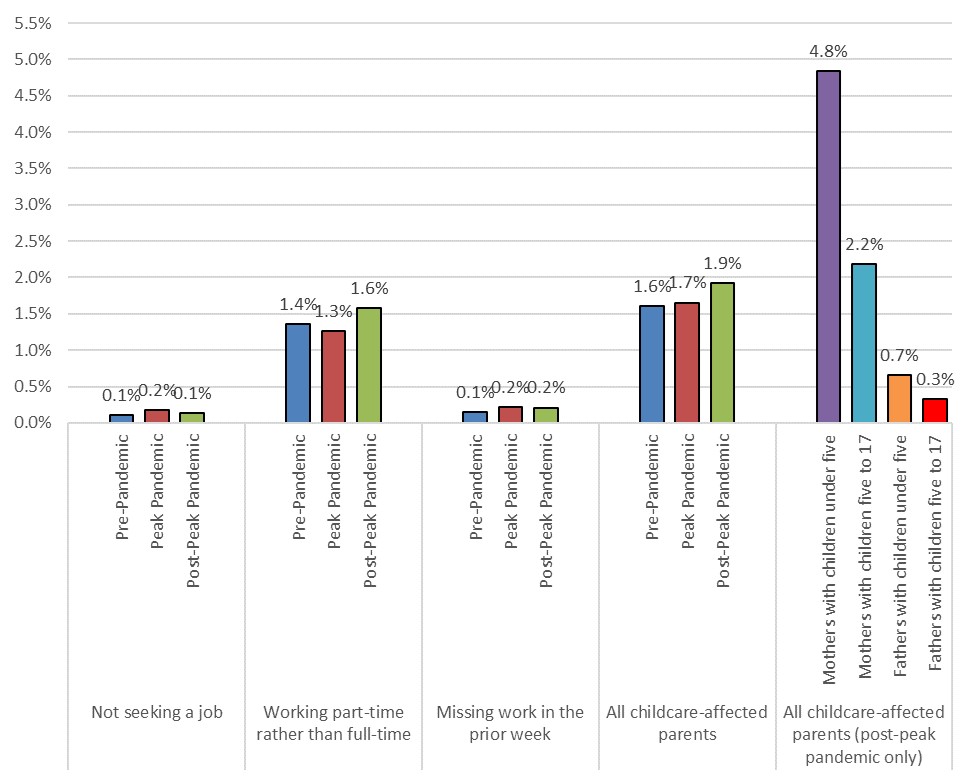
Estimates (shown in figure 5) of the share of parents that are childcare-affected are also increasing over the three periods. Post-peak pandemic, we estimate about one in 60 parents work part-time due to childcare problems, one in 700 are not in the labor force due to childcare problems, and about one in 500 missed work due to childcare problems.
5. Share of parents, 25–54, that are childcare-affected
Source: IPUMS CPS, University of Minnesota, www.ipums.org.
Figure 5 shows that, post-peak pandemic, a larger share of mothers living with a youngest child under five are childcare-affected than are mothers living with older children and fathers living with children of any age. The estimated shares for not job seeking, working part-time rather than full-time, and missing work are all higher for mothers with their youngest child under five (not shown). Post-peak pandemic, one in 25 mothers with children under five work part-time instead of full-time due to childcare problems, one in 250 are not in the labor force due to childcare problems, and about one in 300 missed work due to childcare problems.
Implications for labor force participation and hours worked
We next ask what our estimates imply about the role of childcare problems in limiting labor force participation and hours worked by parents in the post-peak pandemic period.
Labor force participation rate
Not seeking a job due to childcare problems is the only one of our three outcomes that affects labor force participation. We ask how much higher parents’ labor force participation rate would be if all parents who do not look for a job due to childcare problems instead actively looked for a job.20 We find that parents’ labor force participation rate would be 0.14 percentage point higher (0.17%). The labor force participation rate for mothers with children under five would increase by 0.41 percentage points (0.59%).
When compared to recent changes, these hypothetical increases seem relatively small. Garcia-Jimeno and Hu (2024) find that for mothers with children under five, labor force participation has risen about 5 percentage points since the peak pandemic’s nadir, a change in order of magnitude larger than in our hypothetical. Aaronson, Hu, and Rajan (2021) estimated a pandemic impact of 0.7 percentage points on labor force participation among mothers in March through May of 2020.
Hours worked
Childcare problems can affect hours worked through all three outcomes. We ask by how much would post-peak pandemic average hours worked per week increase if all parents who cite childcare problems as the main reason they work part-time rather than full-time instead worked full-time, if all parents who cite childcare problems as the main reason they missed work did not miss work, and if all parents who cite childcare problems as the main reason they do not look for a job instead were in the labor force?
To answer this, we estimate the potential hours that each parent in the post-peak pandemic CPS sample would work in the absence of childcare problems. For parents that are not childcare-affected, their potential hours equal their actual hours. For childcare-affected parents, we calculate their (higher) potential hours as follows.
- For parents who missed work due to childcare problems, their potential hours equal their usual hours when they don’t miss work.
- For parents who work part-time due to childcare problems, their potential hours equal the average hours worked by full-time parents who are not childcare-affected and who have the same basic characteristics as the childcare-affected parent.21 Basic characteristics include education, sex, age, whether there are children under five in the household, marital status and, if married, spouse’s work status.
- For parents who do not job seek due to childcare problems, their potential hours are the same as described above for parents who work part-time, except that the average hours are lower because we include parents that are in the labor force but unemployed and working zero hours.
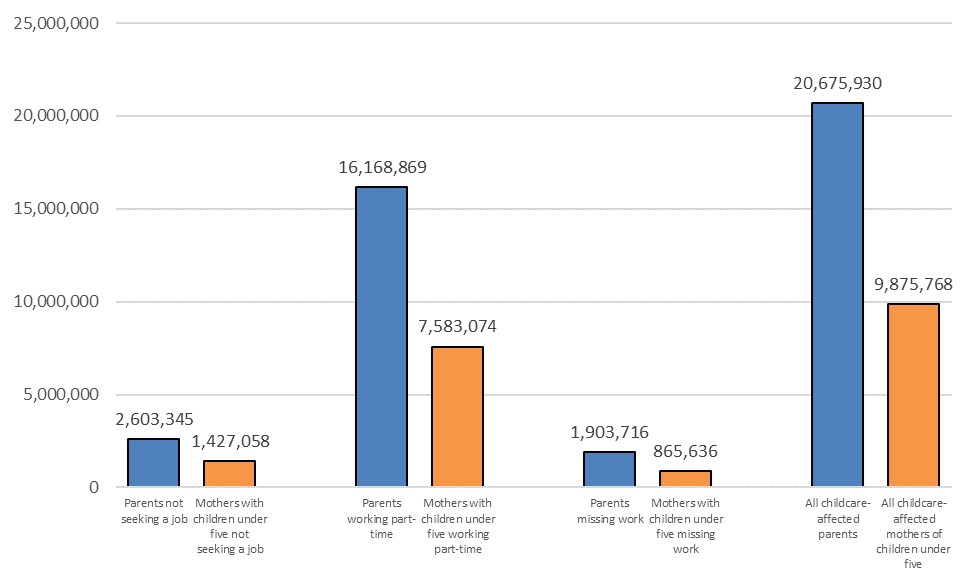
6. Estimated weekly work hours gained if no childcare problems, post-pandemic
Sources: IPUMS CPS, University of Minnesota, www.ipums.org, and authors’ calculations.
In Figure 6 we show the difference between potential hours and actual hours. We find that, in the aggregate, potential hours are more than 20 million hours per week higher than actual hours. Moving from part-time to full-time work creates 80% of this total at 16 million hours. Mothers with children under five would work nearly 10 million additional hours if they were not childcare-affected.
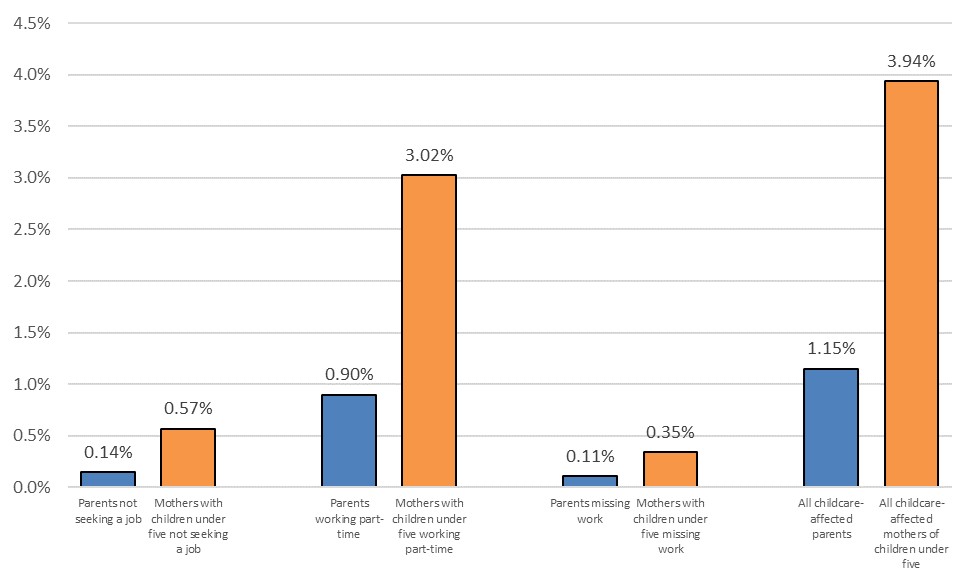
Figure 7 shows these results as a percentage of post-peak pandemic actual hours. Mothers with children under five have an implied increase of 3.94%, while the increase for all parents is 1.15%.
7. Increase in working hours if no childcare problems, post-peak pandemic
Sources: IPUMS CPS, University of Minnesota, www.ipums.org, and authors’ calculations.
For context, total hours worked each week by parents declined by 9% from pre-pandemic to the pandemic period. These results suggest that in the post-peak pandemic period, the working hours reduction due to childcare problems is about 14% of the size of this pandemic decline.
Conclusion
We show that in recent years respondents to the CPS are more likely to cite childcare problems as the main barrier to job-seeking, the main reason for missed work, and the main reason for part-time work than they were prior to the pandemic. Our analysis finds that mothers with children under five disproportionately cite childcare problems as the main barrier to work.
Our estimates suggest that childcare problems have a relatively small effect on the overall labor force participation rate among parents and among mothers of young children, especially when compared to the increase in labor force participation for mothers with children under five over the last few years.
Some have argued that the fact that declines in employment during the peak pandemic were similar between parents and non-parents is evidence that childcare problems are not key drivers of employment, at least during the pandemic. Our analysis is consistent with a small employment effect. We also find, however, that childcare problems have a relatively large impact on employed parents‘ ability to choose full-time rather than part-time work—a distinction that does not affect employment status. We find that without childcare problems, total hours worked by parents could increase by about 1% and by almost 4% for mothers of young children. This potential increase in hours is relatively large, when compared to the 9% reduction in total hours worked by parents aged 25 to 54 from the pre-pandemic period to the peak-pandemic period.
Note: We thank Nate Anderson, Kristin Butcher, Jason Faberman, and Jenni Heissel for helpful comments.
Parents and the Labor Force
See data on parents in the labor force and what parents say about how childcare affects their work.
Learn MoreNotes
1 In the CPS, this age range includes roughly three-fourths of individuals with children under 18 years old living in their household throughout 2018 to 2024.
2 Each month, surveys are conducted during the calendar week including the 19th of the month. References to activity during the prior week will therefore refer to activity during the week that includes the 12th of the month. See the full CPS methodology description online.
3 We chose these periods so that the peak pandemic period begins with the first month for which Covid-19 precautions were widely implemented in the United States for the entire month, with a nationwide emergency declared on March 13, 2020. In addition, all weeks for which the CDC estimated at least 5,000 weekly Covid-related deaths fall within this period, with the final such week concluding on March 5, 2022.
4 The average CPS monthly sample contained responses from 21,387 parents ages 25–54 during the pre-pandemic period; this number declined to 18,200 per month peak pandemic and 17,179 per month post-peak pandemic. Across all monthly samples, the share of responding parents that were fathers with children under five varied from 16% to 18%; the share that were mothers with children under five varied from 19% to 21%; fathers with a youngest child aged five to 17 varied between 26% and 28%; and mothers with a youngest child aged five to 17 varied between 35% and 37%. The overall share of parents with a child under five declined slightly from 38% in the pre-pandemic period to 36% in the post-peak pandemic. Sex ratios remained stable throughout.
5 An average of 254 parents answered this CPS question each month pre-pandemic. During the peak-pandemic period 308 parents answered per month, and post-peak pandemic 220 parents answered per month. For mothers with children under five, these numbers were 77 per month pre-pandemic, 84 per month peak pandemic, and 66 per month post-peak pandemic.
6 We apply final individual weights to the CPS microdata to calculate the number of parents that survey respondents represent in the United States. The shares of the total parent population in this article are all given as shares of all parents ages 25–54, without regard to whether they are in the labor force. On average, there were about 59 million of these parents during the pre-pandemic and 58 million in the peak-pandemic and post-peak-pandemic periods.
7 Pre-pandemic, each month an average of 1,910 parents usually worked part-time and answered this question on the main reason for choosing part-time work. During the peak pandemic, 1,479 parents answered per month; and post-peak pandemic 1,477 answered per month. For mothers with children under five, these numbers were 594 per month pre-pandemic, 435 per month peak pandemic, and 437 per month post-peak pandemic.
8 11.8% of employed parents were working part-time, post-peak pandemic. This is close to the number pre-pandemic, 12.2%, and the peak pandemic number, 11.7%. These are shares of all working parents ages 25–54, which averaged about 47 million during both the pre-pandemic and post-peak pandemic periods, with a decline during the peak pandemic.
9 The number of parents who answered CPS questions on the primary reason for this disruption averaged 1,696 per month pre-pandemic, 1,766 per month peak pandemic, and 1,603 post-peak pandemic. For mothers with children under five, these numbers were 375 per month pre-pandemic, 376 per month peak pandemic, and 347 per month post-peak pandemic.
10 Parents who typically work full-time are about 92% of the work disruption respondent group in all three periods. In comparison, about 88% of all working parents were usually full-time during each period. During the post-peak pandemic 12% of usual full-time working parents missed some work (part-time or absent) the past week; the rate was 10% pre-pandemic, and 13% peak pandemic. In both the pre-pandemic and post-peak pandemic periods, about 7% of parents who typically work part-time did not work during the previous week. During the peak pandemic, this number was 8% instead.
11 Respondents that usually work part-time are asked for a main reason only when they are absent from work (i.e., did not work) and are not asked for a main reason when they work fewer hours but are not absent. For this reason, our analysis will understate missed work by parents that usually work part-time.
12 See examples of harmonized response categories online.
13 See example of CPS instructions to interviewers online.
14 Mothers with children under five made up 30% of parents who are not in the labor force but might want a job post-pandemic, while mothers with children under 18 represented nearly three-quarters of parents who were not in the labor force but might want a job. For the avoidance of doubt, throughout this article we include an adult in a category without regard to marital status. So, for example, mothers living with children under five includes both unmarried and married mothers.
15 Among parents not in the labor force who might want a job, the most frequently cited main barrier to job seeking is “family responsibilities.” Other common main reasons include “couldn’t find any work” and “ill health or physical disability.” During the pre-pandemic period, all of these were more commonly mentioned by parents than “childcare problems” at 39.1%, 9.8%, and 8.4%, respectively. By the post-peak pandemic period, childcare has become the second most frequently cited main barrier (10.1%) after family responsibilities (at 39.3%), with “couldn’t find any work” at 8.7% and “ill health or physical disability” at 8.0%.
16 Childcare problems are the third most cited main reason given by parents for their usual part-time rather than full-time work. The most cited main reason, “other family/personal obligations,” is also much more common among mothers than fathers, with 42.5% of part-time working mothers (7.4% of mothers in the workforce) working part-time due to other family/personal obligations in the post-peak pandemic period, and 17.3% of part-time working fathers (0.7% of fathers in the workforce) working part-time for the same reason during the same period. The second most cited main reason is “full time work week under 35 hours.”
17 Vacation or personal days are by far the most common main reason that working parents cite for missing work in all three periods, with personal illness in second place. Peak pandemic, 30.4% of working parents who missed work cited vacation or personal days as the main reason, and this increased to 39.5% post-peak pandemic; another 17.9% cited personal illness as the main reason during the peak pandemic, and this fraction increased post-peak pandemic to 18.5% (up from 17.5% pre-pandemic).
18 Our estimate for the number of parents in a period that experience childcare problems as a main barrier for one of the three outcomes equals the product of the average number of parents the applicable respondents represent in the period multiplied by the share of respondents citing childcare as the main reason in that period for that outcome.
19 There is minimal, if any, double counting of parents. In any given month, no parent is asked more than one of the “Why absent,” “Why not looking for work” and “Why part-time” questions.
20 We compared actual labor force participation rate and labor force size with a counterfactual in which all individuals who reported that childcare problems were the main reason they were not seeking work were also considered participants in the labor force.
21 For this calculation, parents that missed work due to childcare problems are treated as not childcare-affected and their hours are set at their potential hours.


