

Across the Midwest, rising housing costs have created significant hardships for many households, according to our contacts within the Seventh Federal Reserve District. In addition, employers within our region have described how the availability and affordability of housing affect their ability to attract workers. Detroit is no exception to these housing trends: Access to quality affordable housing (generally defined as housing costing no more than 30% of household income) has been challenging for many in the Motor City for a long time for several reasons.
To better understand the historical as well as current statistics and anecdotal reports about Detroit’s housing market, Chicago Fed staff investigated the challenges and opportunities on both the supply and demand sides by analyzing the data from public and private sector sources and by hosting a day-long convening with local experts. Discussions among policymakers, researchers, activists, and other advocates took place at the Detroit Branch of the Federal Reserve Bank of Chicago on June 4, 2025, at a conference titled The Challenges and Opportunities Facing Detroit’s Housing Market. In this article, we summarize some of the key findings from our data analyses, as well as related information and insights shared by speakers at the June 2025 event.
The greatest deterrent to increasing the supply of affordable housing in Detroit is development costs
High home construction costs aren’t just a local challenge for Detroit. Rather, they’re a national challenge. Figure 1 shows that almost all components of U.S. inflation-adjusted homebuilding costs have increased between 1998 and 2024—i.e., these construction costs (broken down into seven categories in figure 1) have generally risen faster than inflation over this 26-year span. Conference participants shared how these cost increases are challenging the ability to create additional housing supply in Detroit and the steps that they are taking to address them.
1. Change in real U.S. homebuilding project costs, by category, 1998–2024

Sources: Authors’ calculations based on data from the U.S. Bureau of Economic Analysis and National Association of Home Builders in Lynch (2025).
In figure 1, the orange line represents material costs, which almost hit the number 200 in 2024, meaning the level of inflation-adjusted material costs nearly doubled between 1998 and 2024. The black line represents profit margins for the developer, indicating inflation-adjusted margins in dollars have doubled over the same time frame. Notably, except for a post-Great Recession dip in 2011, the orange and black lines have trended upward over this 26-year span. However, as shown in figure 2, as a percentage of the average project cost, the developer’s profit margin stood at 11% in 2024—up 180 basis points from 9.2% in 1998, according to the National Association of Home Builders (Lynch, 2025).
2. Breakdown of average U.S. homebuilding project costs, by category, 2024
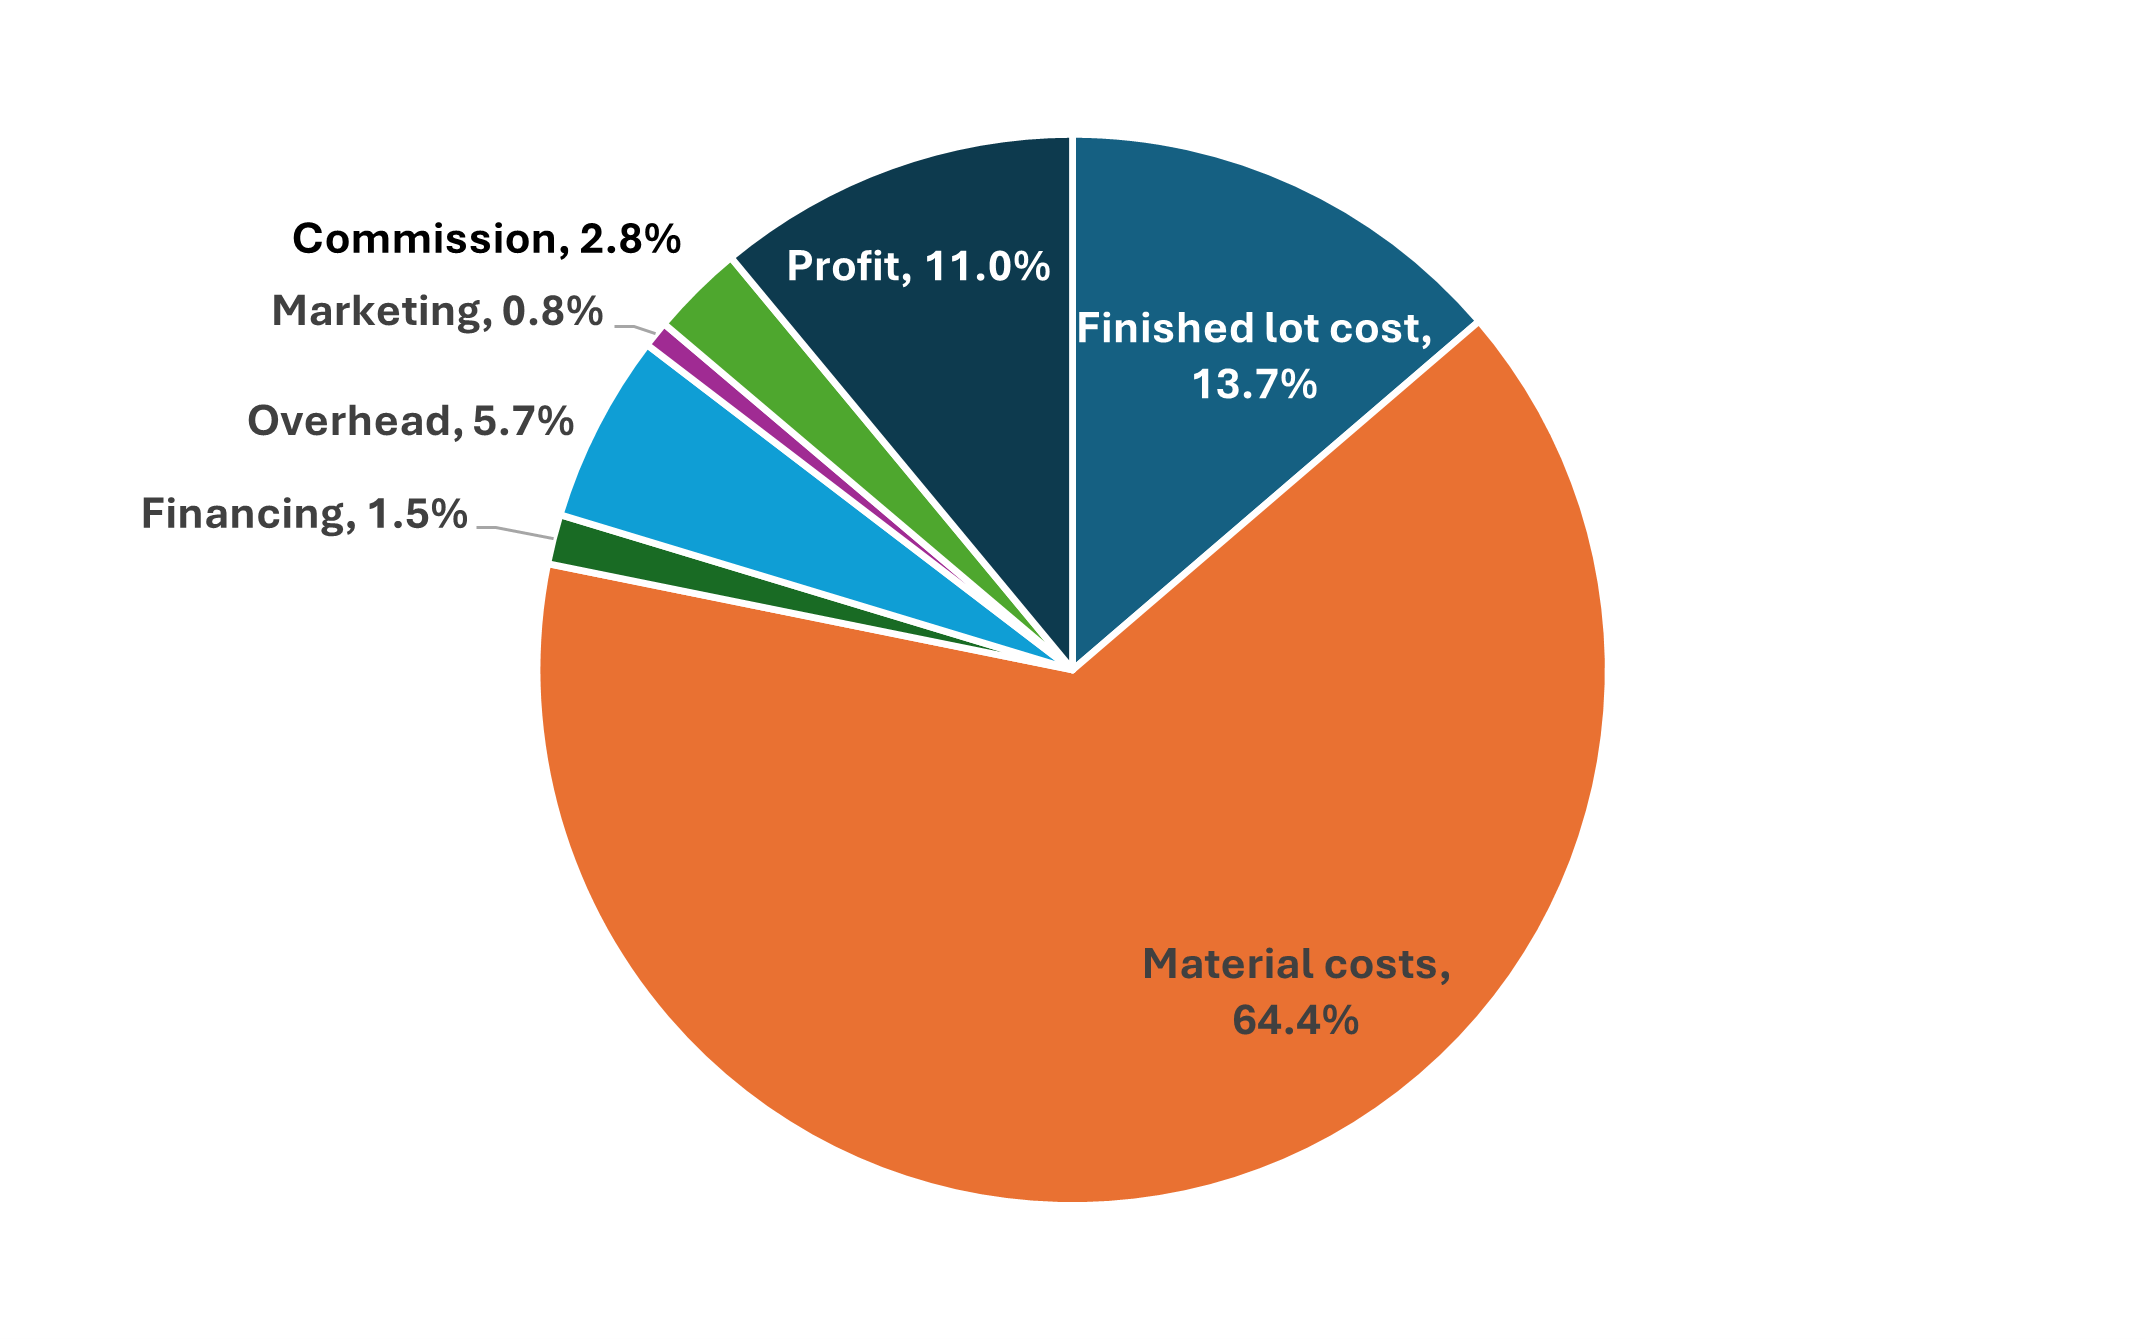
Source: National Association of Home Builders in Lynch (2025).
Many participants at our June 2025 conference indicated that high construction costs are a deterrent to increasing housing supply in Detroit to a similar degree as or more than in other places in the U.S. Many who are knowledgeable about Detroit housing development told us because of the city’s industrial past and the way it shuttered many homes previously, (re)developing houses and neighborhoods is hindered by the potential or actual presence of hazardous substances, pollutants, or contaminants—i.e., Detroit is one big brownfield site.
The age of Detroit’s housing stock and the way some homes or homesites were maintained require environmental studies and utility excavation, whose costs run in the tens of thousands of dollars. Before coming to Detroit, conference participant Brandon Hodges, of TRIBE Development, had never seen levels of arsenic or asbestos this high at any site. Hodges said he has paid high fees for environmental assessments to understand what’s in the soil and check if it’s viable to build on. Similarly, presenter Paul Lindsley, of Ritz-Craft Homes, stated that site costs are ten times higher in Detroit than in any other Michigan city because of these environmental challenges.
The conference explored what practitioners are doing to lower development-related costs. Tim Klont, who is the chief operating officer for the Michigan State Housing Development Authority (MSHDA), said his organization worked on getting the state government to allow tax increment financing (TIF)1 to increase the housing supply and started MI Neighborhood, a program that reduces barriers to development, especially for small and emerging developers. Also, Klont explained that MSHDA has a housing readiness incentive program to which local governments can apply for grants that would go toward reducing regulatory or land-use barriers to increase the supply of homes.
Developers at the conference addressed how they are trying to mitigate high material and building costs. For instance, Ed Fowler, of Detroit Landmark Development, shared that his firm created its own construction company that directly imports granite from China for home countertops, bypassing intermediaries’ markups. Fowler said that overall, his firm was able to more than halve its total construction costs through various savings strategies.
Conference participants also shared how bridge or gap financing has become necessary in the post-Covid era, as construction costs have stayed elevated or even risen further. Representing the City of Detroit, Keegan Mahoney said the city government is addressing that challenge through the Detroit Housing for the Future Fund, which offers predevelopment and low-cost lending. That’s in addition to the payment in lieu of taxes (PILOT) option that developers can utilize, which keeps rents affordable and allows developers to pay a percentage of rent collections (instead of the property value) as their property tax, as well as borrow more against affordable properties they’re developing.
In some cases, efforts to increase the affordable housing supply originated from other initiatives that had begun without being directly tied to housing. At the conference, George Adams, of the nonprofit 360 Detroit, shared that he didn’t like how his Virginia Park neighborhood looked a decade ago, so he began efforts to change it. What started out as taking care of overgrown grass and improving pedestrian views turned into building a park, which was then followed by lot and alley cleanups before evolving into plans to rehab existing housing units into affordable properties. However, because of the housing units’ distressed conditions, rehabbing costs have been twice the market value of these properties. It has taken years to raise the funds and subsidies (both loans and grants) needed to rehab these Virginia Park homes and keep them affordable for Detroiters, said Adams. Without the grant funds, the costs of rehab would have made the rents and sale prices of these units unaffordable to most Detroiters.
Presenters at the conference shared that when new housing supply hits the market, it can serve as a catalyst for additional neighborhood activity, helping to justify the costs of new construction. TRIBE Development currently has The Deco, a project on East Warren Avenue that offers a few apartments priced between 60% and 80% of area median income (AMI),2 with ground-floor retail space and a restaurant. As The Deco took shape, other small businesses began to open down the street, further propping up that corridor. Hodges said that he and his colleagues at TRIBE Development increasingly look for opportunities to participate in or build coalitions made up of strong neighborhood entities because it takes the pressure off any single entity to build momentum and ensures that the community’s voices are heard as a development takes shape.
Returning to the data underlying figure 1, we note that after adjusting for inflation, overhead costs—which include labor costs—increased at a faster pace than material costs between 2013 and 2024 (71% versus 35%). Related to these increasing labor costs, Victoria Gordon, of Macomb Community College, talked about the growing shortage of skilled trades workers. Gordon discussed the poor messaging about careers in skilled trades that was relayed to students in the latter decades of the twentieth century. For example, she said, high school guidance counselors heavily pushed students into classes that put them on a college track because careers in skilled trades weren’t seen as long-lasting and financially lucrative. Only recently has that messaging changed to help address the skilled trades worker shortage. As Gordon pointed out, a more recent challenge that’s emerged with trying to increase the supply of skilled trades workers is the hourly wage that can be earned doing less strenuous service-based work, which is similar to that earned by skilled construction and trades workers. According to Gordon, construction and trades employers need to offer more competitive wages if they hope to attract and retain workers. In addition, Detroit Landmark Development’s Fowler shared that he created his own workforce development program that works with several nonprofit training organizations to hire and train individuals inexperienced in construction work. Given their lack of experience, those workers work in teams, in an assembly-line fashion, to build specialized construction skills. Many of those workers have gone on to start their own contracting businesses, said Fowler.
Demand for housing in Detroit is challenged by high housing costs and low incomes, and leaders are working to address both
Conference participants also discussed trends related to housing demand, focusing on the ability of Detroit residents to afford housing. Our examination of the data and the conference discussions yielded three major themes concerning housing demand in Detroit. First, property values and housing costs for residents are increasing. Second, local incomes are not sufficient to cover the rising costs. Third, leaders are working to address the gap between the cost of housing and the income of residents in Detroit.
The first takeaway from the conference discussions about housing demand was that property values and housing costs (including rents) for residents are on the rise. Starting with the data, we document in figure 3 how housing values have been increasing in Detroit by calculating the markup—a ratio that measures the tightness and competitiveness of a housing market. To calculate the markup, we divide the actual sales value by the assessed value, averaged over the past three years for each Detroit zip code, through the first quarter of 2025 and multiply it by 100. The median markup across the entire city is 29%, with substantial variation across zip codes.
3. Detroit housing median markups, by zip code, as of 2025:Q1

Source: Authors’ calculations based on data from CoreLogic.
When diving deeper into the data, we notice that a relationship emerges: the higher the markup, the lower the number of sales—which brings us to the question of inventory. Lower housing inventory should equal higher markups, and Detroit’s inventory has been low, as evidenced by the generally competitive, multi-bidder home sales experiences in many parts of the city. For example, with the highest markup of any zip code, 48211 (which is adjacent to the zip code location of our Detroit Branch) has a relatively low amount of housing inventory given the zip code’s industrial footprint and its high number of empty lots. The same low inventory story applies in zip code 48208, where fewer than 10,000 people reside and where the Detroit Land Bank is the largest landowner. The 29% median markup for Detroit could represent the way the city’s market is readjusting after being valued so low for decades, which generally adds to the purchase cost for prospective Detroit homebuyers.
Conference speakers shared that overall, Detroit’s homeowner market has increased in value and activity in recent years. Shari Williams, of Detroit Future City (DFC), pointed out that the number of home purchase applications had increased by about 520% between 2012 and 2023 and the number of home loans had increased from fewer than a hundred in 2012 to almost 3,600 in 2023.
However, amid this more active housing market there are still structural barriers that can limit housing demand. According to research from Detroit Future City (Gallagher and Lynch, 2022, p. 6), potential African American home buyers were twice as likely to have their mortgage purchase applications denied as their White counterparts in 2020. Another structural challenge to homeownership that Detroit Future City identified in Detroit is heirs’ properties—i.e., properties that are passed down without formal legal proceedings that prove ownership. Based off the number of properties that DFC researchers were able to identify as heirs’ properties, they estimate that at least $268 million in household wealth is tied up as nonworking capital in those properties (Wagh and Sandoval, 2024, pp. 6, 15). Not being able to access wealth, whether it be through relatives’ previous homeownership or through financial institutions, makes it more difficult to increase housing demand. Since this research was released in 2024, DFC has worked with the City of Detroit and others to reach homeowners in this predicament to provide assistance with gaining legal ownership.
Another factor impacting affordability in Detroit’s housing market is increasing insurance costs for both homeowners and property owners. Not surprisingly, comparisons of insurance costs in Detroit neighborhoods and adjacent suburbs reveal considerable differences. For example, when looking at the U.S. Department of the Treasury’s data set that contains home insurance costs by zip code,3 we note that the average home insurance premium in 48221—which comprises the Detroit middle-class neighborhood of Bagley and the more affluent area of Sherwood Forest—is more than twice that in the adjacent zip code of 48220, which contains the trendy suburb of Ferndale. So, when thinking about home affordability, insurance costs must also be considered. Sam Stragand, from the University of Michigan’s Poverty Solutions, discussed his research, which found that about one-quarter of Detroit homeowners lack homeowners insurance (Nothaft and Stragand, 2025, p. 3); this share makes homeowners insurance more costly for those homeowners who do carry it relative to what they would’ve paid had the owners of the uninsured stock of homes also paid premiums for coverage. Insurance is costly for developers as well. Matt Temkin, of Greatwater Opportunity Capital, shared that his properties have experienced annual insurance cost increases of 30% in the past several years.
In addition to rising home prices and home insurance premiums, data suggest that Detroiters are also experiencing rents that are high relative to incomes. Using CoStar data, we display in figure 4 the average market rent for different Detroit neighborhoods in 2025.
4. Select Detroit neighborhood rents in 2025 versus Detroit metro area median income rent thresholds for 2024

Sources: CoStar and Mondry (2024).
The data in figure 4 compares the average market rents for three-bedroom houses of select Detroit neighborhoods with the 100% area median income (AMI) rent4 for Metro Detroit; it also puts the former up against the 50% AMI rent for the metro area, since anecdotally, that’s where rents need to be so they’re truly affordable for Detroiters. For figure 4, the AMI is for a four-person household made up of two adults in some form of domestic partnership and their two children.
For developers, ideally market rents will come close to hitting the 100% AMI rent, and in Corktown they do. Hence, Corktown is attractive for developers. If that can’t happen, the market rent should at least hit the 50% AMI rent threshold because then a developer can offer affordable multifamily units with the help of subsidies, which exist, though they are limited. But as shown in figure 4, market rents in Mexicantown fall noticeably short of the 50% line, meaning the market is more challenging for developers; building new housing units there likely requires additional public and nonprofit assistance, which may deter some developers from starting projects there.
Another concern is the quality of housing that is available at affordable rates. Stragand shared that absentee property owners and, more recently, Bitcoin-based investors have purchased thousands of properties in Detroit without investing in property improvements or maintenance, resulting in affordable, but poor-quality, rental units in the city. Blight violations of such properties (almost 164,000 of them were officially deemed blighted properties) have numbered over 820,000 since 2005, noted Stragand. These properties are concentrated in the far east and west sides of Detroit, far away from downtown areas and other neighborhoods seeing more public and private investment.
The second takeaway from the convening’s conversations about housing demand was that Detroit household incomes are too low to support housing costs. The median income in Detroit in 2024 was $39,209, compared with $76,403 in the broader metropolitan area.5 So, it’s not just that home prices or rents are high; it’s that incomes are low. We know that some consumers may be able to afford their mortgage or rent payment, but when either is combined with other essentials, that total puts them in a tough position. Being burdened by homeownership or rent means devoting more than 30% of your income toward either; more than 30% of Detroit homeowners are burdened by mortgage payments.
How does that compare with other cities? A report on the ratios of home price to income shows that Detroit isn’t as burdened as most of California’s major cities, Miami, and New York. In this respect, Detroit is comparable with Cleveland and Birmingham, Alabama. However, Detroit’s proportion of households burdened with housing-related costs is higher than well-known “unaffordable” places such as Seattle, Portland, and Austin.
The third takeaway from the conversations about housing demand was that Detroit leaders and practitioners are finding innovative solutions to address the gap between income and home prices. Public sector, private sector, and community organizations have been working creatively—and often collaboratively—to address the affordability challenges facing Detroit’s housing market.
An example is the Future of Health project, which has been undertaken by Henry Ford Health, Michigan State University, and the Detroit Pistons. That project will (re)develop affordable housing units to expand the New Center neighborhood’s housing market by enticing some employees to move there so that they can live and work in the same location. Existing residents in the neighborhood will experience improvements in housing conditions and infrastructure and have access to employment nearby.
Detroit’s Down Payment Assistance (DPA) program was created in partnership with The Ownership Initiative to boost housing demand, and the DPA has contributed greatly to making the home mortgage marketplace more accessible for African American borrowers, according to Krysta Pate, who serves as the initiative’s CEO. At the conference, David Palmer, of Kite & Key Partners, presented two maps—one from 2019 and other from 2023—which are reproduced here as figure 5, panels A and B. The maps show that except for in neighborhoods adjacent to Coleman Young International Airport and a couple of east side neighborhoods, the DPA helped increase the number of property sales and mortgage originations across the city. For instance, in Northwest Detroit, the dark blue dots in panel B symbolizing DPA assistance appear in bunches, as do darker green shaded areas signifying an increase in mortgage originations. Similar trends appear along Detroit’s northern and northeastern borders. DPA participation was high in 2023, and thus, mortgage originations increased greatly in most areas of Detroit as indicated by the relatively darker shades of green (and greater number of areas with darker shades of green) in the 2023 map (panel B) compared with the 2019 map (panel A).
5. Detroit home sales and mortgage originations: 2019 versus 2023
A. 2019

B. 2023

Source: Kite & Key Partners.
Similarly, a diversified community investment fund being stood up in Southwest Detroit, which Palmer presented at the conference, is a financial tool that raises funds from residents as well as external investors and supports local projects to increase local ownership and wealth. In Detroit, such a fund would target housing development for the 80% to 120% AMI borrowers.
Before the Down Payment Assistance program was created, said Pate, The Ownership Initiative and other Detroit entities engaged in other major efforts such as selling blighted homes to stabilize neighborhoods and creating the Detroit Home Mortgage Fund, which reset neighborhood home values to normalize mortgage transactions. More recently, they created the Motor City Contractor Fund to support Detroit-based construction companies to increase the supply of move-in-ready homes in neighborhoods.
An additional way to increase housing demand is to allow renters to become homeowners. At the conference, Hector Hernandez provided a presentation about the work his MiSide6 team is doing to turn 1,000 low-income housing tax credit (LIHTC) parcels currently occupied by renters into owner-occupied single-family homes once those parcels reach the end of their 15-year compliance period. Such an initiative was undertaken in the East Chadsey-Condon neighborhood when 60 LIHTC units were acquired and 53 tenants became homeowners over the period 2020–25, gaining access to a special-purpose lending product that MiSide could offer through a sister corporation. Because these loans performed well, they allowed MiSide and partner banks to create a loan pool and the ability to make more loans to families, providing a lending model that could be followed by others.
Similar to Hernandez and MiSide, Ted Phillips and the United Community Housing Coalition provide several services to help renters and homeowners, including working with the City of Detroit to direct distressed single-family renters into workable payment plans on existing homes. They also work with Wayne County to help tenants purchase homes at foreclosure auctions. Another way the coalition helps tenants become homeowners is to buy out land contracts where tenants are paying high, predatory rents—a problem that’s plagued Detroit renters for decades. The coalition provides financial and relocation assistance if necessary. They also do tax foreclosure prevention work.
Public housing can be part of the solution to affordable homeownership. However, as Arthur Jemison, of the Detroit Housing Commission, noted, there’s been a gradual erosion of support for public housing since the 1980s. With what Jemison described as getting 60% of the operating support he needs, the commission has still been able to use public housing as a vehicle to help families. Such assistance includes using project-based vouchers to create mixed-income housing like La Joya Gardens in Southwest Detroit.
Conclusion
As the data show and many conference speakers pointed out, home affordability in Detroit would improve if income levels could be lifted. Given Detroit’s low levels of median household income, renters and homeowners can only afford so much. Detroiters often cannot afford the apartments and houses that developers have recently brought to market. Subsidies are needed to fill the gap between what renters can afford and where market rents stand; in addition, other financial assistance is required that would allow multifamily developments to be underwritten, given the cost pressures developers face.
Leaders in Detroit are finding ways to address these housing-related challenges. Creating housing markets and employment opportunities through partnerships, as opposed to trying to (re)develop housing markets in neighborhoods that can’t support them yet, could be a viable development strategy. Practitioners are also exploring shared-equity models, such as community land trusts,7 which can provide longer-term housing affordability and neighborhood stability. While the challenges in the Motor City are many, local efforts are continually integrating new perspectives, data, and strategies to stabilize or grow Detroit’s housing market.
Notes
1 Tax increment financing uses tax revenue from future gains in real estate values to subsidize site redevelopment for a particular project or community; a more detailed definition of TIF is available online from the U.S. Department of Transportation, Federal Highway Administration. See also Tyler (2024) for further details on the MSHDA TIF.
2 Area median income is the midpoint of a region’s income distribution. AMI is used to determine who’s eligible to live in affordable units based off their income. For further details on AMI, see Metropolitan Council (2018).
3 U.S. Department of the Treasury, Federal Insurance Office, 2025, Analyses of U.S. Homeowners Insurance Markets, 2018-2022: Climate-Related Risks and Other Factors, Supporting Underlying Metrics data set, Washington, DC, January.
4 Area median income rents are set by the U.S. Department of Housing and Urban Development (HUD) for metro areas, and, in this specific case, for the Detroit–Warren–Dearborn, MI, metropolitan statistical area (MSA).
5 U.S. Census Bureau, 2024 American Community Survey. As defined by the U.S. Census Bureau, Detroit’s metropolitan area is the Detroit–Warren–Dearborn, MI, MSA.
6 MiSide provides homeownership counseling that will include homebuyer training and credit building.
7 For details on community land trusts, see Lowery et al. (2021) from the National League of Cities and Grounded Solutions Network and Zonta (2016) from the Center for American Progress.


