Real wage growth for workers at different points in the wage distribution is a critical barometer of how different workers’ ability to afford goods and services is keeping pace with price levels. An important technical point in measuring wage growth is “topcoding” in the Current Population Survey (CPS), which is sponsored jointly by the U.S. Census Bureau and the U.S. Bureau of Labor Statistics (BLS).1 To protect individuals’ privacy, CPS wage data are topcoded—i.e., the very top wages reported in the CPS are capped at a given nominal amount. In periods of time where wages are growing, a higher share of individuals’ wages at the top of the wage distribution get masked by topcoding if the topcode threshold remains fixed. This topcoding approach will mechanically lower measures of average wage growth. Yet in periods when the topcoding is changed, average wage growth may change dramatically even without changes in the underlying wages earned.
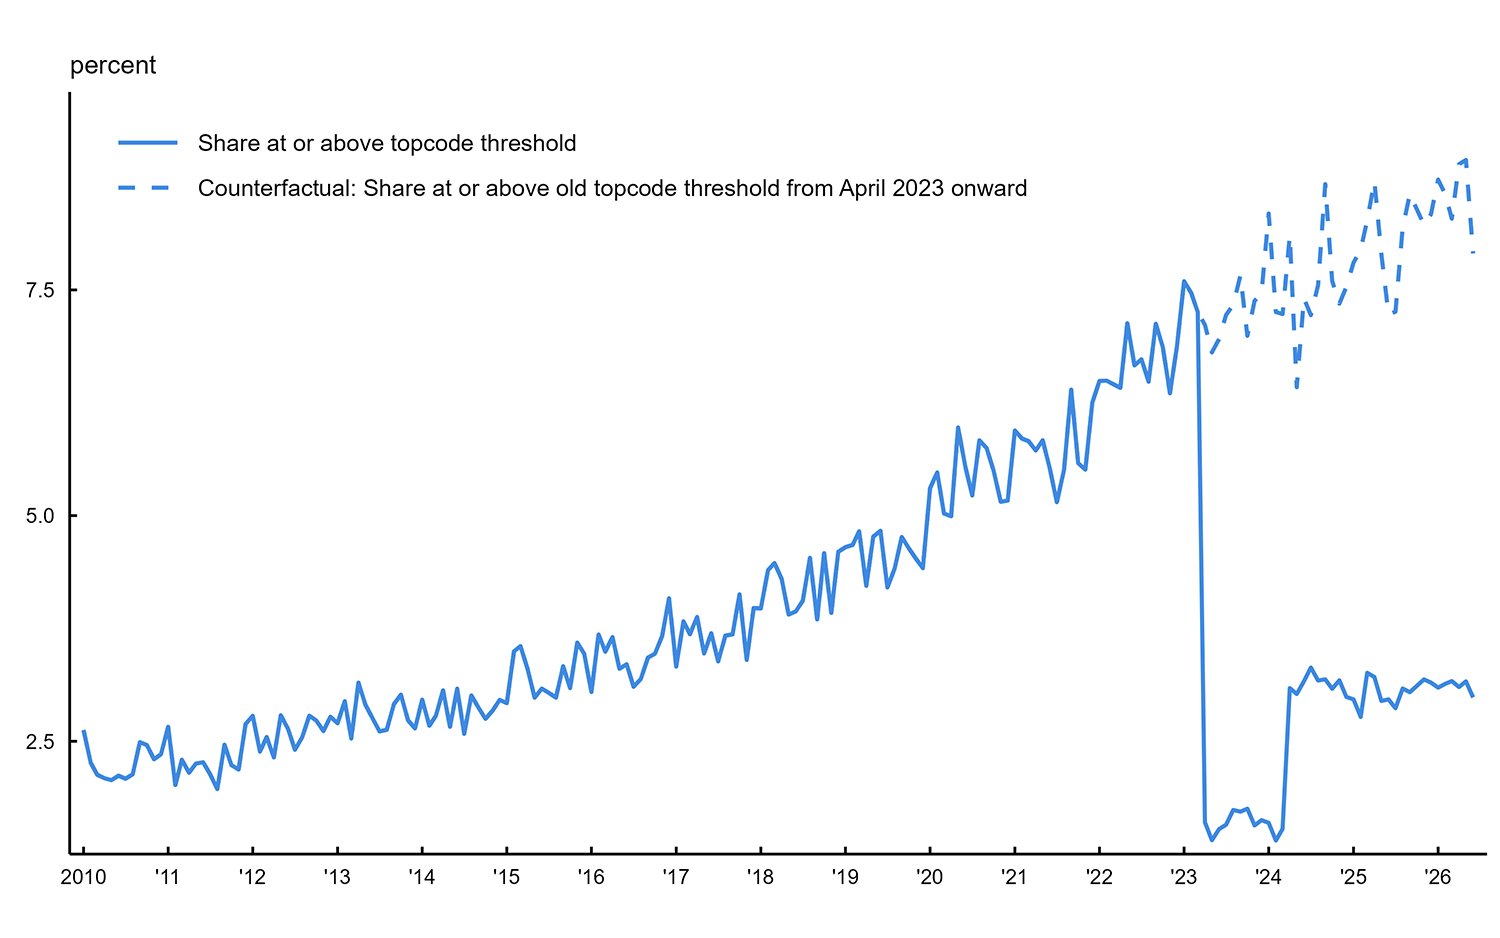
Figure 1 shows the share of workers whose (nominal) wages are at or above the topcode threshold—which we define as the maximum weekly wage observed in the CPS. From January 2010 through March 2023, an increasing share of the observations are topcoded. By 2022, about 7.5% of workers had wages that were subject to the topcode. Beginning in April 2023, a new topcoding methodology was phased in,2 switching from a static topcode value to a dynamic one, with the top 3% of earners being assigned the value of the weighted average of earnings among the top 3% in each month. The dashed line in figure 1 shows the percentage of wages that would have been topcoded if the new method had not been adopted. In this article, we examine the impact of this change to the CPS topcoding methodology for measures of wage growth and explore how measures of growth based on median versus average wages can lead to different conclusions about how workers are faring.
1. Share of workers whose weekly earnings are at or above the CPS topcode threshold, January 2010–June 2026
Source: Authors’ calculations based on data from IPUMS, IPUMS CPS.
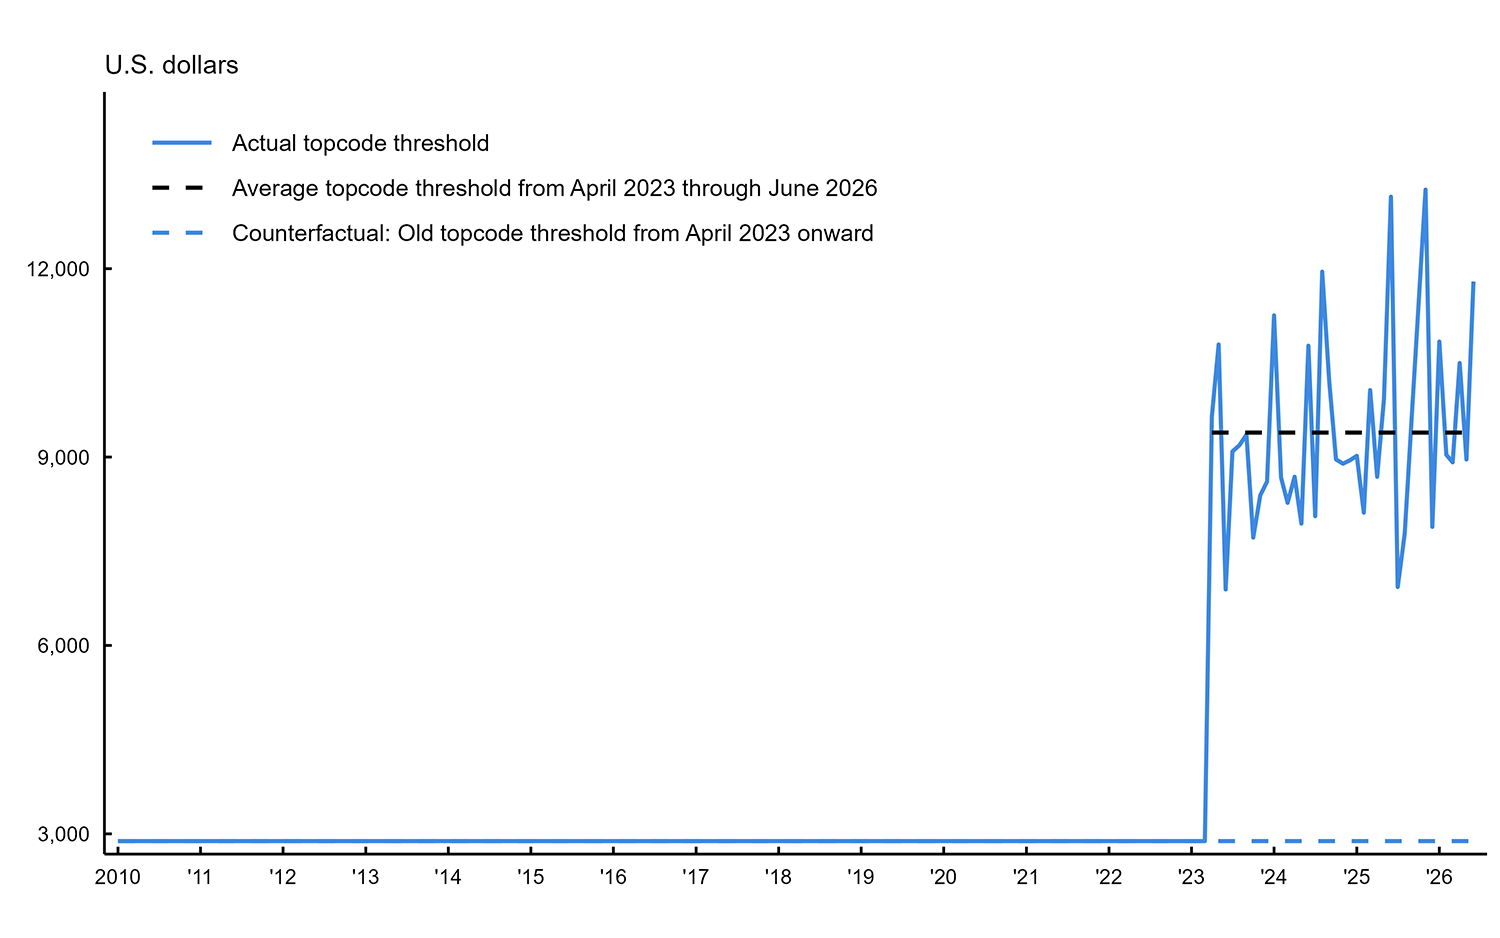
Figure 2 shows CPS topcodes from January 2010 through June 2026. In other words, this figure tracks average (nominal) weekly earnings for topcoded earners from the start of 2010 through mid-2026. The average weekly earnings of those whose wages were topcoded equaled $2,885 from January 2010 through March 2023 (which is the fixed topcoded value during the period). From April 2023 onward, as the U.S. Census Bureau phased in the dynamic topcoding, the average topcoded weekly earnings increased to $9,334.70. Since April 2023, both the fraction of earnings that are topcoded and the average among them vary from month to month.
2. CPS topcode thresholds, January 2010–June 2026
Source: Authors’ calculations based on data from IPUMS, IPUMS CPS.
Comparing wage growth using averages versus medians when topcode thresholds change
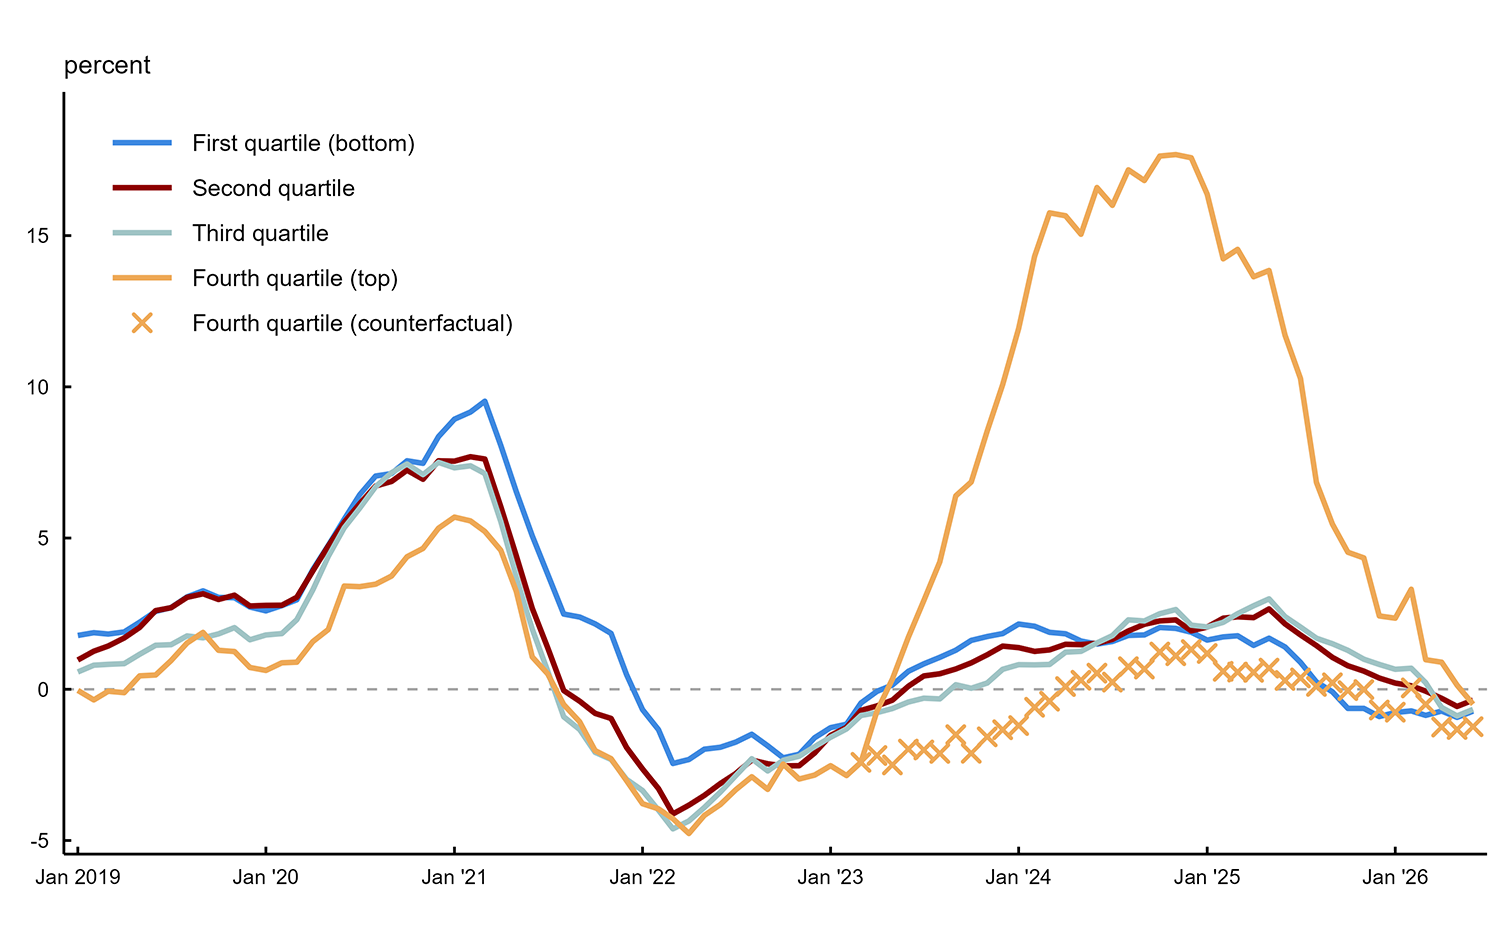
What impact does this change in CPS topcoding have on measures of wage growth—and particularly on wage growth by quartile of the wage distribution? Figure 3 shows the year-over-year growth in average real wages by quartile each month from the start of 2019 through mid-2026, with 2017 as the base year. Here, we calculate average weekly wages among those with earnings in the 1st–25th (bottom) percentile of wages, which we refer to as the first quartile, and among those with earnings in the 26th–50th percentile, which we refer to as the second quartile, and so on. For the fourth quartile (i.e., the highest wage earners), we include a line of orange cross marks showing what wage growth would have been under the old topcoding methodology. In 2023, as the threshold for topcoding increased, the average wages of the top quartile rose sharply. This is, in part, mechanical because the average weekly earnings of those who were topcoded rose from $2,885 to over $9,000 (depending on the month). Well-known measures of wage growth, like the Atlanta Fed’s Wage Growth Tracker,3 which adjusts for changes in labor force composition, throw out all topcoded values in order to deal with these types of issues. Figure 3 shows a sharp increase in wage growth among the fourth quartile of earners starting in 2023 and through the end of 2024, as the new topcoding methodology was implemented. The line of orange cross marks shows that without this change in topcoding, measures of growth in average real wages for the highest quartile of earners would have been much lower.
3. Year-over-year growth in average real wages, by quartile, January 2019–June 2026
Source: Authors’ calculations based on data from IPUMS, IPUMS CPS.
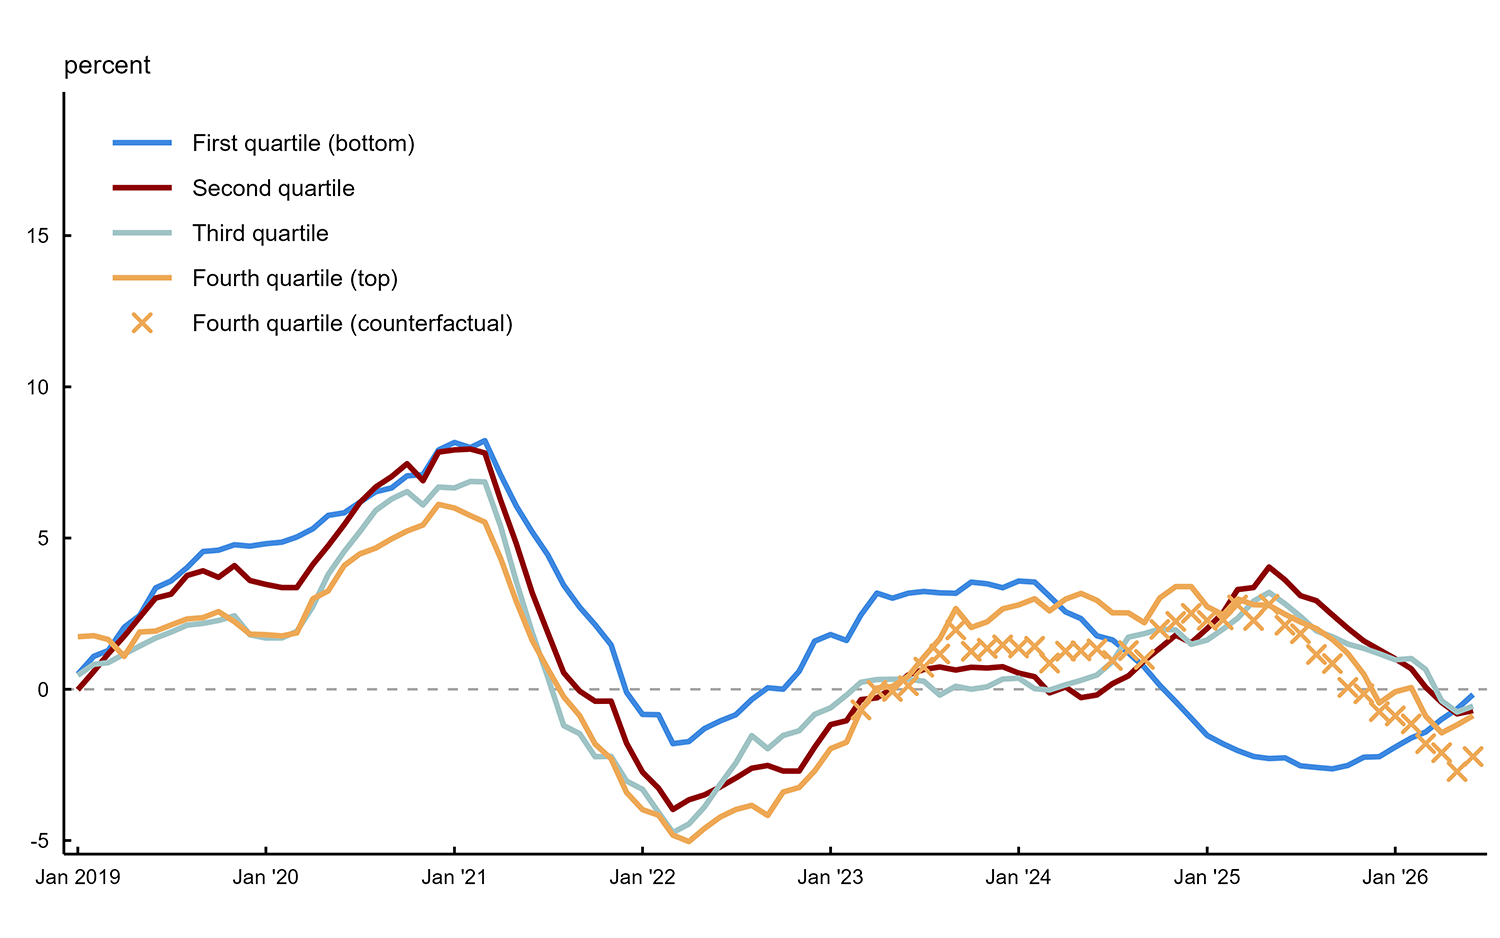
If we instead calculate the growth in median real wages by quartile, as in figure 4, the pattern looks quite different. The median value in each quartile is less likely to be affected by the change in topcoding that took place in 2023.4 In this calculation, the wage growth for the fourth quartile is flat from mid-2023 to mid-2025, after which wage growth starts to decline. The line of orange cross marks shows wage growth for the fourth quartile had the topcoding methodology not changed; here the growth in median wages with and without the topcoding change is much more similar in comparison with the growth in average wages with and without the same change in figure 3.
4. Year-over-year growth in median real wages, by quartile, January 2019–June 2026
Source: Authors’ calculations based on data from IPUMS, IPUMS CPS.
Importantly, growth in median real wages for the first quartile of the distribution (i.e., the lowest wage earners) turned negative toward the end of 2024. Real wage growth started declining in mid-2025 for the second, third, and fourth quartiles, and turned negative for the fourth quartile at the end of 2025.
Of course, the measure of wage growth using the median may also have problems in capturing for whom economic outcomes are improving and for whom they are worsening. For example, people tend to report rounded wages, and this “heaping” and “bunching” in the data can mean that growth rates of the median can look quite different from the growth rates of a percentile that is just slightly higher or lower than the median. In addition, wage growth is only measured among employed individuals. If labor force participation or unemployment is changing differentially across groups, then wage growth among the employed will not address these compositional shifts. For a thorough discussion of issues in measuring wage growth, as well as suggested solutions, see Honoré and Hu (2025).
Other issues in measuring wage growth: Choice of deflator
Regardless of the measure used to define wage growth, there is also the question of the deflator being used to turn nominal into real wage growth. Here, we use the Consumer Price Index for All Urban Consumers (CPI-U), which does not differ across groups (e.g., socioeconomic groups). Divergence across groups in price-level changes can happen, for instance, if they consume different baskets of goods and services, if different groups are better able to substitute away from goods and services that have experienced faster price rises, or if different groups purchase from different providers with different abilities to pass on cost shocks. Work by Jaravel (2024) on the Distributional Consumer Price Indices (D-CPI) and work by the BLS on alternatives to the Consumer Price Index referred to as the R-CPI-I and the R-C-CPI-I5 suggest that prices for less-well-off groups have been rising faster in recent years. Luduvice et al. (2025) from the Cleveland Fed reported that inflation as measured by the R-CPI-I rose faster for the bottom 40% of earners, but their wages also grew faster, resulting in this group having the highest real wage growth of any of the other groups in the wage distribution over the period 2019–24. If we use Jaravel’s D-CPI measure we find broadly similar results to those presented in figure 4, and we continue to see that in the most recent period, the lowest-earning group had the lowest real wage growth in 2025.
Key takeaways
Understanding how the economy is evolving for different groups is critical, both because it can give us insights into where the macroeconomic vulnerabilities are and because it can help us understand consumer sentiment. Understanding how the economy is evolving is sensitive to measurement issues. Using a measure that accounts for extreme values—including how technical changes such as adjustments in topcoding methodology affect how those extreme values are treated in the data—is important. Using growth in median real wages, we see that real wage growth had turned negative for the lowest quartile of earners by late 2024 for and the other three quartiles of higher earners by early 2026.
Notes
1 We accessed the CPS micro data from the IPUMS website. Details on topcoding in the IPUMS data are available online.
2 Details on the new dynamic topcoding adopted by the U.S. Census Bureau in April 2023 are available in this technical note. The phase-in of the new topcoding methodology began with households that had been in the sample for four months (i.e., months in sample, or MIS, equal to 4) as of April 2023. As the new topcoding was phased in, there was at first a sharp drop in the percent of wages at the highest value, as shown in figure 1, because those subject to the previous static topcode were at a lower value than those subject to the new dynamic topcode.
3 The Atlanta Fed’s Wage Growth Tracker calculates wage growth for those who remain employed. This adjusts for changes in composition because if workers in the lower-wage quartiles are more likely to lose their jobs during a recession, for instance, average wages among workers will rise, but wage growth for continuing workers may fall. See Honoré and Hu (2025) for a discussion.
4 If the fraction of topcoded observations is high enough, the median can also be affected. For example, if more than 50% of wages in the fourth quartile were topcoded, then the median calculation would be changed by topcoding decisions.
5 The D-CPI is available through May 2026 (see the Distributional CPI Project webpage). The R-CPI-I is available through December 2024, and the R-C-CPI-I is available through December 2023 (see the R-CPI-I and R-C-CPI-I webpage on the BLS website).