

The following publication has been lightly reedited for spelling, grammar, and style to provide better searchability and an improved reading experience. No substantive changes impacting the data, analysis, or conclusions have been made. A PDF of the originally published version is available here.
Since its peak in 1985, the foreign exchange value of the dollar has dropped more than 50 percent. A fall that great should have dramatically reduced the deficit in U.S. international trade by now. It hasn’t.
Instead, as of late 1987, the deficit in U.S. merchandise trade was running at a record rate and ended the year in excess of $170 billion. Why?
A depreciation in the exchange value of the dollar should increase the dollar price of U.S. imports. In response, domestic consumers should purchase fewer of those now more expensive imports. If the quantity purchased (“real imports”) declines by a greater percentage than the price increased, then the total nominal or “current dollar” value of imports declines. So, a weaker dollar should reduce the total dollar value of imports.
On the other side of the theoretical coin, U.S. exports become cheaper in terms of the stronger foreign currencies. Foreign demand for U.S. goods increases as does the dollar value of the foreign purchases. In theory, then, the value of U.S. exports increases, the dollar value of U.S. imports decreases, and the trade deficit shrinks.
Where theory fears to tread
Any economist would hedge that explanation with the Latin catch, ceteris paribus, or “other things remaining the same.” And, that is the catch. Other things have not remained the same.
True, the value and the volume of U.S. exports have turned upward. During 1987 the current dollar value of merchandise exports was 11.5 percent greater than during 1986, and in real terms (based on 1982 prices) exports were up 10.3 percent (for the first nine months—the most recent data).
But imports also increased from 1986 levels. In 1987, the current dollar value of imports rose 10.7 percent from the previous year. Increased prices accounted for much of the increase, but the real volume of imports for the January—September period was also up from a year ago by 4.3 percent.1 The real trade deficit declined but the nominal deficit continued to increase.
Beyond the “J” curve
There have been a number of attempts to make sense out of the situation. The technical phenomenon called the “J” curve is often cited. But it has been pushed beyond its short-term explanatory limits and sheds little light on the longer-term failure to close the trade gap significantly.
Another explanation points to the increasing volume of U.S. trade with countries having currencies against which the dollar has stayed strong. These include Canada (our largest trading partner) and many newly industrializing countries of Latin America and the Pacific Rim. According to this view, the dollar has not dropped as much as is commonly thought.
While this explanation has considerable merit, most of the debate over how much the dollar has, or has not, depreciated misses an important element. Dollar prices of imports to the U.S. have increased substantially during the past year. But what really counts is the relationship between import prices and prices for domestically produced competitive goods. A falling dollar cannot itself close the trade gap. More important is how importers, exporters, and domestic producers price their goods, in terms of the falling dollar. These exchange rate/price relationships have received little attention, yet they are basic in measuring the impact of an exchange rate change on countries’ real trade balances.
Relative prices: Tales of three sectors
A depreciating dollar, which makes imports more expensive, has little effect in the marketplace if prices for domestic substitutes are also increasing and imports retain a substantial price advantage. In some sectors of the economy, U.S. producers have raised their prices as import prices have increased. We should not be too surprised that the value and volume of imports continues to increase in these sectors.
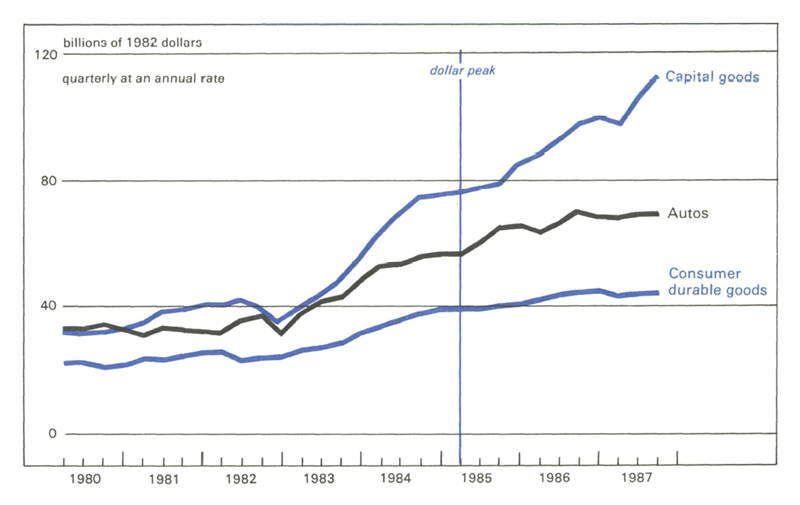
The trends represented in figure 1 support the contention that the declining dollar is having some impact on import trade. In particular, the dollar values of automotive and consumer durables imports, in real terms, have leveled off and even declined slightly since mid-1986.
But figure l shows quite a different picture with respect to capital equipment, which accounts for more than one-fifth of the total value of merchandise imports. Gains in real capital equipment imports appeared to slow in the last half of 1986 only to increase sharply again during recent quarters.
1. Despite lower dollar, imports continue rising
Let’s examine the trends in relative prices of imports as compared to domestic producer prices for these three major categories, to see why generalizations fail to explain the slow response to the declining dollar.
The tale of autos
During the 1979-1980 period rapidly advancing oil prices boosted demand for fuel-efficient foreign autos, resulting in upward pressure on prices. Then, the Japanese government began to limit the number of cars shipped to the U.S. in April 1981—to parry U.S. threats of import restrictions. To maintain the dollar value of their sales Japanese automakers shifted the export product-mix toward more expensive models. Thus, despite the appreciation in the exchange value of the dollar from mid-1980 to early-1985, auto import prices continued to increase (see figure 2).
2. Autos: prices in lockstep, little relative change
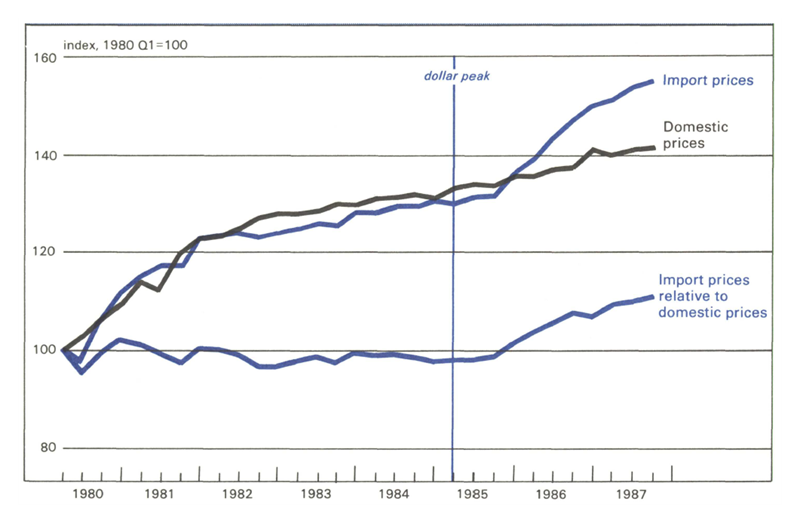
As prices for foreign autos went up, U.S. auto producers elected to increase prices and restore profits rather than attempt to recover market share from foreign producers. Throughout the period 1980 to early 1985 prices of domestic and imported cars moved upward virtually in “lock-step.” As a result, the relative prices of imports to domestics remained steady.
The sharp weakening of the dollar in early 1985 began to show up in an acceleration in import prices relative to domestic prices later that year. But, despite the relative reduction in U.S. car prices, foreign producers have continued to increase market share, suggesting that U.S. producers have not yet become competitive on the nonprice component of the auto market.
The tale of consumer durables
A somewhat different and thankfully more favorable picture emerges for prices of imported and domestic consumer durable goods, such as consumer electronics, (see figure 3). As the dollar strengthened during the first half of the 1980s the dollar price of imports declined. Later, as the dollar weakened, the dollar price of imports rose.
3. Consumer durables: U.S. begins to regain advantage
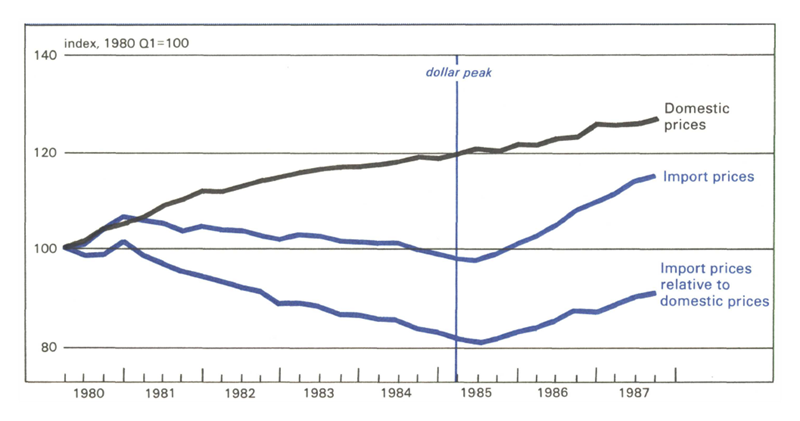
Domestic prices, on the other hand, moved upward during the period.
The decline in the relative-price ratio of imports to domestic consumer durables indicates that during the first half of the 1980s the U.S. competitive position deteriorated. Declining import prices reduced U.S. competitiveness, and increases in domestic producer prices compounded the problem.
Following the dollar’s peak and subsequent decline in 1985 the dollar price of imported consumer durables increased, more than offsetting the continued increase in domestic prices. Thus, from the relative price ratio we see an improvement in the competitive position of the U.S. for consumer durable goods (see figure 3).
As expected, the recent decline in the exchange value of the dollar has increased import prices for consumer durables. But, because of concurrent increases in domestic prices, the impact of higher import prices has not been as large as would otherwise be expected because it is the relative import/domestic price relationship that is important.
The tale of capital equipment
The data presented in figure 4 indicate that dollar prices for imported capital equipment, such as machine tools, follow the expected path during periods of strengthening and weakening dollars—very much the path traced by consumer durables. The amplitude of the movement was substantially larger, however. During the period when the dollar was rising (1980:Q3 to 1985:Q1) the price index for imported capital equipment declined nearly 1.5 percent. At the same time, however, domestic capital equipment prices rose 21 percent. In terms of price competitiveness, the decline in the position of domestic capital equipment was substantial. The ratio of import prices to domestic prices fell by more than 35 percent during this period (by comparison, the decline in the comparable ratio for consumer durables was 20 percent).
4. Capital goods: imports keep big price advantage
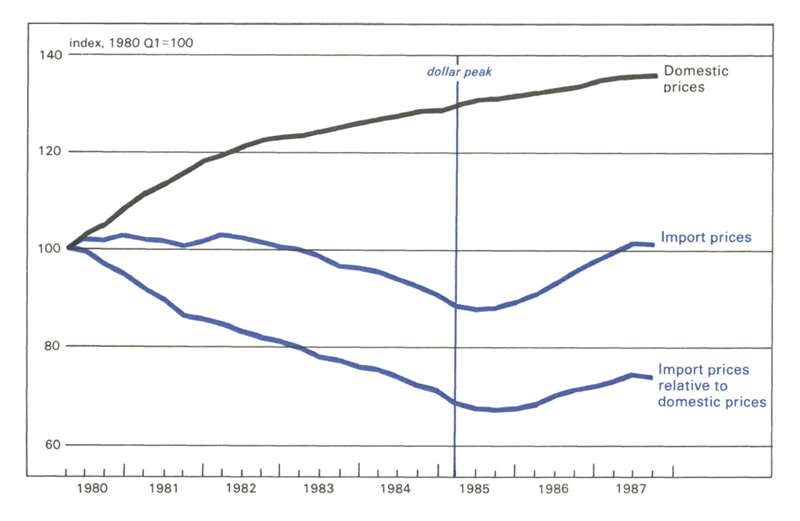
To make matters worse, with the dollar now weaker, U.S. price competitiveness in capital equipment has not improved appreciably. The index of dollar prices for capital equipment imports has increased since the dollar began to depreciate in early 1985—by 13 percent through the third quarter of 1987. But domestic prices continued to increase, helping to offset the price incentive for U.S. buyers to substitute domestic products for the higher priced imports. The net effect is that by the third quarter of 1987 the ratio of import prices to domestic prices for capital equipment was still 27 percent below the ratio in 1980, before the appreciation of the dollar began.2
Moral of the tales
The potential price effects on trade resulting from an exchange rate change cannot be looked at in isolation from the domestic price developments for competing goods. So long as domestic producers in search of improved profit margins increase prices and thus offset the potential gains in market share from the dollar depreciation, it will be difficult to reestablish a strong competitive position for U.S. goods in the domestic market against their foreign counterparts. In short, unless U.S. producers realign their priorities, a significant reduction in the deficit by reducing imports is not in the cards.
MMI—Midwest Manufacturing Index

Manufacturing activity in the nation rose 0.2 percent in December after two months of solid gains, according to the Federal Reserve Board’s Index. Declines in transportation equipment and machinery production accounted for much of the overall slowdown.
The national pattern of two strong months followed by a weak December was reflected in Midwest manufacturing activity. Because of the importance of transportation equipment and machinery in the industrial structure of the Midwest, the Midwest Manufacturing Index declined 1.2 percent in December. Primary metals, which has been a major factor in the acceleration of manufacturing activity throughout the nation during the last year, edged up by 0.1 percent in the Midwest during December.
Notes
1 The depreciation of the dollar has boosted import prices. According to U.S. Department of Labor estimates, in the fourth quarter of 1987 import prices were, on average, nearly 15 percent above a year-ago. Export prices, on the other hand, were up about 7 percent.
A fact that must be kept in mind throughout is that in the absence of the dollar depreciation the trade deficit would have been larger than that recorded.
2 The ratio of import prices to domestic prices for consumer durables in the third quarter of 1987 was only 9 percent below the 1980 figure. For autos the ratio moved in favor of domestic producers with the import-to-domestic ratio up 10 percent.


