

Following the Global Financial Crisis of 2007–09 (GFC), regulators across the world enacted regulations to repair and strengthen financial markets. These regulations included a mandate to have more financial market contracts be cleared through central counterparties (CCPs), which are financial institutions that guarantee the performance of contracts.1 As a result, the central clearing of derivatives transactions increased significantly, and so did the allocation of capital to support this activity in line with regulatory requirements. If demand to centrally clear transactions continues to rise, will clearing firms have enough capital capacity to meet this new demand?
In this article, we examine this question by studying the evolution of capital allocated to derivatives clearing since the GFC by futures commission merchants (FCMs)—firms that are authorized to clear for products regulated by the Commodity Futures Trading Commission (CFTC) on behalf of their clients. We start by providing a general overview of the clearing ecosystem. Then we explain the capital requirements for cleared derivatives and how they have changed since 2008. Next, we compare the capital supporting derivatives clearing activity with general banking capital. Finally, we examine the excess capital (the difference in the capital available versus the capital required by the CFTC to support derivatives clearing) and assess how much capital capacity FCMs have to support an increase in such activity.2
We conclude that there is now less excess capital relative to the size of the client clearing business, as measured by the ratio of FCM excess capital to customer funds (also known as client assets), for the six largest FCMs (by customer funds held) that are subsidiaries of U.S. bank holding companies to support increases in derivatives clearing activity. This ratio has been trending down after the GFC; for instance, it dropped from 0.65 in mid-2009 to below 0.25 in early 2024. We also determine that based on the typical industry return on equity for the biggest banks (approximately 12%), the largest FCMs (by client assets held) would require annualized returns of 0.96% on client assets held if capital has to increase to meet regulatory requirements in order to support greater client clearing activity. Importantly, because many FCMs are expected to support securities clearing activity that is also subject to capital requirements, these constraints may pose challenges for their capacity to expand central clearing of U.S. Treasury transactions. Such central clearing activity is anticipated to increase once the new U.S. Securities and Exchange Commission’s (SEC) clearing mandate is fully implemented by the end of 2026.
What is the clearing ecosystem?
Market participants can clear contracts either directly as clearing members (CMs) of a CCP or indirectly as clients of CMs. Not all CMs clear trades for their clients, but the ones that clear for products regulated by the CFTC are registered as FCMs, while the CMs that clear for products regulated by the SEC are registered as broker-dealers. An illustration of the clearing ecosystem is depicted in figure 1, where CM A and CM B clear for clients, while CM C and CM D do not.3
1. Clearing ecosystem

Source: CCP Global.
As more contracts have been cleared in the U.S., the absolute amount of collateral supporting cleared contracts in the U.S. has grown substantially and the clearing ecosystem has become more concentrated among a smaller group of FCMs. Moreover, when a financial market is concentrated in a small number of firms, the failure of one or more firms can raise potential financial stability risks. Such risks can be mitigated by ensuring firms (i.e., CCPs’ clearing members and their clients) have sufficient capital to support cleared contracts—in particular, to absorb losses during financial stress events.
What are the capital requirements for FCMs that clear derivatives?
For FCMs, the capital requirements are set forth by the CFTC and are referred to as the net capital requirement. In general, FCMs are required to hold 8% in capital relative to the initial margin (IM) for cleared derivatives.4 Prior to October 6, 2021, FCMs held 4% and 8% in capital relative to noncustomer IM (i.e., for proprietary, or “house,” activity) and customer IM, respectively; and prior to August 31, 1998, FCMs held 10% in capital relative to customer IM.5
Part of the rationale of tying the net capital requirement to IM is that IM is seen as the measure of risk being managed by the FCM. Specifically, CCPs require collateral in the form of IM large enough to cover changes in valuations with 99% or higher probability. Therefore, as the amount of risk as measured by IM increases, the FCM needs to increase net capital to support its clearing activities; through this link, the net capital requirement is loosely correlated with the level of risk. Given that many FCMs have historically been subsidiaries of banks, the 8% ratio of net capital to customer IM aligns with the Basel II framework’s guideline for holding bank capital against risk-weighted assets, as proposed by the Bank for International Settlements (BIS) in July 2005 and made effective in the U.S. on April 1, 2008.
FCMs and their parent entities may also be subject to capital requirements from other regulators.
- FCMs that are also registered as broker-dealers with the SEC to clear securities transactions need to meet the capital requirements set by Securities Exchange Act of 1934 (SEA) rule 15c3-3. This rule requires that broker-dealers must at all times have and maintain net capital at specific levels to protect customers and creditors from monetary losses that can occur when firms fail. In this context, net capital can be best defined as the amount of the broker-dealer’s assets that exceed its liabilities.
- FCMs may be subsidiaries of banks. In such cases, the parent bank will be subject to capital requirements set by the BIS to ensure the bank has funds to absorb losses and can weather financial stress events. Such bank capital is referred as tier 1 capital. In relation to cleared derivatives, the Basel III framework provides the new and revised guidelines for capital requirements for bank exposures to central counterparties.6 Banks must apply a 2% risk weight to both house positions (when the bank is acting as a clearing member of a CCP) and client positions (when the bank guarantees performance of clients’ contracts to the CCP).
- Banks also need to maintain capital for their exposures to their FCMs’ client default risk and the risk from other CCP clearing members defaulting or becoming insolvent.
Differences in FCM and bank capital rules for client clearing activity
The CFTC’s requirements use the customer funds (i.e., the collateral from customers to meet IM requirements) as a proxy for risk. As mentioned previously, the FCM’s net capital requirement is set at 8% of client assets, so it grows linearly with client asset size. The bank regulatory capital framework under the Basel III regime, in contrast, is more focused on ensuring that banks have sufficient tier 1 capital to absorb potential mark-to-market losses in excess of collateral. The calculation of the tier 1 requirement is much more complicated and not directly linked to the customer fund size. Therefore, it is difficult to compare these two capital rules, and the difference in required net capital between them can vary significantly with different client portfolios. Specifically, Roberson (2018) found a substantial dispersion in credit risk estimates between the Basel Standardized Approach for Counterparty Credit Risk (SA-CCR) and the IM methodologies of CCPs. This finding raises a very important question about how to interpret the large discrepancy between the two capital rules given that they are both serving a similar purpose, i.e., to address credit risk related to client clearing activities, although they are based on different policy objectives.
Despite the different capital rules, the binding net capital requirement is the amount compliant with all applicable regulators of an FCM. For bank-affiliated FCMs, which are usually registered as broker-dealers as well, client clearing activity is but one component of their overall operation. For example, J.P. Morgan Securities serves as an FCM, providing clearing and execution services for derivatives trading, but these services are integrated within their broader financial services for clients. Bank-affiliated FCMs like J.P. Morgan Securities generally benefit from the financial strength and capital resources of their parent organizations, which allow them to provide clients with integrated solutions across trading, clearing, custody, and financing. Therefore, FCMs that are subsidiaries of banks often need to maintain substantially higher net capital levels compared with the CFTC’s required net capital levels because they must simultaneously comply with CFTC regulations and the SEC net capital requirement, plus more-stringent banking regulations.
How FCM capital levels have changed since the GFC
For our analysis of the evolution of FCMs’ net capital levels since the GFC, we used the CFTC’s monthly financial reports for FCMs. We categorized FCMs by the size of their required net capital (see figure 2 for details) and by whether or not they were also broker-dealers. The amounts of net capital at FCMs based on these categorizations are depicted in figure 2.
2. Net capital for joint broker-dealer FCMs and sole FCMs, by required net capital size, 2008–24
A. Joint broker-dealer FCMs
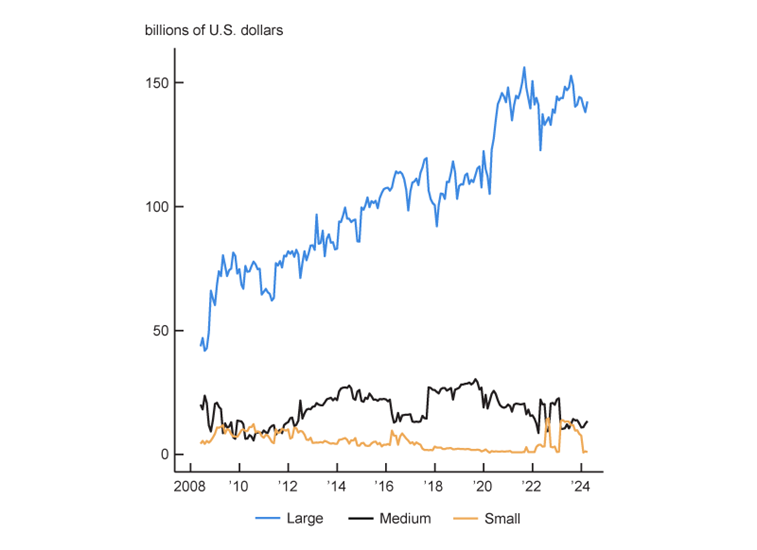
B. Sole (non-broker-dealer) FCMs
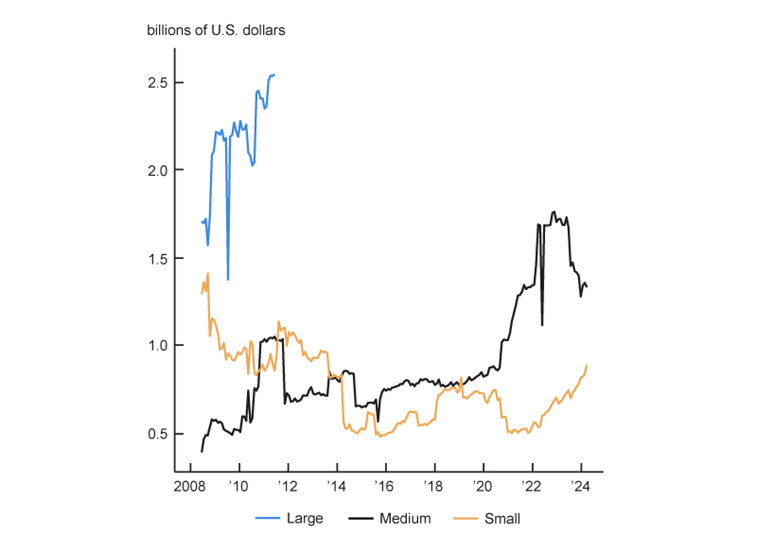
Source: Authors’ calculations based on data from the Commodity Futures Trading Commission.
Based on figure 2, panel A, it is evident that the large FCMs that are also broker-dealers have the dominant share of net capital. Their amount of net capital has increased by roughly three times since 2008. For small and medium FCMs that are also broker-dealers, their respective net capital amounts have fluctuated at times, but they have not increased that much since 2008.
For FCMs that are not broker-dealers, the change in net capital since 2008 has been different, as shown in figure 2, panel B. Specifically, medium non-broker-dealer FCMs’ net capital has increased since then, with larger jumps happening after the 2020 Covid-19-related financial stress, while small non-broker-dealer FCMs’ net capital has been relatively stable. The net capital of large FCMs that are not broker-dealers has largely dropped off because nearly all of these institutions have also become broker-dealers.
Analysis of capital levels for large broker-dealer FCMs and bank holding companies
The large broker-dealer FCMs in figure 2 are predominantly subsidiaries of bank holding companies—many of which are designated as global systemically important banks (G-SIBs). To better understand the evolution of net capital for bank-affiliated FCMs, we compared it with the evolution of tier 1 capital for G-SIBs. Figure 3 shows increases in net capital allocated by parent banks to FCM activities alongside increases in tier 1 capital of G-SIBs between 2008 and 2024. Net capital for bank-affiliated FCMs jumps up in 2020 and remains elevated through 2024. The increases in FCM net capital since 2020 are linked to large increases in initial margin requirements in response to Covid-19-related market volatility, which in turn increased the required amount of net capital held by FCMs.
3. Net capital for large bank-affiliated FCMs and tier 1 capital for G-SIBs, 2008–24
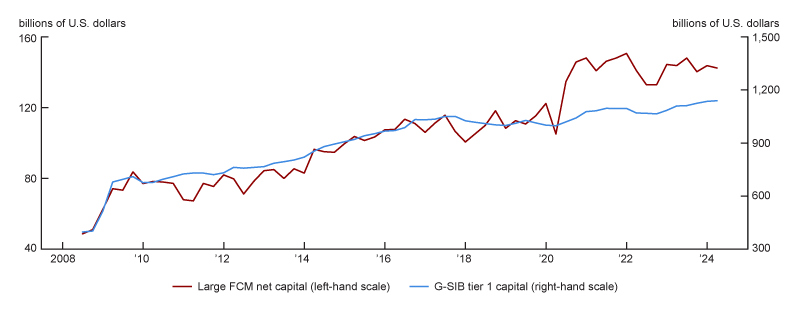
Sources: Authors’ calculations based on data from the Commodity Futures Trading Commission and S&P Global, S&P Capital IQ.
A shown in figure 3, net capital at the large bank-affiliated FCMs has grown roughly threefold since 2008, which is mostly consistent with client assets having increased by almost two and a half times between 2007 and 2023. The growth in client assets is attributable to over-the-counter (OTC) clearing mandates, as well as increases in open interest7 cleared at the CCPs and post-GFC regulatory requirements that have made risk-management standards more stringent. For example, after the GFC, the CFTC required FCMs to adopt more-conservative management practices of customer funds and CCPs had to meet a higher confidence level for initial margin requirements.
To gauge risk managed by the FCMs relative to their net capital, we calculated the ratio of client assets to FCM net capital and plotted the results in figure 4, using the same FCM categories as in figure 2. It is evident in panel A of figure 4 that large and medium broker-dealer FCMs had much higher ratios of client assets to FCM net capital in 2024 than in 2008. This implies there is less net capital in excess of the net capital required by the CFTC to support increased client activity, particularly for large broker-dealer FCMs. Notably, as shown in panel B of figure 4, for non-broker-dealer FCMs, the ratio of client assets to FCM net capital has been relatively stable over the 2008–24 period and is much higher than this ratio for broker-dealer FCMs; this is mainly due to the fact that non-broker-dealer FCMs need to hold net capital to meet only the requirement of the CFTC, rather than the requirements of multiple regulators (including the CFTC), like broker-dealer FCMs need to.
4. Ratio of client assets to net capital for joint broker-dealer FCMs and sole FCMs, by required net capital size, 2008–24
A. Ratio of client assets to net capital for joint broker-dealer FCMs
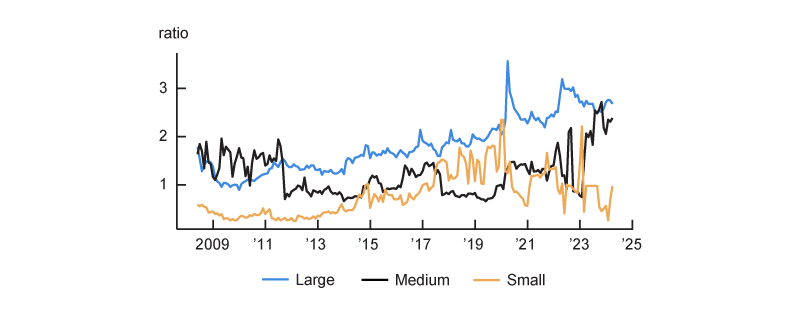
B. Ratio of client assets to net capital for sole (non-broker-dealer) FCMs
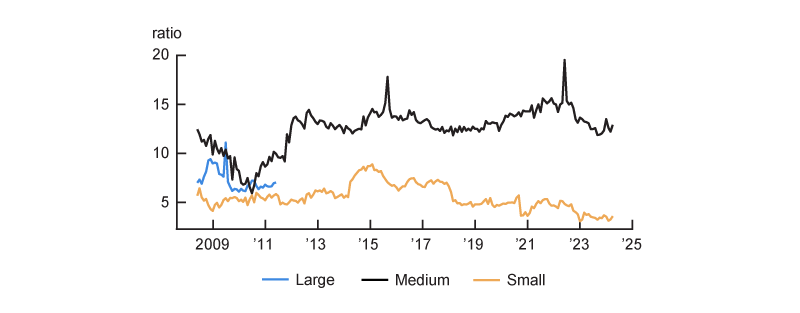
Source: Authors’ calculations based on data from the Commodity Futures Trading Commission.
Top six FCMs affiliated with U.S. G-SIBs
G-SIBs with subsidiary FCMs play a key role in central clearing. Based on the data published by the CFTC, the top six FCM subsidiaries of U.S. G-SIBs, as measured by client assets held in March 2024, accounted for around 55% of client clearing assets for futures and options and over 84% for swaps.8 The orange line in figure 5 shows the history of the ratio of FCM net capital required by the CFTC for client clearing to the actual net capital for these top six FCMs. As we mentioned previously, bank-affiliated FCMs hold more net capital than what the CFTC requires because the vast majority of these FCMs are also broker-dealers and need capital to support SEC-regulated activity. This ratio has in fact been gradually trending upward since OTC clearing became mandatory for certain classes of OTC derivatives in the U.S. in 2013. As of March 2024, this ratio was around 0.25 for the top six FCMs, and it was over 0.30 during the Covid-19 crisis—generally much higher than before 2014. Therefore, while we have observed a significant increase in clearing activity since the GFC, there does not appear to be similar growth in net capital for those bank-affiliated FCMs. Furthermore, the amount of net capital held at the top six FCMs in excess of the amount of net capital required by the CFTC has trended lower relative to customer funds. The blue line in figure 5 presents the ratio of FCM excess net capital to customer funds, which has been trending down after clearing for certain swaps became mandatory in 2013. The ratios plotted in figure 5 imply that while the U.S. G-SIBs maintain excess net capital in their FCM subsidiaries, these banks are less willing or able to keep excess net capital in their FCMs in recent years—i.e., FCMs’ capacity to grow client clearing is constrained by their available net capital.
5. Ratios related to net capital and customer funds for client clearing for the top six FCM subsidiaries of U.S. G-SIBs, 2008–24
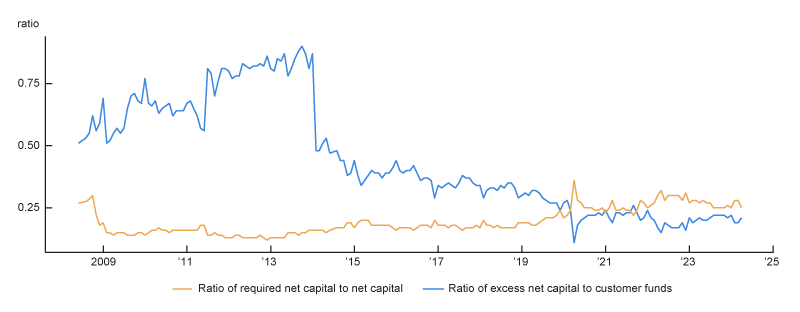
Source: Authors’ calculations based on data from the Commodity Futures Trading Commission.
In figure 6, we show the net capital of the same G-SIB-affiliated FCMs from figure 5 and the tier 1 capital of their parent banks, all normalized to their values at the end of the second quarter of 2011. Notably, before the Covid-19 crisis, net capital and excess net capital for these FCMs were growing at nearly the same rate as parent banks’ tier 1 capital. On the one hand, FCMs’ net capital more than doubled between 2008 and 2020, consistent with the growth of their parent banks’ tier 1 capital over the same period. On the other hand, FCMs’ required net capital grew slowly in the wake of the GFC (even lagging behind their parent banks’ tier 1 capital growth rate in 2009). After the Covid-19 market stress, as customer funds held by FCMs rose significantly, their required net capital increased much faster than banks’ tier 1 capital. Figure 6 illustrates that while bank-affiliated FCMs have been managing more risk from their clients’ clearing activity in the wake of the Covid-19 crisis, their parent banks’ tier 1 capital levels have not increased at the same rate.
6. Comparison of net capital of the top six FCM subsidiaries of U.S. G-SIBs and tier 1 capital of the parent banks, 2008–24
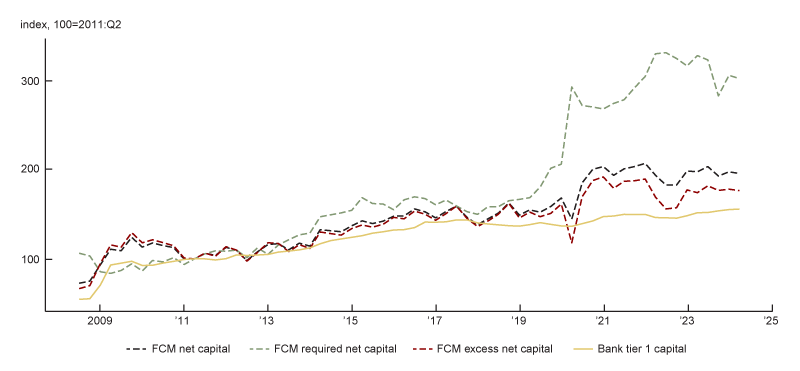
Sources: Authors’ calculations based on data from the Commodity Futures Trading Commission and S&P Global, S&P Capital IQ.
Banks publish their required capital levels quarterly based on banking rules, yet they do not report the specific capital levels required for their FCMs’ client clearing business in isolation. Therefore, there is limited public data available to estimate the tier 1 capital required by regulators for the client clearing business (including for the top six FCM subsidiaries of U.S. G-SIBs). However, according to a January 2024 report from the FIA (Futures Industry Association), as of June 2023, the sum of all those six G-SIBs’ required tier 1 capital based on bank capital rules that is attributable to client clearing activity totaled about $8.96 billion, which is much smaller than the CFTC’s required net capital amount of roughly $27 billion for their FCM subsidiaries. As we mentioned previously, the discrepancy is generally due to the difference in the two regulatory objectives when establishing net capital requirements. Nevertheless, the much higher level of net capital required by the CFTC would be the binding constraint for these FCMs.
Why has net capital in excess of the CFTC requirement decreased at FCMs?
Figure 5 illustrates that the ratio of total FCM excess net capital to total customer funds has been decreasing since the GFC, dropping from 0.65 in mid-2009 to below 0.25 in early 2024. Why has net capital held in excess of the regulatory minimum requirements at the FCMs diminished? One apparent reason is the reduction in the number of FCMs. Since 2008, there have been notable bankruptcies or crisis-induced mergers of parent entities of larger FCMs—including, but not limited to, Bear Stearns, Lehman Brothers, MF Global, and Credit Suisse. Consolidation has decreased the number of entities that provide client clearing as mentioned in Patel (2024). There have also been FCMs that left the clearing business as profit margins shrank because of one or more of these factors:
- New regulatory requirements as well as existing requirements becoming more stringent,
- Higher regulatory minimum requirements for net capital, and
- Lower returns on assets due to the zero interest rate policy (ZIRP) environment.9
At the same time, the demand for client clearing services has grown. Generally, the growth in such demand is attributable to OTC clearing mandates, as well as increases in open interest cleared at the CCPs.
If large FCMs need to increase their net capital in the future to meet regulatory requirements that support more client clearing, they would need to justify a net capital increase by ensuring returns on the deployed equity were sufficient. Based on our calculations using data from S&P Capital IQ, the bank parents of the six FCMs referenced in figure 6 have averaged about a 12% return on equity since the GFC. So, to support additional capacity to clear more client contracts at CCPs, these FCMs, which are bank subsidiaries, would need to earn an annualized rate of 0.96% on assets held for initial margin on behalf of their clients.10 Therefore, these and other FCMs will likely need to charge higher fees to earn the expected return on equity, limit growth in client clearing, or reduce clearing services for less profitable clients (or pursue some combination of these approaches). Alternatively, clients may choose to directly clear contracts with a CCP; however, this would remove a layer of risk management and FCM capital that currently exists when FCMs serve as intermediaries to a CCP for their clients.11
Conclusion
In this Chicago Fed Letter, we found that immediately after the GFC, the CFTC’s net capital requirement was not a big constraint on clearing derivatives because large FCMs held a lot of capital in excess of what the CFTC required for client clearing. However, these FCMs’ net capital in excess of the CFTC’s required minimum is now a lot smaller. So, in the years ahead, FCMs will need to justify their need for higher amounts of capital if they want to do more clearing business. This will likely mean FCMs’ clients will face higher costs for having their contracts cleared by FCMs.
The SEC’s U.S. Treasury clearing mandate will increase clearing activity and related client assets for initial margin. Therefore, to meet the objectives of the mandate to clear more U.S. Treasury transactions at a CCP in the coming years, either there will need to be enough profit for G-SIB parents of the largest FCMs to cover the expected return on equity of approximately 12% or medium and small FCMs will need to increase their capital capacity to support the expected growth in initial margin.
We thank Sean Wijesekera, of the Federal Reserve Board, for his research data assistance. We are also grateful for the helpful comments from Geoff Harris, Cindy Hull, and Michael O’Connell, of the Federal Reserve Bank of Chicago; Pat Parkinson, of the Bank Policy Institute; Ray Kahn, of Archon Advisors; Ulrich Karl, of ISDA; and Aaron Brown, of Citibank.
Notes
1 See Steigerwald (2013) for a primer on central counterparties and central counterparty clearing.
2 While excess capital could be deployed for multiple purposes, we have assumed that it would primarily be used to facilitate clearing for FCMs’ clients because such clearing is a major business line for FCMs.
3 Please note the illustration is simplistic, as a clearing member may have more than one client and a given client may use multiple clearing members to clear contracts.
5 See pp. 4–5 of this April 2001 report from the CFTC Division of Trading and Markets.
6 There may be regulatory requirements from the supplementary leverage ratio (SLR) and global systemically important bank (G-SIB) surcharges that may indirectly increase a bank’s required capital for cleared derivatives.
7 Open interest is the total number of unsettled outstanding derivatives contracts (such as options or futures) for an asset. The CFTC provides a more detailed definition of this term.
8 The U.S. G-SIB parents of the top six FCMs are Bank of America, Morgan Stanely, Citigroup, Goldman Sachs, J.P. Morgan, and Wells Fargo.
9 See this CFTC Q&A, Thomson Reuters Practical Law Finance (2013), and Lukken (2019).
10 The CFTC requires 8% in net capital relative to client assets. To derive the necessary earn rate for every dollar of initial margin, we multiply the 12% return on equity with that 8% (ratio of net capital to client assets) requirement to get that rate of 0.96%. This assumes the capital required at the FCM is consolidated at the parent entity level.
11 See section 2 of this November 2018 report from the FIA.


