

The following publication has been lightly reedited for spelling, grammar, and style to provide better searchability and an improved reading experience. No substantive changes impacting the data, analysis, or conclusions have been made. A PDF of the originally published version is available here.
Crude oil prices are up about 50% since late last year. Increasing demand has combined with temporary disruptions of supply and OPEC’s renewed effort to assert greater control over world oil supplies. The result: Consumer prices for oil-based products have moved sharply higher. Food prices also rose at a robust pace recently. That surge is largely in response to curtailed supplies after last summer’s drought.
Neither development is pleasant news to those standing the inflation watch. With consumer prices in April 1989 more than 5¼% above a year ago, compared with a 3¼% gain during the April 1987/April 1988 period, policymakers are worried about a jump in inflation.
The situation may not be as dire as it appears. The pressures leading to increased prices are real, but there are factors in place in the economy that will mitigate some of these recent upward pressures on prices.
Short-term shocks in oil
Short-term supply shocks have dominated oil prices during the past six months. As measured by the spot price for West Texas crude, prices increased about 67% from early October 1988 to mid-April 1989, before easing somewhat.
The initial development was the December 1988 OPEC agreement to limit the cartel'’s aggregate oil output to 18.5 million barrels per day (b/d) during the first six months of 1989—a volume that they expected would maintain crude prices around a target $18 per barrel (p/b). At the time western oil-market analysts expected that OPEC would have no better luck holding to this agreement than they have with similar agreements in recent years.
In early 1989 oil prices moved above the $18 p/b target. But to credit the OPEC agreement for the increase does not do justice to the facts. The strength of OPEC'’s resolve had not been tested and in June they were once again faced with negotiating a production and price agreement. Quite independent of OPEC'’s attempt to control production, a series of disruptive supply shocks hit during 1988 and the first half of 1989.
Britain’s North Sea oil production was the source of several disruptions. Crude production had not yet recovered from the Piper Alpha platform explosion in July 1988 (which cut U.K. production by 300,000 b/d) when in late December and early January of this year accidents at other platforms cut production an additional 300,000 b/d. Then in mid-April a fire at the South Cormorant Alpha platform forced the closing of that facility. More importantly, that fire also meant that crude piped through South Cormorant Alpha from several other fields was stopped. U.K. North Sea production, which had been at 2.5 million b/d in early July 1988 was cut to 1.6 million b/d by mid-April of this year.
Closer to home, the Exxon Valdez oil spill in Prince William Sound, Alaska, on March 24 caused the temporary closing of the Valdez shipping facility and the temporary loss of access to one-quarter of U.S. domestic crude production. Then, in mid-April, a Chevron refinery fire in California threatened fuel supplies on the West Coast until adjustments in alternate refinery capacity were arranged.
Oil markets responded quickly to these developments. Oil prices rose to more than $24 p/b (spot price for West Texas crude) on April 20 before settling around $20 p/b by early June. Product prices followed and the consumer price index registered an upward surge.
The situation stabilizes
Currently, Alaskan oil production is back on track and North Sea oil shipments are expected to be close to normal in the third quarter of this year. OPEC production has been reported to be in excess of their 18.5 million b/d ceiling, with the excess going into storage. OPEC will likely continue to be faced with internal pressures to increase, or cheat, on its production quotas.
In short, barring additional short-term disruptions in the oil market, the near-term outlook for the oil price impact on inflation appears to be for modest downward pressure on prices. The expected slowdown in growth in late 1989 and 1990 in the industrial world appears to complement these supply conditions.
Conservation goes soft
If the near-term oil picture looks good, the longer-term view is not so rosy. Placed in historical perspective, the current energy outlook contains some disturbing elements.
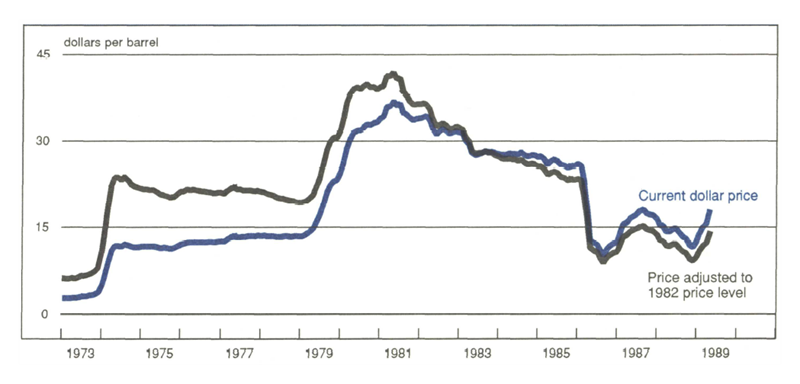
The sharp increase in petroleum prices in 1973-1974 abruptly caught the attention of the world’s economies (see figure 1). Their considerable dependence on oil was forcefully made clear. Oil conservation began in short order.
1. Oil prices: After recent rise, still cheap
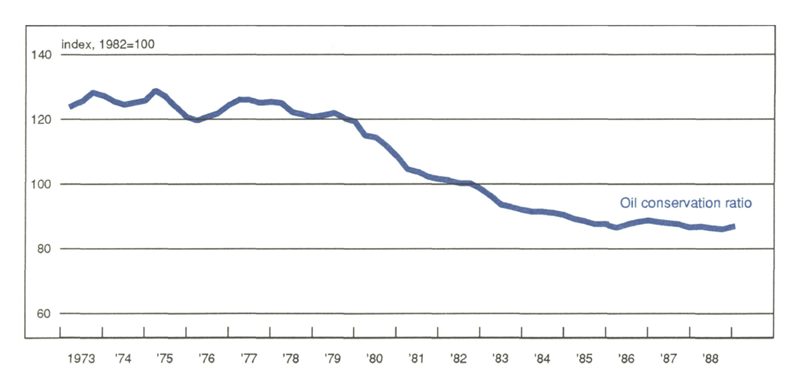
Early on, the “oil-conservation ratio”—a ratio of oil consumption to real GNP—declined only modestly in the U.S. From 1974 through 1979 the ratio declined, i.e., there was an increase in oil-use efficiency, less than ¼ of a percentage point per quarter, on average. Oil conservation accelerated late in the decade as the lagged response to the higher real cost of energy fed through the economy.1
Conservation efforts were spurred on by the oil price surge in 1979-1980. The ratio began to decline (improve) 1⅓ percentage points per quarter (see figure 2).
2. Oil-use efficiency: After big gains, a leveling-off
By late 1985, oil prices were declining sharply. World oil consumption had dropped. Aggregate consumption by the largest oil consumers—the U.S., the U.K., West Germany, and Japan—was down 10% from 1974 levels. Non-OPEC crude oil production was increasing and OPEC’s influence in the market was on the wane. By the end of the third quarter of 1986 the inflation-adjusted price of crude was the lowest it had been since the fourth quarter of 1973 (see figure 1). While prices moved upward thereafter, the inflation-adjusted price of crude oil remained well below 1974 levels.
With the relaxation of price pressures that promoted continued oil conservation, the consumption efficiency gains tended to level off. In the U.S., except for modest quarter-to-quarter fluctuations, the oil conservation ratio remained virtually unchanged between mid-1985 and the end of 1988. The end of those gains, which in part offset the increase in oil use due to GNP gains, bodes ill for longer-term increase in oil prices.2
Food prices and the drought
Drought conditions were not confined to the U.S. in 1988. Major agricultural areas throughout the world suffered moisture shortages—in particular, Australia, Canada, and large areas in South America. In anticipation of a reduction in food supplies, prices of farm-grown commodities began increasing more rapidly in late spring of 1988. Major concerns were what impact an acceleration in commodity prices at the farm level would have on the overall rate of inflation and for how long.
The relationship between changes in farm-level prices and price changes at the supermarket is not one-to-one. On average, the farm-value component of the retail food market basket makes up about 31% of the total. Furthermore, in terms of the general price level, as measured by the consumer price index, the food price component of the overall consumer market basket is about 10%.
Consequently, even a substantial increase in prices at the farm gate, other things remaining the same, should result in a far less substantial impact on overall consumer prices. Of course, other things do not remain the same. Throughout the food processing-to-retail chain, sales margins are maintained. Thus, the "“miracle of compounding"” at the various stages of the chain push final retail food prices up considerably more than the farm-share component would suggest.
The food-price component of the CPI moved up sharply during mid-1988 (see figure 3) with month-to-month changes moving out of the range observed during most of the 1980s—even that of the 1983 drought. The exception is the food price surge in late 1980 and early 1981. That period also recorded a drought, but more important in terms of food prices was the considerably more rapid price gains recorded in the nonagricultural component of food prices—gains that were more closely tied to the general surge in inflationary pressures during that period than to higher prices at the farm gate.
3. Food prices: After droughts, upticks are usually brief

The impact of drought on food prices and on the general rate of inflation has typically been short-lived. Key ingredients are the duration of the drought and the level of pre-drought inventories. In the current environment, both ingredients come heavily into play. Inventories were large going into the 1988 drought but there has been a substantial draw-down in inventories, especially for grain. At the beginning of the current crop year, soil moisture conditions were unfavorable throughout much of the corn and wheat belts. Consequently, concern in the industry about a continuation of the drought through the 1989 season has been at a high level.
In part this anticipation of unfavorable 1989 crop conditions contributed to the renewed uptick in the food price index early this year (see figure 3). More importantly however, the surge reflects sharp price gains for eggs, vegetables (fresh and processed), fresh fruits, and poultry-gains largely attributable to the lagged effects of last year’s drought.
For the next several months, until harvest of the major food, feed, and fruit/vegetable crops is completed, apprehension about the adequacy of available supplies for domestic and export markets will exert continued upward pressure on the food price component of consumer prices. But, even if dry weather persists and crop yields are cut below normal, the impact on production, and thus prices, will be lessened somewhat by the increases in planted acreage expected for vegetables and field crops.
Conclusion
The increase in the rate of inflation in the U.S. economy during the past year has prompted policymakers and economists to search various sectors of the economy for an explanation of what was happening. Where were these increases originating and were the increases temporary “blips” that would shortly feed through the system and be gone? Or were they increases that were likely to be built into the economic structure and as a consequence be more difficult to contain? These upward price pressures were most noticeable in the energy and food sectors.
In both of these sectors the economy has experienced short-term direct price shocks—a sharp increase in crude oil prices and a drought-influenced increase in food prices. However, barring additional shocks, in both cases it appears that the surge in prices has run its course.
All is not necessarily well, however. There are indirect and longer-run inflationary risks that the economy faces. Specifically, the recent increase in demand for petroleum, derived from continued economic growth in conjunction with a deterioration in oil consumption efficiency, may make it easier for the major oil producers to raise prices.
MMI—Midwest Manufacturing Index: Current expansion
Several modifications have been made to the MMI since the April issue. The first and most substantive change is the use of new models for calculating movement in manufacturing activity since 1986, which greatly improved the accuracy of the index (see the July/August 1989 issue of Economic Perspectives).
A second change is the use of January 1983 as the base period of comparison. Shifting the base period from 1973 to 1983 facilitates comparison of the MMI with the nation since the onset of the current expansion. A U.S. version of the MMI is also introduced in this issue in place of the Federal Reserve Board’s Index. The USMI uses the same methodology as the revised MMI.
Notes
1 It is important to recognize that it was higher real oil prices, beginning late in 1973 and extending through the first half of the 1980s, to which the economy responded. Real prices throughout this period were well above current levels.
In terms of an adjustment to changes in oil prices the economy currently remains in the midst of an adjustment to the lower real oil prices of the post-1985 period. At current levels they are not likely to result in an upward structural shift in inflation. This is so even though current nominal prices are higher than at any time prior to late 1979 and are substantially higher than during most of the past three-and-one-half years.
2 If longer-term real oil prices resume an upward trend a resumption in efficiency gains might be expected.


