The following publication has been lightly reedited for spelling, grammar, and style to provide better searchability and an improved reading experience. No substantive changes impacting the data, analysis, or conclusions have been made. A PDF of the originally published version is available here.
What protection teaches us, is to do to ourselves in time of peace what enemies seek to do to us in time of war.
—Henry George
The barriers to free trade during times of war are quite simple. Both legislative and physical blockades impede the flow of goods on the international scene. The limits on free trade in times of peace, however, are more subtle. Trade restraints between countries throw up a kind of wall that prevents producers on each side of the border from specializing in what they do best while encouraging them to engage in tasks to which their location and skills are ill-suited. Consequently, consumers pay dearly in terms of higher prices and lower real wages.
Long distances between regions and countries and other physical barriers, such as the Berlin wall, are almost identical in effect to tariff walls. Absent such walls, production specialization and the flow of trade between neighboring regions is often extremely large. For example, trade between the Great Lakes region and Canada has been historically heavy despite intermittent legislative barriers to trade and investment.
For this reason, the recent lowering of impediments to trade and investment between the U.S. and Canada will especially encourage growth in the Great Lakes region—where the “natural wall” of distance is already low. This Fed Letter describes the close economic relationship of the binational Great Lakes region and the prospects for even closer trade linkages.
Trade agreement
Owing to climate, latitude, and a common border that stretches some 4,000 miles from east to west, Canada’s locus of economic activity has always been situated along the U.S. border. Accordingly, the natural axis of trade has always been from north to south rather than east to west. Nonetheless, Canada has tried to encourage east-west domestic trade, first by subsidizing cross-continent transport systems and, from time to time, by erecting legal barriers to trade between the U.S. and Canada.
In the 1970s, for example, Canada became anxious about the large ownership of business establishments by the U.S. and other foreign nations, particularly the titles to Canada’s rich, domestic petroleum and natural gas holdings. As a consequence, foreign ownership in Canada was discouraged through the creation of the National Energy Program and Foreign Investment Review Agency. These programs limited and scrutinized foreign investment and ownership. (Both have since been discontinued or redirected).1
In the trade arena, tariffs between the two nations have been generally falling during the last 40 years, largely the result of multilateral negotiations that have been reached though the General Agreements on Tariffs and Trade (GATT). By the mid-l980s, tariffs on all traded goods have been estimated to be below 4% on average, with U.S. tariffs on Canadian imports generally slightly below Canada’s.
The Free Trade Agreement (FTA), effective January 1, 1989, lowers or eliminates trade and investment barriers between the United States and Canada. Its main objectives were:
- to eliminate tariffs on traded goods and lower nontariff barriers to both goods and service flows;
- to liberalize regulations covering direct investment flows;
- to loosen restrictions on the sales of services and cross-border business travel; and
- to settle trade disputes through effective and impartial procedures.
The FTA will mostly eliminate tariffs on all traded goods within 10 years. To ease the transition and employment dislocations that free trade will cause on both sides of the border, the FTA “phases in” the process of tariff elimination in a three-part schedule over 10 years. Many nontariff barriers including quotas and direct export subsidies are also to be eliminated.
Prior to the ongoing Uruguay round of GATT, nondiscrimination in international services trade had not received much attention. In this regard, the FTA represents a significant breakthrough in constructing a framework for the free trade of services. The underlying principle is based upon the national treatment of services provided from abroad. Canada and the U.S. will not discriminate in their future treatment or regulation of most services. Some exceptions are transportation, basic telecommunications, medical, dental, childcare, education, and social services. Of course, Canada could choose, for example, to discriminate against a particular service provided by a foreign firm so long as that domestic service industry is treated identically.
The FTA also reduces the screening or review of U.S. investment in Canada. The U.S. did not have such screening in place so that U.S concessions on investment review are very modest. Across the border, Canada will continue to significantly ease its scrutiny of U.S.-owned assets in Canada, much as it has already done during the 1980s. In sum, the provisions of the agreement aim to create a stable and open business environment for cross-border trade and investment.
Great Lakes locus
Many believe that the FTA will have only a modest impact on trade and direct investment flows between the U.S. and Canada. This is so because tariffs are already low and because Canada is a small country in relation to the U.S.—roughly one-tenth the population. However, Canada’s proximity, industrial structure, and common culture suggest otherwise. U.S. exports to Canada (concentrated in durable manufactured goods such as machinery and equipment) accounted for 22% of exports or $79 billion in 1989, the largest share for any single nation. In return, Canada tends to export, in addition to manufactured goods, a rich mixture of raw materials such as energy products, minerals, and lumber to the U.S. Canadian exports to the U.S. comprised 75% of its exports in 1989 and, more importantly, 27% of its GNP.
Likewise, Canada’s proximity, language, and culture have stimulated heavy bilateral foreign direct investment flows. In 1986, the U.S. maintained a controlling interest in 34% of Canadian manufacturing output. And although Canada’s foreign direct investment (FDI) in the U.S. amounts to a much smaller share, Canada’s per capita FDI in U.S. manufacturing exceeds that of the U.S. counterpart in Canada. Accordingly, marginal expansion of trade and investment flows between these two nations are estimated to have a significant effect on each nation’s economic welfare.2
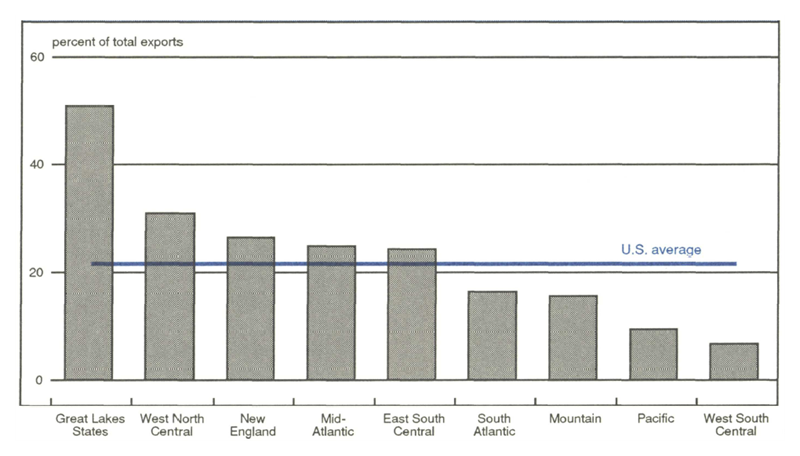
Linkages between the Great Lakes states and Canada are stronger still. Exports from the Great Lakes states to Canada, mostly manufactured goods, comprised an estimated 54% of the region’s exports in 1989 and led all other regions. (See figure 1.) In return, Canada exports newsprint, pulp, and other wood products, as well as natural gas and crude petroleum, in exchange for machinery, computers, and communications equipment. Bilateral trade in autos and related parts is especially brisk. The Auto Pact of 1965 encouraged the tariff-free movement of cross-border trade in new autos and parts with provisions for minimum production requirements in Canada. Since its enactment, investment in Ontario by U.S. domestic automakers, and foreign makers as well, has increased. At the same time, Canada maintains the largest foreign direct investment position in the Midwest, despite a strong investment inflow from Japan during the 1980s.
1. Great Lakes lead: Regional exports to Canada

First year results
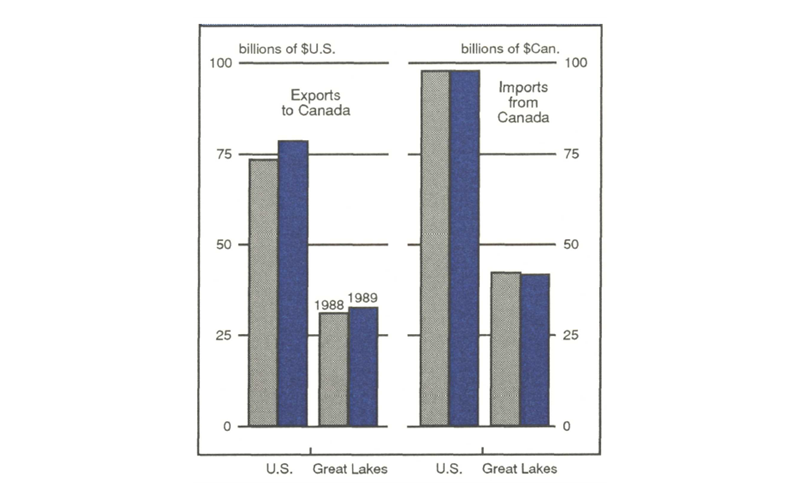
Last year marked the first full year that the FTA was in effect. By all accounts, the FTA is off to a quiet and modest start. (See figure 2.) Exports from the U.S. to Canada increased by 3% in 1989 over 1988. At the same time, imports from Canada remained almost flat. Trade performance in the Great Lakes paralleled the U.S., with exports edging up 1% and imports declining by 1%. Indeed, export declines were recorded by the states of Indiana, Ohio, and Wisconsin.
2. Moderate start for FTA

These modest changes can be explained in several ways. First, with respect to the FTA agreement itself, several features suggest a modest beginning. The tariff schedule of the FTA is being phased in over 10 years rather than immediately. This phasing was chosen to minimize dislocation effects on workers in both countries that might arise from factory consolidations. And, even if all FTA modifications had been immediate, trade relations take time to develop. For example, manufacturers who had never considered Canada as a market need time to develop suitable products, to locate customers in Canada, and to learn the procedures for exporting to Canada. In the U.S., state development agencies have acted quickly to promote exports to Canada by offering both workshops and monetary assistance to small firms.3
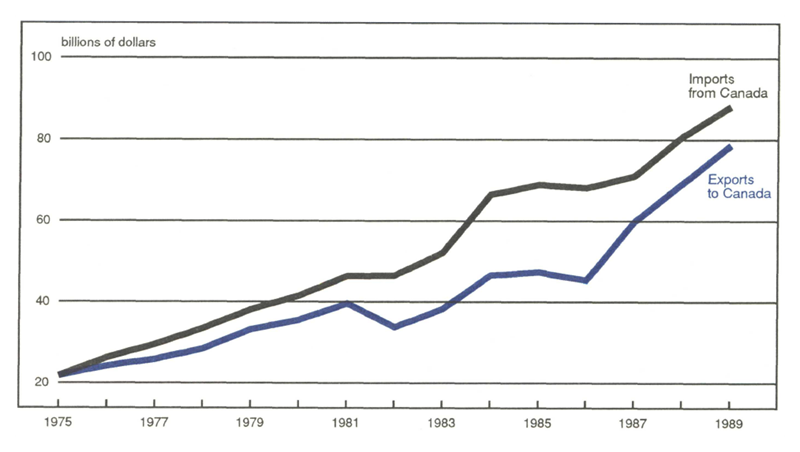
Moreover, in evaluating Canada-U.S. trade in 1989, it would be foolish to think that the FTA is the only force influencing the pattern of trade. At least two other factors have visibly affected U.S.-Canadian trade patterns in the past and merit consideration. (See figure 3.)
3. Success story: U.S.-Canadian trade

First, fluctuations in the business cycle are often coincident with a country’s imports from abroad. In the case of Canada and the U.S., business cycles themselves are often parallel so that bilateral trade rises and falls in step. During the recessions of the early 1980s, both imports and exports declined in real terms as the industrial economies of Canada and the U.S. faltered. Since then, economic recovery during the late 1980s has produced a resurgence of bilateral trade. In 1989, the economies of both countries slowed from 1988, contributing to an offset of the trade-enhancing impacts of the FTA.4
Movements in the price of foreign currencies—the exchange rate—also affect the patterns of trade. Portfolio capital flows between the U.S. and Canada are extremely heavy and sensitive to movements in interest rates which, in turn, affect the exchange rate. During the late 1980s, the price of U.S. currency for Canadian citizens fell, perhaps contributing to rising Canadian imports from the U.S. and stagnant exports to the States in 1989.
Toward the future
While the FTA has had only a quiet beginning, its prospects are significant. In the long term, it guarantees that the border will remain open to trade in goods and services and direct investment. Accordingly, businesses can plan on building long-term relationships that will not be easily disrupted. Export and investment abroad often requires long-term planning and investment. Over the next 10-20 years and more, these two trading partners will develop greater economic linkages that will benefit both parties. In some regards, the FTA can also serve as a prototype for further expansion of the “open market” concept to include Mexico and other Western Hemisphere countries.
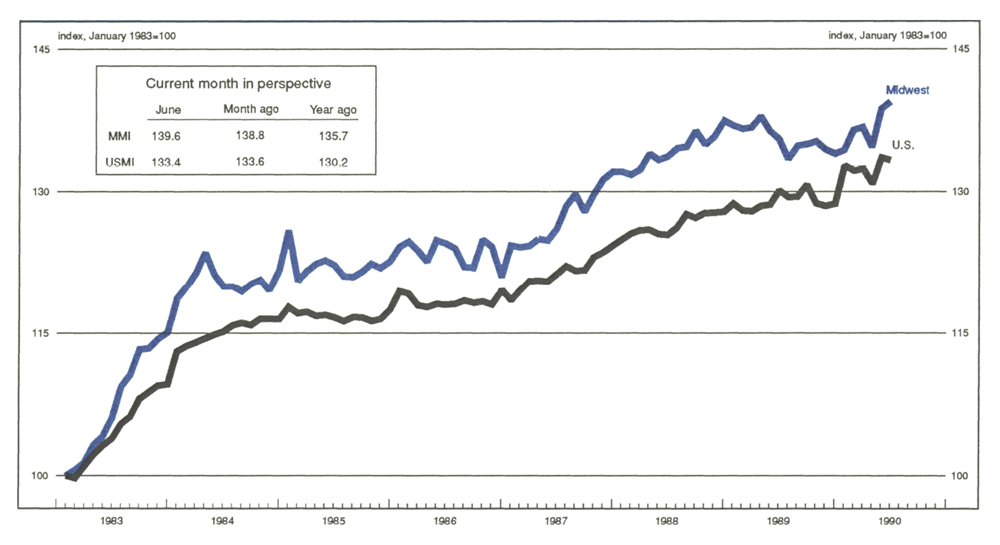
MMI—Midwest Manufacturing Index

Manufacturing activity in the Midwest continued its comeback, rising 0.5% in June over May. While the Midwest showed continued strength, manufacturing activity for the nation slowed down, decreasing by 0.2% between May and June. The MMI was bolstered by the chemical sector and consumer goods.
Over the past year, Midwest manufacturing outpaced the U.S., growing 2.9% compared to the nation’s 2.5% rise. For both areas, strength over the last year has come from the chemical and consumer sectors.
Notes
1 Of course, both countries have, at times erected barriers. For example. President Nixon imposed an across-the-board 10% import tariff in 1971 in an effort to deal with the “problem” of a U.S. trade deficit with Canada.
2 For one review of studies, see Government of Canada, Department of Finance, The Canada-US. Free Trade Agreement: An Economic Assessment, 1988.
3 See Teresa J. Taylor, Implementing the U.S.-Canada Free Trade Agreement: Steps Ahead and the Role of State and Local Governments, Northeast-Midwest Institute, March 1989; and Timothy McNulty, Overview of State and Local Trade Policy, Council of Great Lakes Governors, 1989.
4 On the case of Canada, a falloff in U.S. imports from Canada will, due to the relatively large size of the U.S., translate into a slowing of Canadian growth.


