The economic recovery in the Midwest gained some momentum during the latter part of 1992, and the region entered 1993 on a relatively strong note. Growth in housing activity, retail sales and industrial production gained momentum as 1992 came to a close, with relative strength exhibited in the Midwest during much of the year.
The following publication has been lightly reedited for spelling, grammar, and style to provide better searchability and an improved reading experience. No substantive changes impacting the data, analysis, or conclusions have been made. A PDF of the originally published version is available here.
The economic recovery in the Midwest1 gained some momentum during the latter part of 1992, and the region entered 1993 on a relatively strong note. Growth in housing activity, retail sales, and industrial production gained momentum as 1992 came to a close, with relative strength exhibited in the Midwest during most of the year. For much of the year, however, there was a noticeable difference between the improved results seen in these sectors and the lack of a recovery in estimates of payroll employment. Recently, however, estimates for Midwest employment have been revised upward. Focusing on available data sources, this Chicago Fed Letter will review the recovery path taken by the Midwest economy in 1992 and early 1993 and explore some of the reasons that may have accounted for the relative weakness in employment estimates as 1992 progressed.
Midwest recovery led the nation in 1992
Encouraging trends developed in housing activity, retail sales, and industrial production in the Midwest during 1992. A recovery was unmistakable in the housing industry, traditionally one of the most cyclically sensitive (and interest rate sensitive) sectors of the economy. Recent estimates from the National Association of Realtors show that existing single family home sales rose 12% in the Midwest Census region in 1992, after a modest gain in 1991. Activity surged as the year came to a close, and 1992 housing sales in the Midwest were noteworthy for having recovered all (and more) of their decline since 1988.
The turnover in existing home sales and the underlying demand for housing also translated into stronger new home construction in the Midwest. Housing starts rose 25% in the Census region in 1992, compared to 20% nationally, despite the fact that the recessionary decline was only half as severe here as in the nation as a whole. The recovery allowed starts in the Midwest to return to their previous peak; starts in the nation as a whole remained about 33% below their peak 1986 level. While results varied by market area, discussions with realtors and homebuilding associations in the Midwest generally supported the picture of a housing market gathering strength as 1992 progressed.
Strength in housing activity promoted above-average strength in retail sales in the Midwest in 1992, where consumer spending ended the year on a strong note. Government data on retail sales show better gains in most of the Midwest than in the nation during 1992 and into the fourth quarter, although pockets of weakness (notably in the city of Chicago) were evident in the data. Reports from large retailers and associations of smaller retailers generally suggested modestly stronger growth than the retail sales data, with a recovery in consumer credit accompanying increased sales growth beginning around the middle of 1992. The relative strength in retail sales in the Midwest was consistent with preliminary estimates showing that personal income in the Midwest grew at nearly twice the pace for the rest of the nation over the year ending in the third quarter of 1992. The fourth quarter of 1992 was notable both for the success of the holiday season and continued growth in sales of big-ticket durable goods that might have been expected to lag during an underfunded, credit driven holiday season. Many analysts questioned the sustainability of the strength in spending in the fourth quarter, citing the apparent lack of improvement in employment and a burst of credit sales. However, reports from retailers generally indicated that sales growth held up well in the region in early 1993, and there were signs of continued expansion in credit utilization.
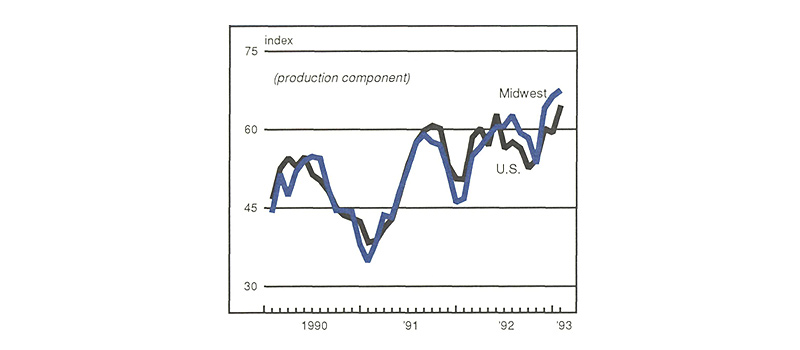
Retail sales growth in the Midwest has been aided in recent months by the income gains associated with increased manufacturing activity in the region. The recovery in manufacturing activity proceeded in fits and starts last year, trading places with consumer spending as an engine of the recovery through much of the year. In recent quarters, however, production in the Midwest seems to have responded quickly to the strengthening in national consumer spending that developed late in 1992, and expansion in production joined continued gains in retail sales to lead to more widespread income gains. Broad-based measures of regional manufacturing activity, including purchasing managers’ surveys, the Chicago Fed’s Midwest Manufacturing Index (MMI), and corporate earnings reports have been telling complementary tales about trends in activity in the Midwest. The Chicago Purchasing Managers’ Survey (conducted since 1946) is the most widely known and has the largest sample, but Midwest surveys are also conducted in Milwaukee, Detroit, Western Michigan, Iowa, and Indianapolis. The pattern taken by the average of the production component for several of these surveys (see figure 1) generally followed the national pattern over the last few years, with a recovery developing in early 1991 only to burn out toward the end of that year. Gradual improvement developed again during early 1992, followed by slowing momentum in the months leading up to the national election, and then a pickup in the rate of recovery in recent months, with results for early 1993 reaching the highest levels since 1988.
1. Purchasing Managers’ Surveys

There has been some variation in the production results reported around the Midwest. In Chicago and Milwaukee, production appears to have declined at a slower pace than the national average, then began to recover along the national pattern in 1991 and early 1992, with relative strength again apparent as activity gained further strength in late 1992. With its sensitivity to the auto industry, the Detroit survey exhibits some of the most cyclically evident results in the region. The production component for this survey showed marked weakness in the first quarters for 1991 and 1992, but results then began to recover along the national pattern. Late in 1992 this index also began to exhibit strength relative to the national average.
The MMI provides another source of information about trends in production activity in the Midwest. This index incorporates information about firm employment and electricity consumption to estimate the value-added component of production and is designed to allow a comparison to the monthly national report on industrial production. Since the beginning of the recovery, the MMI generally echoed the results seen in purchasing managers’ surveys, with modest relative strength in the Midwest and a pickup in the rate of recovery in the fourth quarter of 1992. However, because the employment component of the MMI is based on payroll (rather than household) survey data, the recovery in the MMI estimate could be understating the recovery of real activity in the Midwest relative to the nation as a whole.
Mixed results in Midwest labor market data
A bona fide recovery has been evident in many measures of real economic activity, but alternative employment data sources have depicted widely varying degrees of improvement in Midwest labor markets. There are two separate major survey sources used in developing the monthly government employment reports: households and establishments. From March 1991 until December 1992, establishment (also called payroll) survey data showed little sign of a recovery in total Midwest employment, while household survey data was indicating that a vigorous upturn was underway.
Figure 2 shows the difference between the household estimates for Illinois and Michigan and the 1992 payroll estimates for those states. By the end of last year, household employment had exceeded levels that prevailed at the onset of the recession, rising nearly 4%. In contrast, the payroll data initially showed no sign of a recovery. In Wisconsin, Iowa, and Indiana (where direct household survey estimates are not available), payroll employment estimates exceeded prerecession levels by the end of 1992, but given the size of Illinois and Michigan, the sum of the payroll numbers for the Midwest states showed only a modest recovery at best.
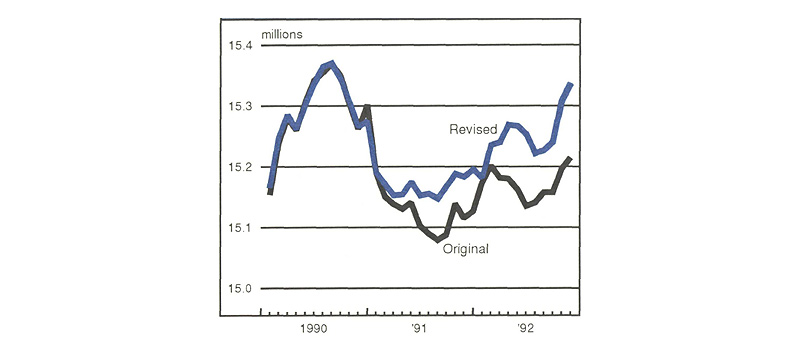
2. Total employment

This February, however, the state employment agencies released their annual revisions to the payroll estimates for 1992. The revised data depict a recovery in employment about twice as fast as the one originally estimated, although one that is still modest relative to the recovery in the household data as well as historical experience. The revisions were upward in each of the Midwest states, except for Illinois, where household survey data depicted a markedly more robust recovery than the payroll estimate.
Several other sources indicate a better jobs recovery than the one depicted in the payroll data. For example, the employment component of purchasing managers’ surveys around the Midwest have generally been improving in line with their experience in the recovery from the early 1980s recessions, while payroll survey data for 1992 showed no recovery at all in manufacturing employment in the region. A quarterly survey of employers’ hiring intentions conducted by Manpower, Inc. shows a continuing recovery in hiring plans in the Midwest. In contrast to the recessions and recovery in the early 1980s, relative strength is apparent in the survey results for this region since 1990.
Tracking employment—a difficult task
There are several reasons to suspect that payroll survey estimates were understating employment gains during the recovery from the recession. As a result of budgeting constraints facing the Bureau of Labor Statistics (BLS), the state employment agencies, and private firms choosing whether or not to participate in a voluntary program, the monthly payroll survey can have difficulty detecting employment changes arising among small to medium-sized companies or other firms not included in the sample, as well as those due to new firm formation. These problems can be magnified during periods of cyclical change. Each year, the monthly survey results for the previous year are adjusted to more comprehensive unemployment insurance records, helping to reveal whether the trend in the monthly sample correctly reflected trends in the unemployment insurance (or universe) data. The universe data is not available on a timely basis, however, typically being compiled six months or more after the covered period. Bias adjustment factors are applied to the monthly results to try to correct for sampling problems on a more timely basis, but a new adjustment method developed after the early 1980s recessions could not be tested by a significant recession and recovery until the slowdown that developed in 1990.
Unfortunately, uncertainty about the quality of the underlying universe data has also risen, and after an initiative to improve data quality. Beginning in 1989, the BLS and the state employment agencies began to formulate the Business Establishment List initiative, with the principal object of separating business unit or establishment level employment out more clearly from parent level reporting by large firms with numerous establishments. As a part of this initiative, a new data collection survey form was designed and standardized across the 50 states. However, changes in the survey forms revealed several important reasons why some firms had been overreporting employment levels prior to the revision, including the use of monthly or even quarterly totals rather than employment just for a single pay period. As overreporting problems were corrected by some large payroll service firms (which control information for a large number of employees), the underlying quarterly universe data (to which the monthly survey results are adjusted, or “benchmarked” annually) experienced a dramatic downdraft in January 1991. However, the apparent decrease in employment was largely due to the fact that overreporting was corrected in 1991 but not in earlier years. This disruption has recently been identified by the BLS as the principal factor in the massive benchmark revision in the national data for that year. As a result, the significantly worse recession apparently indicated by the initial data revision for 1991 was deemed not as severe as that revision indicated, and the BLS will now be revising the national data for up to ten years prior to March 1991, showing that the impact of the 1990-91 recession on national employment was less severe than the data currently indicate.
However, the overreporting problems were only partially solved in January 1991. An ongoing effort was made to analyze and adjust a number of payroll service firms’ reporting procedures, which may have led to a continued downward bias in the universe numbers (which the monthly data attempt to predict) as the problem was corrected. It should be noted that outside of a handful of payroll service firms, budgeting constraints have impeded an effort to thoroughly analyze and adjust reporting for other companies, including a large number of small accounting firms that perform the same reporting role as large payroll service companies, and large and small companies alike that do their own reporting, where the problems may be even more serious. The effort has continued, however, and the state employment agencies and the BLS may be facing the difficult task of correcting data reporting at the risk of impairing the consistency of the time series.
In the Midwest, revised employment data for 1991 depicted a recessionary downturn twice as severe as the original data, with the lion’s share of the downward revision coming from Illinois. Initially, technical factors associated with a change in survey forms were not deemed significant enough to call for a new revision in historical data in the Midwest, which implied that more traditional difficulties in the estimation process led to the discrepancy. More recently, however, it has been determined that historical data may be revised by some Midwest states, but traditional estimation difficulties still seem to have accounted for most of the downward benchmark revision in the region in 1991. Payroll surveys rely on large firms for much of their sample and find it difficult to track changes among new and existing small to medium-sized firms. Bias adjustment factors are generally not used at the state level to correct for this difficulty, unlike at the national level. As a result, the fact that the recovery in estimates of Midwest payroll employment tracked the national average during 1992 could actually mean that employment was relatively strong in the Midwest, given that bias adjustment factors tend to strengthen a recovery in the data series during an economic upturn. However, this conclusion must be tempered by the fact that after March 1991, the sample survey results at the national level were adjusted by factors that incorporated all of the benchmark revision for 1991, not just the minor portion deemed nontechnical.
The state employment agencies recently released rebenchmarked data for 1992. As shown in figure 3, the revised data showed a faster recovery in the Midwest, but one that still lags household survey measures as well as historical experience. The continuing relative weakness in the payroll numbers has been concentrated in the estimate for Illinois (the state with the largest downward benchmark revision in 1991), despite the fact that the household survey showed a vigorous upturn in Illinois in 1992, and gains in housing activity in the state have been among the strongest in the Midwest.
3. Midwest payroll employment

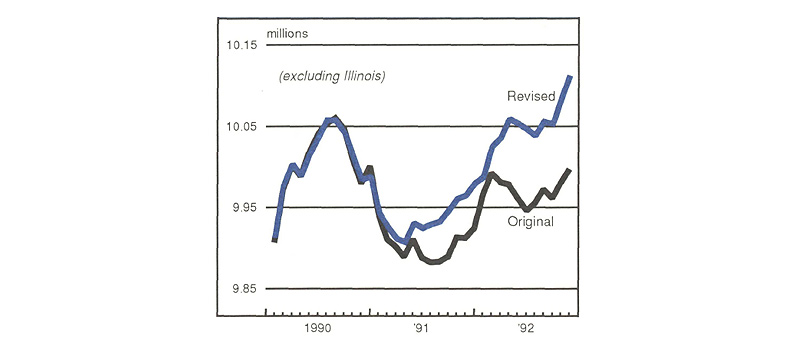
As seen in figure 4, recently revised payroll data for the other Midwest states show a more vigorous upturn, but even here the recovery is somewhat muted relative to household data and historical experience.
4. Midwest payroll employment

Part of the reason for the sluggish recovery in the state level payroll data during 1992 may also rest in the fact that the annual revision is applied (or benchmarked) during March, and the recovery in Midwest employment didn’t develop until late in 1991. As a result, monthly estimates after March 1992 may still reflect some of the sampling issues that caused the data to underestimate the recovery from March 1991 to March 1992. Finally, in looking at figures 2, 3, and 4, it should be remembered that as a result of the technical problems induced by the change in survey forms, states may be revising data prior to March 1991 to show that the recessionary downturn that began in mid-1990 was not as severe as currently estimated. If this occurs, it would also indicate that a greater percentage of the recessionary job losses have been recovered.
Labor markets may be stronger than we think
The acceleration in economic growth in the latter half of 1992 was concentrated in sectors in which Midwest production is relatively specialized and increasingly competitive, including business equipment, motor vehicles, and other consumer durable goods. The increase in Midwest production combined with further gains in housing activity to boost income in the region, laying the basis for further growth during 1993.
What can we conclude about employment growth? Hiring certainly continues to wrestle with several obstacles, including rising health care costs and uncertainty about employment regulation. Recent layoff announcements by some large firms have been so prominent that they have reinforced the picture presented by payroll data. However, personnel supply firms have recently noted modest improvement in permanent placements at large firms, joining the gains among small to medium-sized companies that began around the middle of 1992. In light of this and other anecdotal evidence, and after reviewing some of the measurement issues underlying the divergent paths taken by household and payroll measures of employment, it is likely that Midwest labor markets are a good deal healthier than generally believed.
Notes
1 The Midwest is defined as Illinois, Indiana, Iowa, Wisconsin, and Michigan unless otherwise noted.


