

The following publication has been lightly reedited for spelling, grammar, and style to provide better searchability and an improved reading experience. No substantive changes impacting the data, analysis, or conclusions have been made. A PDF of the originally published version is available here.
The U.S. agricultural sector faces both opportunities and challenges in the countdown to the next century. Opportunities include expanded farm export potential that stems from foreign population and income growth, as well as more liberal trade policies. Reflecting this, the annual growth in the value of U.S. farm exports in this decade is much improved over the uneven performance of the 1980s.
In addition, advances in biotechnology are improving productivity, reducing costs, and providing raw farm products more neatly tailored to the needs and desires of both processors and consumers. Many improvements in technology are also helping to protect the environment and enhance food safety. In addition, improved information flows and coordination between those who produce, process, and market agricultural and food products are creating new opportunities for agri-firms to add value by responding to the tastes and preferences of both foreign and domestic consumers.
Yet the optimism generated by these developments is tempered by other considerations. Export opportunities are threatened by global competition and an increase in the use of nontariff barriers such as sanitary/phytosanitary measures1 and product labeling regulations. Moreover, environmental and food safety issues are increasingly at the forefront of concerns expressed by consumers and policymakers. Finally, all this is occurring against the backdrop of a new policy environment and continuing structural change in agriculture. This Chicago Fed Letter reviews the outlook for world food demand and highlights three areas of concern that warrant continued scrutiny: international trade, structural change, and the environment.
Outlook for world food demand: Level and composition
Population and income are the most important drivers of food demand. Population growth increases the level of food demand, while income gains often contribute to changes in both the level and composition of demand. Over the past 25 years, world population has risen more than two billion, an increase of over 50%. (In comparison, the U.S. growth rate was about half that.) Though the rate of growth is expected to slow, world population is projected to increase by another two billion over the next 25 years. Developing nations will continue to account for a disproportionate share of population growth.
Developing nations hold the greatest potential for relative income gains, as demonstrated by several South American and Asian economies in recent years. But it should be remembered that economic gains typically do not match the steadiness of population growth. For example, the growth of the Mexican economy was interrupted by the peso crisis earlier this decade, and a handful of Asian nations are currently experiencing problems associated with policies that promote rapid economic growth. Moreover, estimates from the United Nations suggest that approximately 800 million people in the world today suffer from undernutrition related to inadequate income. To the extent that this group shares in the distribution of future income gains, this suggests a potentially significant expansion in effective food demand.
The historical pattern of consumption in countries such as the U.S. indicates that rising incomes in developing nations will not only lead to higher food demand but will also nudge the composition of demand in specific directions. Higher incomes tend to push food consumption away from cereals toward meats, fruits, and vegetables, as well as an array of processed foods. Therefore, gains in foreign population and income, combined with the potential of bringing more underprivileged people into world markets, indicate that meeting the tastes, preferences, and nutritional needs of consumers in other nations is of growing importance to participants in the U.S. food industry.
Trade barriers: A critical issue
The importance of foreign market access to U.S. agriculture cannot be overstated; exports account for over one-fifth of farm cash receipts.2 For some individual commodities, such as soybeans and wheat, the export share of production is much higher. Furthermore, the greatest agricultural export gains in recent years have been in higher-value and processed products such as meat and poultry, snack foods, and breakfast cereals.
This trend, in particular, has also expanded the stake of nonfarm businesses and workers in food exports. But despite the positive outlook for world food demand and the ongoing implementation of treaties liberalizing trade, access to foreign markets is still a troublesome issue. It is currently characterized by a new emphasis on qualitative trade barriers, such as product labeling requirements and the operation of state trading enterprises.
The European Union (EU) recently introduced special labeling requirements for food products that contain material from genetically modified organisms (GMOs). These requirements were scheduled to go into effect on November 1, 1997. In particular, they affect two crops widely grown in the Midwest: corn and soybeans that have been genetically engineered to improve insect and weed management and reduce pesticide use. Three member countries of the EU placed an outright ban on the use of the genetically modified corn and soybeans. The U.S. vigorously opposes the labeling requirement because it would raise costs involved in monitoring and compliance, could eventually lead to segregating products based on GMO content (further raising costs), and could unnecessarily alarm consumers. The outcome of this debate is also important for the precedent it sets in resolving such disagreements and the tone it sets for upcoming trade negotiations.
A second controversial issue concerns the activities of state trading enterprises, such as the Canadian and Australian Wheat Boards and the Dairy Boards in New Zealand and Canada. These organizations possess exclusive rights and privileges in the export of certain farm commodities or food products. The primary concern about these organizations is the lack of transparency in their pricing activities. Their actions are shrouded in secrecy, making it difficult to determine whether sales are made on the basis of competitive advantage or practices such as subsidized pricing. Questions were recently raised regarding whether Canada is “dumping” durum wheat in the U.S. at a price below the cost of production. Durum wheat imports into the U.S. have risen, but the increase has coincided with a decline in domestic production, making it even more difficult to arrive at any conclusion regarding improper pricing practices.
Structural change
The structure of agriculture is defined by a group of characteristics, including the number of farms, farm size, type of commodities produced, and legal organization. For the most part, the trends in these areas have been relatively stable for many years. For example, the shift to fewer and larger farm operations has been going on since the mid-1930s. This, along with the increasing concentration of sales among larger operations, is probably attributable to the use of technology to enhance farm labor productivity, as well as the farm family’s desire (as with any business owner) to expand the business to maintain or increase household income. However, the decline in the number of farm operations in recent years has been concentrated among the mid-size group, leaving the distribution of farm numbers more heavily weighted toward both small and large farms. Those in the middle of the size distribution are increasingly faced with a choice between two alternatives: expand the operation to maintain family income or shrink to a size that is compatible with holding a full-time job off the farm.
One of the most divisive structural issues today is the degree of vertical coordination within agriculture. Vertical coordination or integration may consist of using marketing or production contracts or full-scale integrated ownership. Under a production contract, the farmer/grower produces a specified quantity and quality for the contractor, who maintains ownership throughout the production cycle. Consequently, the contractor makes most of the production decisions and purchases most of the inputs. More prevalent are marketing contracts, which typically include a negotiated price or a price formula. In addition, under a marketing contract, the contractor does not own the commodity until delivery and has little influence over production decisions. In comparison, an “integrator” may own the farm operation and related businesses in the value chain, such as input supply firms or processing facilities.
In general, the current trend is toward greater vertical coordination in agriculture, but the degree differs markedly among commodities. For example, processors of poultry, milk, and sugar beets obtain more than half their raw agricultural inputs through contracts.3 Manufacturers of canned and frozen fruits, as well as macaroni and spaghetti, also obtain large proportions of their supplies from the farm production sector through contracts. In contrast, processors of corn, soybeans, and hogs (the primary farm products in the Midwest) have historically obtained most of their raw materials through cash markets.
In particular, the hog industry represents an ongoing case study of the impact of structural change and increasing vertical integration. The number of hogs grown under some form of contract represents a small but expanding share of total production. In addition, the number of farms with hogs has been declining for many years and the size of the average hog operation has grown. More recently, there has been an increase in the number of extremely large operations, aptly called “mega farms.” As one might expect, there are both positive and negative implications associated with these larger units. On the plus side, they are believed to operate more efficiently and at lower unit costs. With improved, standardized genetics and management practices, they can provide a more consistent and uniform product that better meets the needs and preferences of consumers. These advantages also make U.S. pork more competitive in world markets. On the downside, critics point to well-publicized odor and waste management problems. Some believe that more traditional pork producers, long the backbone of the industry, can no longer compete with the mega hog farms. Those that remain will feel more pressure to give up some independence and enter into strategic alliances. Moreover, the controversy regarding the regulation of livestock confinement units has escalated, with some counties enacting strict zoning and waste management regulations that effectively bar mega hog farms from constructing large units, but also limit expansion by local farmers.
Focus on the environment
American farmers are major users of natural resources and face growing demands on the environmental front. They are expected to help maintain and improve the quality of ground and surface water supplies and are the primary guardians of soil quality and productivity. Furthermore, they are increasingly being asked to provide reserves for wildlife and wetlands, remove environmentally sensitive land from production, and adopt sustainable farming practices. The challenge for agriculture is to expand output to meet the growing world needs for food and fiber and maintain and/or improve farm income, while at the same time limiting the acreage base and using more costly management and production practices to accommodate society’s increasing environmental sensitivity. Much of the progress made to date stems from the development and adoption of new technologies, as well as policies designed to encourage conservation.
Considerable gains have been made in reducing soil erosion. Major influences have been the adoption of conservation tillage practices and the implementation of the Conservation Reserve Program (CRP). The shift from conventional tillage to conservation/reduced tillage practices means leaving greater amounts of plant residue (such as corn stalks) on the surface. This reduces erosion and may also trim certain costs, such as those for fuel and equipment (but may require increased use of chemicals to control weeds and other pests). Complementing this, the CRP uses financial incentives to encourage farmers to convert marginal cropland to conservation use and was responsible for removing millions of acres of potentially erodible land from production.
However, agriculture faces renewed challenges in water quality. Measured water quality is improving, thanks to reduced pollution from industrial and municipal point sources. But recently, attention has turned toward pollution from nonpoint sources, setting the stage for greater scrutiny of agricultural production practices. The most recent Water Quality Inventory from the Environmental Protection Agency cites agriculture as a leading source of “impairment” to surface and ground water supplies from nonpoint sources. This impairment can take the form of sediment buildup from erosion or the introduction of fertilizers, pesticides, or livestock wastes into surface or ground water supplies through runoff or leaching. The economic costs associated with these problems take the form of increased expenditures for dredging, water treatment, and personal health. Impairment can also result in damage to aquatic life and recreational areas.
A market-oriented explanation for pollution suggests it occurs because property rights to the environment are not adequately defined. For example, there is no market price associated with using environmental resources as a receptor for eroded soil or excess chemicals. Consequently, these costs are not factored into agricultural production decisions. But standard regulatory remedies can be inflexible and unnecessarily raise production costs. Rather than respond with such a command-and-control regulatory approach, the U.S. Department of Agriculture adopted an incentive-based, voluntary approach to improving environmental and water quality. The CRP has had a positive impact on water quality by removing potentially erodible land from production. More recently, the Environmental Quality Incentives Program was formed, which focuses on providing education, technical assistance, and financial assistance to enhance water quality. Since soil and water quality problems vary from area to area as soil types and land use vary, an important aspect of these programs is the ability to target regions and farming practices that can provide the greatest benefit for a given cost.
Summary
As we move into the twenty-first century, U.S. agriculture faces growing world demand for its products. However, its ability to meet that demand is by no means assured. As trade barriers such as quotas and tariffs are reduced, attempts are being made to erect new barriers based on issues of food safety. Resolution of these issues will depend upon the performance of the World Trade Organization as arbiter of trade disputes as well as upon future international negotiations. In addition, both consumers and farmers have an important stake in monitoring structural change and environmental regulation, since developments in these areas will affect our ability to produce adequate food to meet foreign and domestic needs, improve the environment, and provide an adequate income to farmers.
Tracking Midwest manufacturing activity
Manufacturing output indexes (1992=100)
| September | Month ago | Year ago | |
|---|---|---|---|
| CFMMI | 123.8 | 123.7 | 118.0 |
| IP | 124.2 | 123.6 | 117.4 |
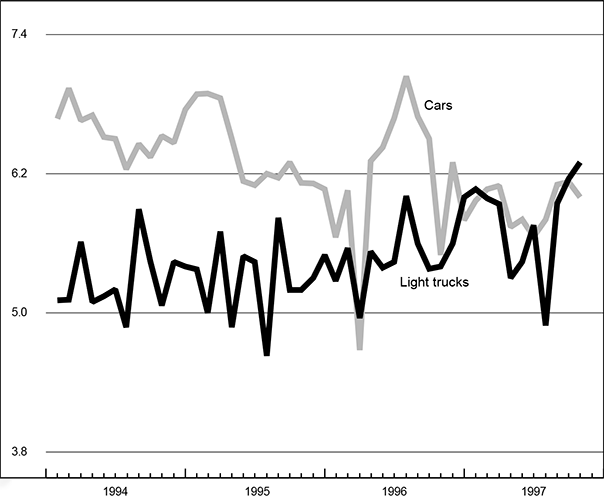
Motor vehicle production (millions, seasonally adj. annual rate)
| October | Month ago | Year ago | |
|---|---|---|---|
| Cars | 6.0 | 6.1 | 5.5 |
| Light trucks | 6.3 | 6.2 | 5.4 |
Purchasing managers’ surveys: net % reporting production growth
| September | Month ago | Year ago | |
|---|---|---|---|
| MW | 70.4 | 60.5 | 63.7 |
| U.S. | 57.4 | 62.4 | 53.9 |
Motor vehicle production (millions, seasonally adj. annual rate)
The CFMMI increased 0.1% from August to September, following a 0.9% increase in August. By comparison, the Federal Reserve Board’s IP index for manufacturing increased by 0.4% in September and 0.8% in August. The steel sector had the strongest performance in the Midwest index, increasing by 1.2% in September, following a 1% increase in August.
The Midwest purchasing managers’ composite index for production increased to 70.4% in September from 60.5% in August. The national purchasing managers’ composite index decreased from 62.4% in August to 57.4% in September. Economic activity in the manufacturing sector grew at a slower rate in September than in August. Motor vehicle production for October decreased from 6.1 million units to 6 million for cars and increased from 6.2 million units to 6.3 million for light trucks.
Notes
1 Technical barriers used for protecting human, animal, and plant health.
2 Eugene Moos, “Exports equal farm prosperity,” Agricultural Outlook, April 1996, pp. 10–11.
3 Stuart Frank and Dennis Henderson, “Transaction costs as determinants of vertical coordination in the U.S. food industries,” American Journal of Agricultural Economics, Vol. 74, No. 4, November 1992, pp. 941–950.


