

The following publication has been lightly reedited for spelling, grammar, and style to provide better searchability and an improved reading experience. No substantive changes impacting the data, analysis, or conclusions have been made. A PDF of the originally published version is available here.
One of the most fundamental questions in finance is how to fund firms’ investment projects. Some firms finance investment projects by using equity, while others borrow from investors and/or financial intermediaries. Because debt and equity contracts offer different payoffs and rights to investors, how a firm finances its projects is primarily determined by the characteristics of the firm and its projects.
Debtholders are more likely to suffer losses if firms engage in risky activities. To reduce potential losses, debtholders can require collateral or place restrictive covenants on the loans they make. However, such control mechanisms can be cumbersome and inflexible for some firms, particularly for those that want to pursue innovative investment opportunities with uncertain outcomes. Equity contracts, on the other hand, offer managers more flexibility over the use of funds. In return, investors gain oversight and control rights to get involved in the day-to-day management of firms, along with the potential of earning upside returns on their investment. In competitive capital markets, the effects of conflicts of interest are reflected in security prices. Therefore, firms, as well as investors, have an interest in designing securities that mitigate these conflicts of interest.
This Chicago Fed Letter discusses how different financial instruments may mitigate conflicts of interest between firms and investors. Control issues relating to financing decisions may be especially important for small firms. Because small firms are more likely to fail than large firms and because they may not have an established track record or collateral to protect investors from losses associated with bankruptcy, developing control mechanisms is likely to be particularly important in financing these firms. Accordingly, we examine the activities of small business investment companies (SBICs), which are financial intermediaries chartered and regulated by the U.S. Small Business Administration to fund the activities of small businesses. Unlike commercial banks, which are essentially restricted to making debt investments, SBICs provide both debt and equity funds to small businesses. Hence, SBICs are free to choose the appropriate mixture of claims on a given firm and, more generally, in their own portfolios. Banking organizations, however, are allowed to own and operate investment companies; hence, they can make equity investments indirectly by establishing SBIC units.
Examining the investment choices of SBICs offers insight into the factors influencing optimal security choice. In our research (Brewer, Genay, Jackson, and Worthington, 1996), we have found that the type of financing provided by an SBIC varies with the type of project planned by the recipient small firm.1 We have also found significant differences between the choices and performance of bank-owned and nonbank-owned SBICs in the 1980s and 1990s. We explore these issues below.
Factors governing security design
Financial intermediaries, such as commercial banks, SBICs, and conventional venture capital firms, are in the business of funding the projects of commercial enterprises. However, different financial intermediaries use different types of financial instruments. Venture capitalists typically finance business activities with equity, while commercial banks use debt. SBICs, which are a hybrid, use both debt and equity. What governs these choices? Surely regulatory considerations are important (e.g., prohibitions on commercial bank equity holdings), but our focus here is on the role of contracting costs.2 What mixture of claims minimizes the conflicts of interest that naturally arise between managers and owners on the one hand, and owners and lenders on the other hand?3
Firms’ projects drive the security design of investors
Finance theory suggests that security choice depends on factors that influence the severity of these two conflicts of interest. In particular, the type of securities used to fund firms’ projects is influenced by the tangibility of firms’ assets, the degree of management discretion over the use of funds, and the extent to which managers can be easily monitored by investors. Tangible assets like equipment, buildings, and land can be used as collateral in debt contracts, thus providing some minimum protection in the event of default. High levels of tangible assets, or other assets that can be liquidated, tend to increase the amount of protection afforded to debtholders. Thus, projects that generate or require investments in tangible assets are likely to be financed with debt. On the other hand, if the firm is undertaking a project with few tangible assets associated with it, the firm is likely to obtain equity financing.
Projects involving substantial management discretion over the use of funds are those for which debt finance would be expensive: The greater the amount of management discretion, the greater the opportunity to shift funds to riskier projects, increasing the likelihood of default and, thereby, raising the cost of issuing debt. Thus, projects that allow greater management discretion will tend to be financed with equity. Similarly, projects that are difficult to monitor for asset substitution are likely to be financed with equity.
Type of securities held by SBICs and intended use of funds
To the extent that the type of project undertaken by the recipient firm is a key factor in determining the security choice of investors, we would expect to find that equity is used to finance risky activities that generate few tangible assets, are difficult to monitor, and allow managers a great deal of discretion over the disbursement of funds. Our research shows that the investment activities of SBICs are consistent with this expectation.
Figure 1 presents the relationship between the intended use of funds and SBICs’ investment activities. The most important category for intended use of funds is operating capital, which accounted for around 57% of dollar investments. Other important categories are acquisition of existing businesses, debt consolidation, acquisition of machinery, and research and development (R&D). For each project, figure 1 also shows the percentage of funds provided in the form of debt rather than nondebt.4 Panel A of figure 1 groups the uses of funds into three categories: operating capital, transaction-oriented uses, and relationship-oriented uses.5 Transaction-oriented uses include plant modernization, new building or plant construction, debt consolidation, machinery acquisition, and land acquisition. Relationship-oriented uses include the acquisition of an existing business, marketing activities, and R&D. This grouping reflects our a priori judgment that relationship-oriented projects offer greater scope for management discretion as to how the funds are used than do transaction-oriented projects, which are likely to require less monitoring and are less subject to asset substitution problems for lenders. Furthermore, transaction-oriented uses may involve the purchase of assets which have some liquidation value in the case of borrower default. In panel A, the differences between categories stand out clearly. Funding for relationship-oriented uses is likely to be nondebt. Between 1983 and 1992, 89.3% of all dollars invested in firms planning relationship-oriented projects took the form of nondebt securities. In contrast, funding for transaction-oriented uses is less likely to be nondebt; only 50.8% of funds provided for transaction-oriented projects were through nondebt instruments. As can be seen in panel B of figure 1, these relationships hold using the more disaggregated data on intended use of funds.
1. Intended use of funds and security choice, 1983–92
| Panel A: Intended use of funds, by type | ||||
| Debt | Nondebt | Total | Share of total $ | |
| (% of total $) | (% of total $) | ($ millions) | ||
| Operating capital | 23.0% | 77.0% | $1,449.6 | 56.8% |
| Transaction-oriented | 49.2 | 50.8 | 392.9 | 15.4 |
| Relationship-oriented | 10.7 | 89.3 | 711.5 | 27.8 |
| Panel B: Intended use of proceeds, as reported | ||||
| Debt | Nondebt | Total | Share of total $ | |
| (% of total $) | (% of total $) | ($ millions) | ||
| Operating capital | 23.0% | 77.0% | $1,449.6 | 56.8% |
| Plant modernization | 73.7 | 26.3 | 17.8 | 0.7 |
| Acquisition of existing business | 11.7 | 88.3 | 602.2 | 23.6 |
| Consolidation of debts | 40.7 | 59.3 | 248.4 | 9.7 |
| New building or plant construction | 80.2 | 19.8 | 31.7 | 1.2 |
| Acquisition of machinery/equipment | 39.3 | 60.7 | 65.7 | 2.6 |
| Land acquisition | 94.9 | 5.1 | 29.2 | 1.1 |
| Marketing activities | 2.1 | 97.9 | 27.1 | 1.1 |
| Research and development | 2.0 | 98.0 | 76.3 | 3.0 |
| Other | 56.8 | 43.2 | 5.9 | 0.2 |
| Total financings | ||||
| (in millions, inflation-adjusted) | $602.8 | $1,951.3 | $2,554.1 | |
Source: Authors’ calculations from data provided by the U.S. Small Business Administration.
Bank-owned SBICs are equity investors
The SBIC program provides banking organizations with an opportunity to make investments not otherwise permitted as commercial bank activities. Consequently, by establishing an SBIC unit, banks reveal their preference for making equity investments. Such investments are likely to complement the loans made by banks’ credit departments and provide an opportunity for diversification. Bank-owned SBICs invested nearly 90% of their funds through nondebt contracts over the 1983–92 period; in contrast, nonbank-owned SBICs invested less than 70% of their dollars through such contracts over the same period. Thus, bank-owned SBICs were more involved with equity finance of small businesses than other SBICs. Further, as figure 2 shows, a substantial fraction (44.3%) of bank-owned SBICs’ investment dollars went to firms intending to undertake relationship-oriented projects. Thus, banking organizations were taking advantage of the SBA’s small business investment company program to pursue an extensive strategy of equity investments in projects that are costly to finance using debt and, hence, are not otherwise likely to be funded at the commercial bank level.
2. Intended use of funds and SBIC type, 1983–92
| Bank-owned SBICs | Nonbank-owned SBICs | All SBICs | |
| ($ million) | ($ million) | ($ million) | |
| Operating capital | $409.2 | $1,040.4 | $1,449.6 |
| Transaction-oriented | 78.0 | 314.9 | 392.9 |
| Relationship-oriented | 387.0 | 324.5 | 711.5 |
| Relationship-oriented as % of total financings | 44.3% | 19.3% | 27.8% |
Source: Authors’ calculations from data provided by the U.S. Small Business Administration.
Finally, we note that bank-owned SBICs tend to finance somewhat younger firms than nonbank-owned SBICs, which is also consistent with contracting theory. The mean age of firms funded by bank-owned SBICs from 1983 to 1992 was 5.6 years, compared to 6.4 years for nonbank-owned SBICs. Young firms, with presumably little reputational capital, may find raising debt costly as investors demand large premiums to counter the risks of asset substitution and bankruptcy. Younger firms may also have more growth potential than older ones and, therefore, face a higher cost of foregone opportunities from restricting management discretion. Moreover, activities of firms with high growth potential tend to generate small or negative cash flow in the short run, even though the long-term profit opportunities of these activities are relatively high. As a result, when firms finance growth opportunities with borrowed funds, they may have a difficult time servicing their debt payment. The fact that bank-owned SBICs, which tend to specialize in nondebt investments, invest in younger firms suggests that the contracting cost of debt is significant for these firms (figure 3).
3. Age of small business and SBIC type, 1983–92
| Bank-owned SBICs | Nonbank-owned SBICs | |
| (% of $ financings) | (% of $ financings) | |
| > 1 year | 23.9% | 17.3% |
| 1 to 5 years | 42.0 | 44.3 |
| 5 to 10 years | 16.8 | 18.0 |
| Over 10 years | 17.3 | 20.4 |
| Total financings | ||
| (in millions, inflation-adjusted) | $874.2 | $1,679.9 |
Source: Authors’ calculations from data provided by the U.S. Small Business Administration.
Conclusion
Carefully designed securities can minimize conflicts of interests between a firm’s shareholders, creditors, and managers and can improve the availability of funds. In this Chicago Fed Letter, we have discussed how SBA-chartered and regulated financial intermediaries fund the activities of small businesses. SBICs tend to use equity contracts to finance the activities of firms that initially generate relatively few tangible assets, such as R&D. While such activities are also likely to have very little cash flow in the short run, their future growth opportunities might be high. Bank-owned SBICs tend to pursue a strategy of extensive equity investments, specializing in funding younger firms and projects that generate few tangible assets. The propensity of bank-owned SBICs to pursue equity-type investments when the opportunity arises may offer a glimpse of the markets that might be served by banking organizations in the absence of existing regulations.
Tracking Midwest manufacturing activity
Manufacturing output indexes (1987=100)
| October | Month ago | Year ago | |
|---|---|---|---|
| CFMMI | 129.0 | 129.6 | 125.9 |
| IP | 128.9 | 129.5 | 124.4 |
Motor vehicle production (millions, seasonally adj. annual rate)
| October | Month ago | Year ago | |
|---|---|---|---|
| Cars | 5.5 | 6.5 | 5.7 |
| Light trucks | 5.4 | 5.4 | 5.3 |
Purchasing managers' surveys: net % reporting production growth
| November | Month ago | Year ago | |
|---|---|---|---|
| MW | 60.2 | 63.6 | 52.5 |
| U.S. | 58.6 | 56.6 | 46.1 |
Purchasing managers’ surveys (production index)
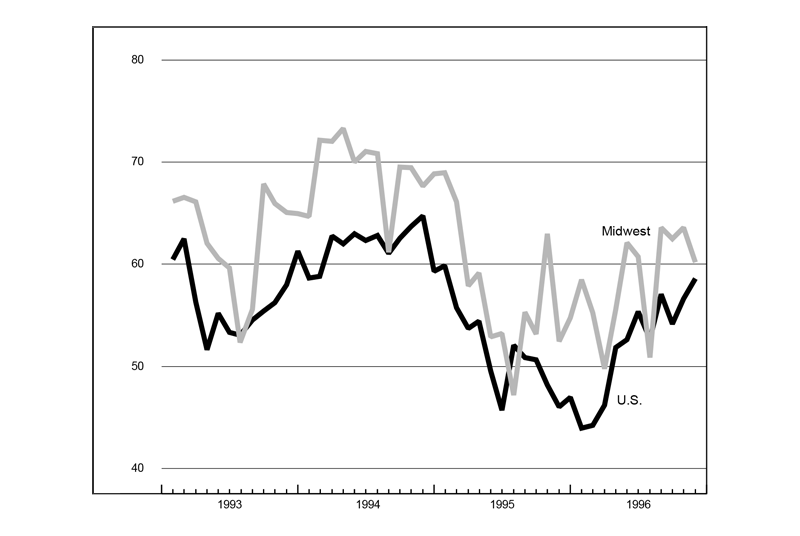
While the national purchasing managers’ index suggested an acceleration in November, the composite Midwest index declined over three points from the previous month. Still, the Midwest was above the nation in November, suggesting that Midwest manufacturing remains stronger than nationwide.
Midwest manufacturing activity began to show the effects of the General Motors strike in October. Car and light truck production declined by 1 million units. The Chicago Fed Midwest Manufacturing Index dropped nearly 0.4% from September. Nevertheless, the decline in Midwest output was less than that experienced nationwide. To the extent that strike-related disruptions spilled over into November, total output in the region could experience another month of decline.
Notes
1 Elijah Brewer III, Hesna Genay, William E. Jackson III, and Paula R. Worthington, “How are small firms financed? Evidence from small business investment companies,” Economic Perspectives, Federal Reserve Bank of Chicago, Vol. 20, No. 6, November/December 1996, pp. 2–17.
2 Regulations may also be important for how SBICs fund small businesses. SBICs are eligible to receive government funding up to three times their private capital. SBICs also face some restrictions on their investments. The results of our previous research (Brewer, Genay, Jackson, and Worthington, 1996) indicate that SBICs receiving subsidies are more likely to make debt investments.
3 For a detailed discussion of contracting costs and optimal security design, see Brewer, Genay, Jackson, and Worthington (1996).
4 Nondebt securities include straight equity, debt with equity features, and a combination of the two securities.
5 This type of separation is suggested by Leonard Nakamura, “Recent research in commercial banking: Information and lending,” Financial Markets, Institutions, and Instruments, Vol. 2, No. 5, 1993, pp. 73–88.


