

The following publication has been lightly reedited for spelling, grammar, and style to provide better searchability and an improved reading experience. No substantive changes impacting the data, analysis, or conclusions have been made. A PDF of the originally published version is available here.
In October 1987, the Dow Jones Industrial Average (DJIA) fell 508 points to 1,738 and the Standard & Poors (S&P) 500 futures dropped 80.75 points to 201.50 in one day.1 In 1988, a number of studies of the crash recommended implementing temporary trading halts or circuit breakers at the equity related exchanges when the stock market declined significantly. One of these studies, by the Presidential Working Group on Financial Markets (the Working Group), cited the following principles upon which circuit breakers should be based: that artificial trading halts should be infrequent events and that coordination of halts among all equity-related markets is vital. In this Chicago Fed Letter, I review the background of circuit breakers, describe their key principles, examine how the current intervention mechanisms violate these principles, and make suggestions for improvements.
Development and design
Circuit breakers take several different forms, but all are designed to artificially limit or interrupt trading in a particular instrument. At its inception in 1982, the Chicago Mercantile Exchange’s (CME) S&P 500 futures contract, which is based on 500 stocks predominantly traded on the New York Stock Exchange (NYSE), had a daily price limit equal to a 3% movement. In 1983, the limit was removed, and the futures index contract traded without restraint until shortly after the 1987 crash, when a 30-point daily limit was temporarily adopted. Like the CME, the NYSE had no circuit breakers in place in October 1987. It was not long before a number of reports addressed circuit breakers on a conceptual level. The Working Group specifically recommended a one-hour trading halt at the NYSE after a drop of 250 points in the DJIA and a two-hour trading halt after a drop of 400 points. The report further proposed coordinated halts for all equity-related markets.
In February 1988, the NYSE proposed Rule 80A, its first official circuit breaker, the “collar” rule.2 Rule 80A prohibited index arbitrage traders from executing trades through the NYSE’s automated transaction system, DOT (Designated Order Turnaround), after the DJIA moved 50 points in either direction from its previous settlement price. In October 1988, the NYSE implemented Rule 80B, which imposed a one-hour halt after a 250-point decline in the DJIA and a two-hour halt after a 400-point decline, in line with the Working Group’s recommendations. The NYSE also amended Rule 80A to include a five-minute delay for program trades through the DOT system if the S&P 500 futures index fell 12 points from its previous closing price. This is known as the “sidecar” rule. The collar and sidecar rules are intended to limit the volume of trades initiated by arbitragers, whose simultaneous trades in each market align the prices of the individual stocks comprising the S&P 500 index and the CME index futures contract. Delaying or temporarily prohibiting the orders on the NYSE leg of the arbitrage trade increases the execution cost and risk for arbitragers and widens the price spread between the markets.
In October 1988, the CME instituted circuit breakers—a one-hour halt after a 30-point decrease in the S&P 500 futures index and a two-hour halt after a 50-point decrease. The CME added a 30-minute trading halt or “speed bump” after a 12-point decrease in the futures index to combat the misperception that futures caused price declines. The index futures market is generally more liquid than the stock markets. Traders can change the size of their portfolios more cheaply and quickly in the futures market than in the stock market. Therefore, the S&P 500 futures price tends to adjust to new information more quickly and to precede the NYSE in price declines. Intermediate circuit breakers give NYSE stock prices time to reach comparable levels.
Over the years, circuit breakers at both the NYSE and CME have been expanded, with the most recent changes approved by the Securities and Exchange Commission (SEC) and the Commodities Futures Trading Commission (CFTC), effective April 15, 1998. At the NYSE, trading will be suspended on a decline of 10%, 20%, and 30% of the DJIA average closing price, rounded to the nearest 50 points. The levels are adjusted quarterly, and the length of the trading halts depends on the time of day. The collar and sidecar rules remain in effect at their original levels. The CME trading halts are also based on percentages, though the maximum daily price decline is 20%. In addition, the futures exchange has expanded its speed bumps to 2.5% and 5% declines in the index. As with the NYSE, the CME trigger levels are reset quarterly, based on the index’s daily average during the prior month, rounded to the nearest 10 points.
Infrequency and coordination
Infrequency and coordination are the key principles of the circuit breaker recommendations in several of the 1987 studies. The Working Group, comprising the chairpersons of the Treasury, Federal Reserve, CFTC, and SEC, concluded:
“[A] circuit breaker mechanism should be put in place that operates in a coordinated fashion across all markets, using pre-established limits broad enough to be tripped only on rare occasions, but which are sufficient to support the ability of payment and credit systems to keep pace with extraordinarily large market declines.”3
Infrequency
Several of the 1988 reports concurred that artificial trade disruptions are undesirable. However, on rare occasions when the market falls precipitously, as in October 1987, systems may fail causing trading delays or halts. Unprecedented volume seriously debilitated the DOT system. The Federal Reserve wire transfer system, FedWire, suffered delays and halts, slowing the flow of funds among clearinghouses, settlement banks, and investors. Banks had difficulty assessing their customers’ credit quality because the clearinghouses’ solvency was uncertain. This, in turn, delayed their decision to lend to market participants. At one point, the Chicago Board Options Exchange (CBOE) and CME suspended trading in their equity derivative contracts, because, although the NYSE was officially open, over 20% of the underlying stocks were not trading. The Working Group concluded that it was preferable to replace disruptive, unplanned halts with predetermined, coordinated halts. However, these artificial trading halts were intended to be infrequent. Therefore, circuit breakers should be revised periodically to maintain the percentages originally imposed—12% and 20%. Both the Federal Reserve and the SEC reiterated the infrequency theme in testimony before a Senate subcommittee in January 1998.4
Other reports recognized that limiting price changes beyond extreme cases impedes price discovery and prevents participants from efficiently managing their portfolios. This effectively increases risk and cost to all market participants and decreases liquidity. Both the speed bumps at the CME and the collar and sidecar rules at the NYSE violate the infrequency principle. The collar rule was triggered more than once a day on average in 1997, nearly three times the number of occurrences from 1990 through 1995 (see figure 1). While the NYSE sidecar rule and the CME initial speed bump were triggered less often, it is doubtful that payment, operating, or credit systems were in jeopardy 37 or 19 times last year. The capacity and integrity of these systems have improved since circuit breakers were introduced, in effect further eroding arguments favoring circuit breakers.
1. Circuit breaker triggers
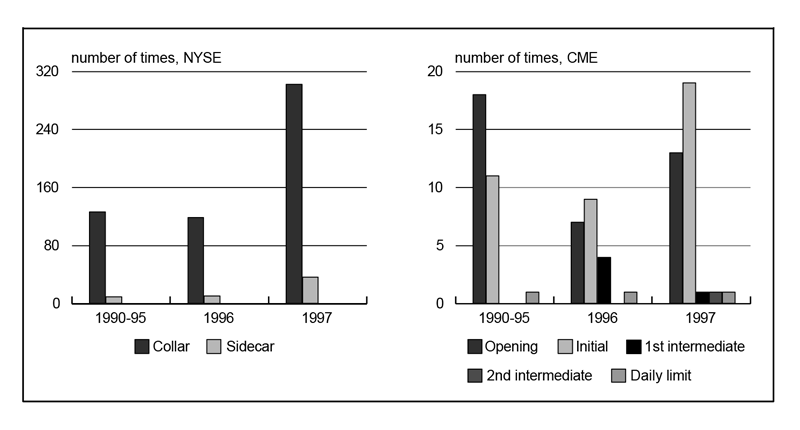
Source: New York Stock Exchange Web page and the Chicago Mercantile Exchange.
Coordination
The Report to the President by the Task Force on Market Mechanisms, or the Brady Report, explained that the stock, stock index futures, and options markets effectively constitute one market linked by arbitrage and influenced by the same economic factors. As a result, uncoordinated circuit breakers have destabilizing effects on markets that remain open.
However, even the latest versions of circuit breakers violate the coordination principle in several respects. First, the S&P 500 futures index at the CME has a maximum daily price limit of 20%, while the NYSE and many other exchanges allow a 30% daily decline. These divergent policies may cause a substantial liquidity strain for participants of both the exchanges and the payment system. Consider a CBOE trader with a losing option position in an equity market that has dropped 30% and an offsetting CME contract in S&P 500 futures, where trading has been halted after a 20% decline. A customer eligible to participate in the cross-margining agreement between the CME and the CBOE’s clearinghouse is able to net her margin requirement. Generally, this results in an 85% margin savings. However, on this particular day, the trader must provide margin representing the 10% difference because the futures contract is valued at the abbreviated limit price. As the trader (and all others affected by this difference) seeks credit to cover this gap, systemwide liquidity may be strained. Currently, the CME and the CBOE’s clearinghouse are collaborating on a model that would eliminate the cross-margin gap by giving the customer credit as if the futures contract actually declined by 30%. While this solves the liquidity problem for the traders, it increases the CBOE clearinghouse’s exposure to CME clearinghouse failure.
Extension of the daily limit to 30% by the NYSE compromised the exchange’s desire to protect investors from extreme volatility and opposition from the SEC and Fed to closing the market early. The Fed listed several reasons against a daily limit, including potential erosion of investor confidence, the disadvantage for small investors with fewer alternatives outside the NYSE, and the increased difficulty of reopening the market the next day. Further, the Fed stressed the need for closing prices to revalue portfolios and manage market and credit risk. The SEC pointed out that the markets should remain open to facilitate routine market activities and futures and option strategies and to alleviate the redemption pressures on the mutual fund industry.
When redeeming shares, mutual fund investors receive the net asset value as of the day’s end. If it appeared that circuit breakers would limit a price decline by closing the market prematurely, investors would have an incentive to redeem their shares at an artificially high level. If redemptions were greater than cash reserves, fund managers would be forced to liquidate part of their portfolio, exacerbating the decline. Given that there are 40 million investors with $3 trillion invested, it is not surprising that the NYSE raised its daily price limit to 30%.
To provide an example of the volume of money that may move through the clearing and payment systems following a decline, consider the case of FedWire in October 1997. A record $3.7 billion moved through FedWire following a mere 7.4% market decline. Because of its concern about payments following a decline, the CME clearinghouse opted for a 20% limit. Circuit breakers limit the financial exposure of the exchange and its members by placing a cap on margin payments that firms have to make and settlement banks have to commit or lend. The clearinghouse is more concerned about the risk from the volume and dollar value of transactions that must be settled than the lack of transparency resulting from the limit on prices. The CME faces similar exposure to member default and payment system strain from a 10% or 20% market increase, yet it has no circuit breakers in place to cover this possibility.
The CME clearinghouse prefers the 20% limit because the later in the day the decline occurs, the more costly it becomes for firms to get credit. However, on such a day, the clearinghouse is likely to have had several special early margin calls, reducing its exposure to member default and leaving a smaller percentage of liquidity that customers would be required to provide late in the day. Finally, some argue that the CME imposes a stricter daily limit to avoid the blame for causing price declines.
The intermediate price limits at both the NYSE and the CME represent another violation of the coordination principle. The NYSE’s collar and sidecar restrictions, intended to curb index arbitrage, are not coordinated with restrictions of any other exchange trading equity products. Similarly, the CME’s speed bumps do not correspond to circuit breakers at other exchanges. Further, the NYSE and CME circuit breaker levels are based on different indexes. Price limits and trading halts at the CME are based on the S&P 500 futures index, while halts at the NYSE are based on the DJIA. As long as the relationship between the two indexes remains constant, trading halts occur simultaneously. However, if one index falls more rapidly than the other and index arbitrage is not allowed to correct the price discrepancy, circuit breakers will be triggered at different times.
One of the most important reasons the NYSE stops trading based on a prespecified decline in the DJIA is that the component stocks are traded on the exchange and have very liquid markets. Also, the DJIA is a stock market indicator recognized by most investors. The CME closes trading on its S&P 500 futures contract based on declines in that index so that traders on the exchange will know precisely when their contract will halt trading, increasing their ability to execute their strategies. Furthermore, with 500 component stocks, the index better represents the market than the 30-stock DJIA. A new closure rule for all equity-related markets could be based on the number of actively trading stocks at the NYSE. Such a rule, which the CBOE applied in 1987, officially halts trading when a certain percentage of individual stocks cease to trade. This is a better indicator of capacity strains than an arbitrary percentage price decline.
Conclusion
As recently as May 1998, the Working Group recommended that the NYSE reevaluate the effectiveness of its collar and sidecar rules.5 Based on the Working Group’s original recommendations of infrequent and coordinated circuit breakers in all exchange-traded equity venues, superfluous price limits at all exchanges should be eliminated and the remaining ones should be replicated across all equity markets uniformly. While coordination between exchanges is challenging, it is vital to recognize that all exchanges are affected by the capacity of the others. Given the complex nature of margins and settlements, the parties best able to resolve the dilemma are the exchanges themselves. However, the SEC and the CFTC should require strict adherence to the fundamental principles in both the current versions and future amendments to circuit breakers.
Tracking Midwest manufacturing activity
Manufacturing output indexes (1992=100)
| April | Month ago | Year ago | |
|---|---|---|---|
| CFMMI | 125.7 | 125.2 | 122.0 |
| IP | 130.8 | 130.5 | 125.4 |
Motor vehicle production (millions, seasonally adj. annual rate)
| May | Month ago | Year ago | |
|---|---|---|---|
| Cars | 5.6 | 5.5 | 5.8 |
| Light trucks | 6.5 | 6.4 | 5.5 |
Purchasing managers' surveys: net % reporting production growth
| May | Month ago | Year ago | |
|---|---|---|---|
| MW | 63.0 | 64.9 | 56.8 |
| U.S. | 54.1 | 53.4 | 57.0 |
Motor vehicle production (millions, seasonally adj. annual rate)
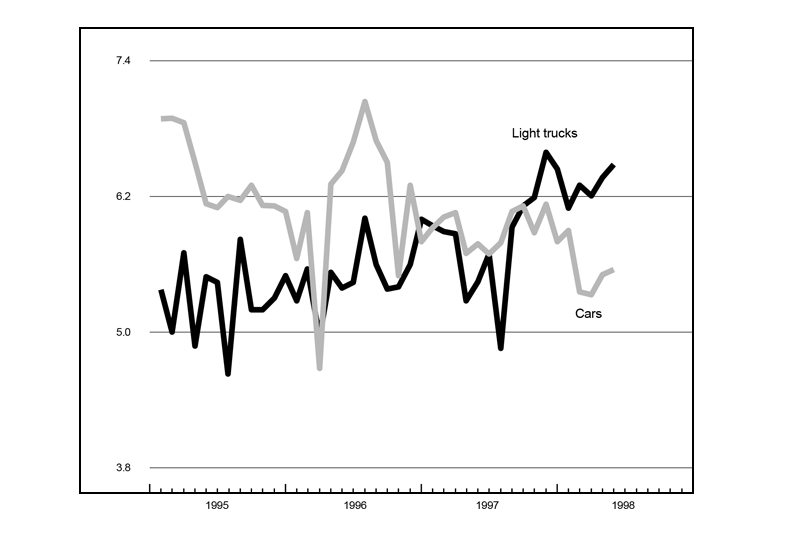
Total light motor vehicle production (seasonally adjusted annual rate) increased from 11.9 million units in April to 12.1 million units in May. Light truck production increased from 6.4 million units in April to 6.5 million units in May, and car production increased from 5.5 million to 5.6 million units during this period. The Chicago Fed Midwest Manufacturing Index (CFMMI) increased slightly from 125.2 in March to 125.7 in April. By comparison, the Federal Reserve Board’s Industrial Production Index for manufacturing (IP) also increased from 130.5 in March to 130.8 in April.
The Midwest purchasing managers’ composite index for production decreased to 63% in May from 64.9% in April. Purchasing managers’ indexes decreased in Chicago and Milwaukee, but increased in Detroit. The national purchasing managers’ composite index increased from 53.4% in April to 54.1% in May.
Notes
1 Report of the Presidential Task Force on Market Mechanisms, January 1988, p. 36.
2 Beginning on the day following the crash, the NYSE prohibited the use of the DOT system for executing certain index arbitrage trades. (Report of the Presidential Task Force on Market Mechanisms, January 1988, p. 40).
3 U.S. Senate, hearing before the Committee on Banking, Housing, and Urban Affairs, “The conclusions and recommendations of the President’s ‘Working Group on Financial Markets’,” May 24, 1988.
4 Arthur Levitt, chairman, U.S. Securities and Exchange Commission, testimony before the Subcommittee on Securities of the Senate Committee on Banking, Housing, and Urban Affairs, January 29, 1998; Susan M. Phillips, Governor, Federal Reserve Board, testimony before the Subcommittee on Securities of the Senate Committee on Banking, Housing, and Urban Affairs, January 29, 1998.
5 Greg Ip, “Regulators target Big Board’s 50-point ‘collar’,” Wall Street Journal, May 9, 1998, p. C23.


