

The following publication has been lightly reedited for spelling, grammar, and style to provide better searchability and an improved reading experience. No substantive changes impacting the data, analysis, or conclusions have been made. A PDF of the originally published version is available here.
Many studies find a correlation between how much a worker is paid (per hour) and how many hours they work. The usual causal interpretation of this correlation is that those with lower wages choose to work fewer hours. However, it is also possible that those who work fewer hours are offered lower wages. We find evidence that the latter interpretation may be relevant as well, at least for older workers. This means that researchers are potentially overestimating the response to work incentives of high wages. This is important because tax cuts are viewed as similar to increases in the wage. Therefore, unless labor supply analyses account for the fact that part-time workers earn less than full-time workers, the work disincentives of taxes may be overestimated. This Chicago Fed Letter summarizes the nature of this problem, our empirical solution, and some public policy issues related to it.
Problem and related policy issues
When economists predict how much an individual will work, it is typically assumed that the worker receives a wage offer and then optimally chooses the number of hours to work based on outside opportunities, such as family responsibilities, wealth, and their spouse’s income. With the exception of overtime hours, it is presumed that workers receive a constant wage rate regardless of hours worked. However, this is not necessarily the case. Rather the wage offered to workers may be determined by the number of hours worked by an employee.
Why would the number of hours an employee works affect their hourly pay? One explanation is that there are fixed costs of employment, such as hiring and training. In many situations, these fixed expenses make part-time workers more expensive to employ per hour at a given wage than full-time workers because the fixed costs must be spread over fewer hours of work. This is particularly relevant for many European countries, where fixed employment expenses are the result of the high regulatory cost associated with hiring and firing employees. But it is also applicable to U.S. labor markets, where lump sum benefits, most notably health insurance, are often not tied to hours worked.
From a research perspective, the relationship between hourly wage rates and hours worked is a fundamental empirical problem in labor economics. Standard labor supply models that estimate the impact of the wage rate on whether and how much someone works (the wage elasticity) only make sense if wages do not depend on hours worked. Otherwise, lower wage offers at lower hours worked bias estimates of the typical individual’s wage elasticity. Therefore, it is important to know the causal correlation of hours to wages not just to estimate a part-time wage effect but to properly estimate workers’ labor supply responsiveness to wage offers.
From a policy perspective, the computation of the wage elasticity is the key parameter in designing work incentives in public programs. For example, a properly estimated relationship between hours and wages can be applied to the debate over the level and progressivity of taxes. Advocates of lower and less progressive taxes often appeal to the benefits of labor supply incentives. Their assumption is that workers work more hours if their post-tax wage is higher. The extent to which workers do supply more hours to the market when their after-tax wage is high is usually answered by observing the correlation between wages and hours.
Furthermore, the part-time/full-time wage differential is itself useful for understanding a variety of labor market issues. After all, part-time work is considerable; at any point in time in 1999, approximately 17% of U.S. workers were part time. Some instances when the part-time/full-time decision is particularly relevant include transitions into and out of the labor force. For example, Ruhm (1990) has documented the role of part-time or bridge jobs in the retirement process.1 His work suggests that over half of workers take part-time jobs, many in industries and occupations outside their career job, before fully retiring. Therefore, to fully model the dynamics of retirement, we must understand the tie between wages and hours.
Despite the research and policy importance of this question, many estimates of the part-time wage effect are not persuasive. The fundamental problem is that when an analyst observes a positive correlation between hours and wages it is not clear whether the positive correlation is caused by firms offering higher wages for more hours worked or whether workers supply more hours to the market when their wage is high.
One common strategy to solve such a simultaneity problem is to come up with a third variable, an instrument, that is correlated with hours but not directly with wages. In such a case, the variation in the instrument should cause variation in wages only through its effect on variation in hours. Consequently, the instrument will be correlated with wages only if part-time workers make less than full-time workers.
Past studies of part-time wage effects have used the number of young children in the household and other childbearing demographics as an instrument in a sample of full- and part-time female workers. The reasoning is that having young children reduces a mother’s available time for work. Since the mother works fewer hours, she receives a lower wage if part-time workers receive lower wage offers. However, this is a valid strategy only if young children affect hours worked but do not directly affect wages (say, through unmeasured productivity changes). If young children also restrict the mother’s job opportunities, perhaps because the mother must take a job that also provides daycare, then the mother would have lower wages not because she was a part-time worker but because she faced other work restrictions. This would lead to an overestimation of the effect of part-time work upon wages. Examples using such strategies result in estimates of the part-time/full-time wage differential of up to 30%.
New estimates
Our estimation of the part-time wage differential uses a different identifying strategy than previous studies.2 We take advantage of what we believe is a better instrument for the employment decision, i.e., the work disincentives of the Social Security system.
Most individuals become eligible for Social Security benefits for the first time at age 62. Many of these workers would like to retire before age 62 but cannot because they need Social Security benefits. Between ages 62 and 69, individuals face the Social Security Earnings Test, which is a high tax rate on labor income above a certain threshold and is in addition to federal and state income and payroll taxes. Between ages 62 and 64 benefits lost through the Earnings Test are replaced in the form of higher benefits in the future, resulting in about a dollar of higher benefits in the future for every dollar lost through the Earnings Test. After age 65, however, benefits lost through the Social Security Earnings Test result in only small increases in future benefits. Therefore, the Social Security Earnings Test results in a strong incentive to retire by age 65.
Another reason the Social Security system provides incentives to exit the labor market by age 65 is that for many workers, health insurance is linked to their job until age 65. Many individuals would lose their health insurance if they were to retire early. At age 65, all individuals who are eligible for Social Security are also eligible for Medicare. This means that most individuals who are age 65 and older have reasonable quality health insurance even after they leave their jobs.
The results of these work disincentives can be seen in figures 1 and 2. These figures graph the average number of hours worked by age for working men and women in the Panel Study of Income Dynamics (PSID), a survey that has been following the same families, and their offspring, since 1968. Figure 1 displays the average number of hours worked per week for working men aged 50 to 70, and figure 2 reports the analogous graph for married women.
1. Hours worked, men
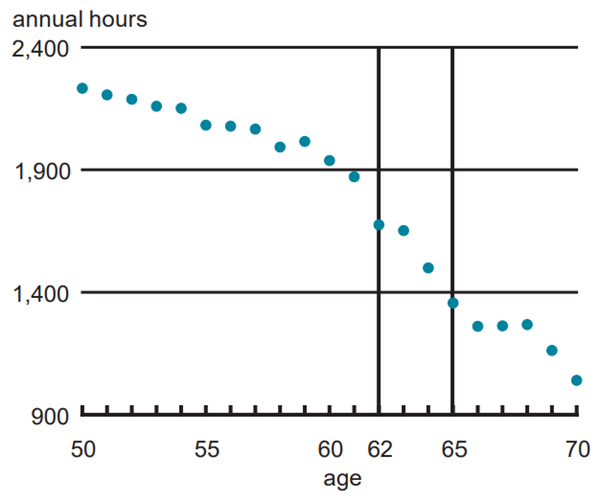
Source: University of Michigan, Institute for Social Research, Survey Research Center, 1968–97, Panel Survey of Income Dynamics, Ann Arbor, MI.
2. Hours worked, married women
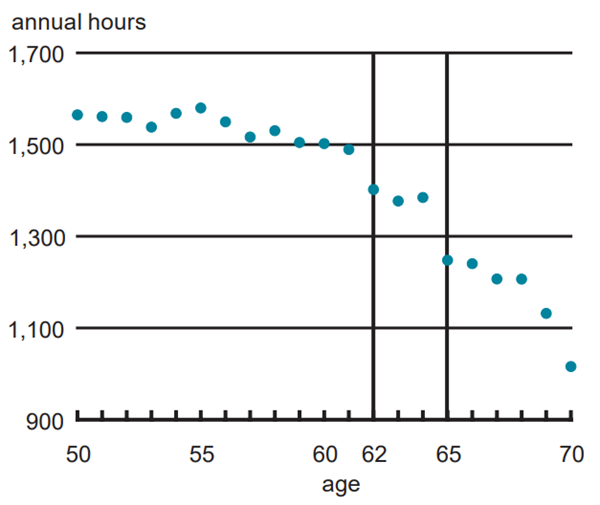
Source: University of Michigan, Institute for Social Research, Survey Research Center, 1968–97, Panel Survey of Income Dynamics, Ann Arbor, MI.
For men, hours slowly begin to decline around age 55 but the biggest drops occur after age 61. Between ages 61 and 62, annual work hours decline 11% from 1,870 to 1,670 hours per year. Hours fall a bit more at ages 63 and 64 before another large 10% drop at 65. After age 65, hours level off. Therefore, the largest declines are at ages 62 and 65. For married women, the picture is even clearer. Hours decline slowly through age 61 but drop 6% at age 62 and 10% at age 65.3 These graphs suggest that Social Security and Medicare laws may play a role in the labor supply decisions of older workers.4
Figures 3 and 4 display average wages for the same PSID working men and married women between the ages of 50 and 70. For men, wages remain relatively flat, with perhaps some modest overall decline, between ages 50 and 61. But at age 62, the average wage of working men drops by 3%. This decline continues from ages 64 through 67, with the biggest drop, 5%, occurring at 65. After age 67, wages flatten out again. For women, the age 62 and 65 drops are starker. Wages actually increase up through age 61 (this is only for older working women and thus selectively includes those who are doing the best in the labor market) but drop by 6% at age 62, remain roughly flat at 63 and 64, and drop again at 65. After age 65, wages are volatile because of small sample sizes.
3. Hourly wage, men
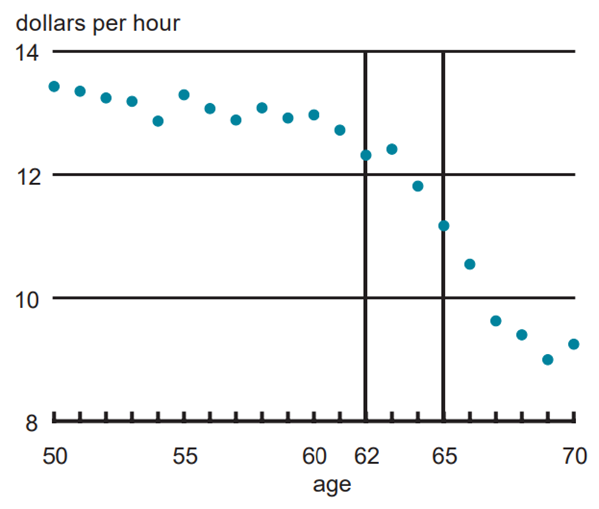
Source: University of Michigan, Institute for Social Research, Survey Research Center, 1968–97, Panel Survey of Income Dynamics, Ann Arbor, MI.
4. Hourly wage, married women
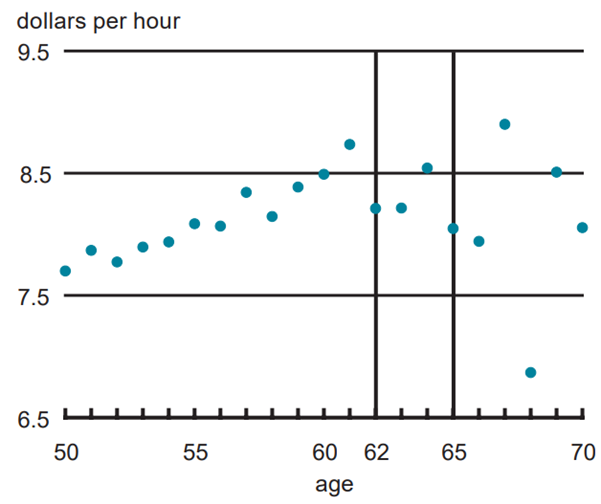
Source: University of Michigan, Institute for Social Research, Survey Research Center, 1968–97, Panel Survey of Income Dynamics, Ann Arbor, MI.
Taken together, figures 1–4 suggest a possible causal relationship between hours and wages. The biggest drop in wages occurs at ages 62 and 65, the same ages at which the Social Security work disincentives kick in. This suggests to us that turning age 62 and 65 are possible instrumental variables that can be used to identify the part-time/ full-time wage differential.
To properly estimate the part-time effect, we must account for several confounding factors. First, part of any age 62 or 65 effect may be due to the natural aging process. Labor force participation, hours, and wages follow a well-documented life-cycle pattern; at older ages, these variables begin to fall for a number of reasons, including the consequences of declining human capital. Human capital theory posits that near the end of the life cycle, workers should invest less in skill development, as they have fewer years left in the labor market to recoup the investment. Therefore, wages should decline as remaining skills decline in value. Declining wages at the end of the life cycle potentially induces declining hours worked at the end of the life cycle. We solve this potential problem by adjusting all hours and wage numbers by the age of the worker.
We must also show that there are no other reasons for wages to drop at ages 62 and 65. Our working paper (see note 2) describes a number of reasons why this assumption might be wrong. Briefly, we highlight two here. First, hour levels within jobs are typically fixed. Therefore, much of the variation used to identify hour changes comes from job switchers. As a result, we must be careful that any wage change is due to an hours change and not to productivity changes that may result from the loss of industry-, firm-, or job-specific human capital. One way we deal with this problem is by looking at workers who have not switched jobs. We find that even among continuously employed workers, both hours and wages have sharp drops at ages 62 and 65.
Second, firms may structure their compensation and pension plans in order to encourage workers to leave by age 62 or 65. Some economic theories imply that employers offer compensation below the productivity of the worker when they are young but reward them with compensation above their level of productivity at the end of their career. This large payday when old motivates young workers to work hard. However, this scheme potentially influences the worker to remain with the firm too long. In order to induce the worker to leave, firms often offer low pension accrual to employees in their 60s. This induces workers to leave their old, high-wage job for new jobs with potentially lower wages. Therefore, there may be a drop in wages at ages 62 and 65 because workers are moving to jobs with lower wages, not because they are working fewer hours. To get around this problem, we look at samples of workers who do not have pension plans. Even among workers without pension benefits, wages decline sharply at ages 62 and 65. Moreover, workers who remain at the same firm have wages that sharply drop at these ages.
Our full results are described in detail in our forthcoming working paper. Briefly, we find evidence that part-time workers earn lower wages. Depending on the specification and the data employed (we use three different data sets), these estimates imply that cutting hours from 40 hours per week to 20 hours per week lowers wages by approximately 20% to 40%. Many of our estimates are significant at the 10% level or higher. These estimates are generally larger than estimates using samples of mothers with young children.
Conclusion
Our research suggests that lower work hours may cause lower wages among a nationally representative sample of older workers. This means that researchers are potentially overestimating the response to work incentives of high wages, at least for this age group. This is of central importance because tax cuts are viewed as similar to increases in the wage. Therefore, unless labor supply analyses account for the fact that part-time workers earn less than full-time workers, the response to work disincentives of taxes may be overestimated.
Tracking Midwest manufacturing activity
Manufacturing output indexes (1992=100)
| May | Month ago | Year ago | |
|---|---|---|---|
| CFMMI | 164.9 | 164.5 | 152.8 |
| IP | 149.7 | 149.3 | 142.8 |
Motor vehicle production (millions, seasonally adj. annual rate)
| May | Month ago | Year ago | |
|---|---|---|---|
| Cars | 5.7 | 5.8 | 5.5 |
| Light trucks | 7.1 | 7.2 | 7.1 |
Purchasing managers' surveys: net % reporting production growth
| June | Month ago | Year ago | |
|---|---|---|---|
| MW | 57.4 | 55.2 | 63.9 |
| U.S. | 53.6 | 56.3 | 62.5 |
Purchasing managers' surveys (production index)
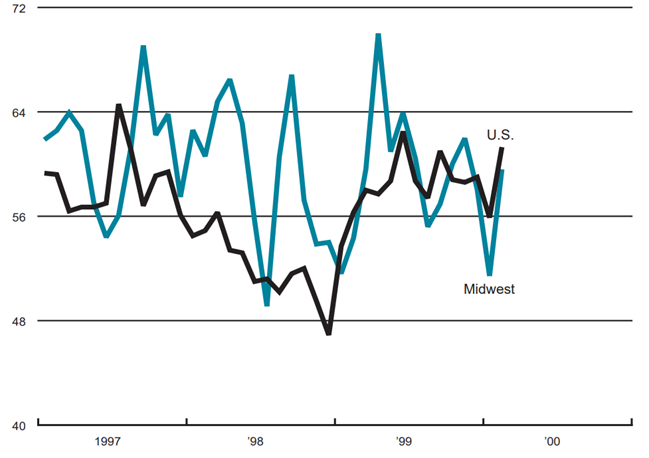
The Midwest purchasing managers’ composite index (a weighted average of the Chicago, Detroit, and Milwaukee surveys) for production increased to 57.4% in June from 55.2% in April. The purchasing managers’ index increased in all three surveys. The national purchasing manager’s survey decreased from 56.3% to 53.6% during this period.
The Chicago Fed Midwest Manufacturing Index (CFMMI) rose 0.3% from April to May, reaching a seasonally adjusted level of 164.9 (1992=100). Revised data show the index was at 164.5 in April, up 0.6% from March. In comparison, the Federal Reserve Board’s Industrial Production Index for manufacturing (IP) increased 0.3% in May, after rising 0.6% in April. Light truck production decreased slightly from 7.2 million units in April to 7.1 million units in May, and car production also decreased slightly from 5.8 million units in April to 5.7 million units May.
Notes
1 Christopher Ruhm, 1990, “Bridge jobs and partial retirement,” Journal of Labor Economics, Vol. 8, No. 4, pp. 482–501.
2 For more details, see Daniel Aaronson and Eric French, 2000, “Do part-time workers have lower wages than full-time workers? Evidence from the Social Security budget constraints,” Federal Reserve Bank of Chicago, working paper, forthcoming.
3 Similar pictures of the age 62 and 65 hours decline can be seen in the Current Population Survey (CPS), the government’s main source of hours and employment data.
4 For more formal evidence on the labor supply effects of social security laws, see Eric French, 2000, “The effects of health, wealth, and wages on labor supply and retirement behavior,” Federal Reserve Bank of Chicago, working paper, No. 00-02.


