

The following publication has been lightly reedited for spelling, grammar, and style to provide better searchability and an improved reading experience. No substantive changes impacting the data, analysis, or conclusions have been made. A PDF of the originally published version is available here.
Why has the economic value of education stopped rising over the past ten years? The most likely explanation seems to be that the booming economy of the late 1990s helped to increase the average earnings of all workers, including those at the low end of the skills distribution.
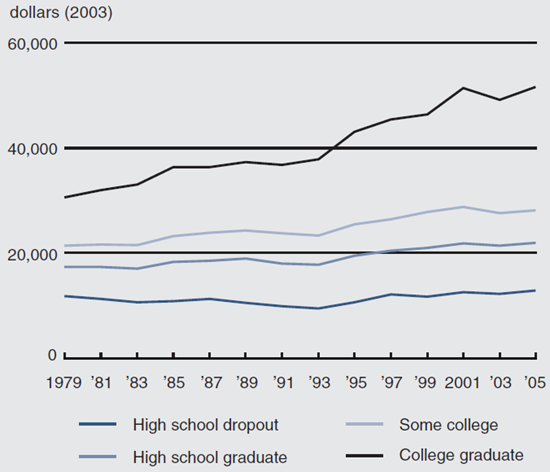
In the 1980s, education was an increasingly worthwhile investment. According to data from the Current Population Survey (CPS), in 1979, men and women with a bachelor’s degree or higher earned $30,507 per year, 77% more than the $17,283 per year earned by workers with only a high school diploma. By 1989, annual earnings of those with a college degree had risen to $37,288, nearly double the $18,952 earned by high school graduates (see figure 1). Similarly, high school graduates earned 47% more per year, on average, than high school dropouts in 1979 ($17,283 versus $11,737), and high school graduates earned 80% more than high school dropouts in 1989 ($18,952 versus $10,522).
1. Average annual income, by education group
Researchers identified a number of likely causes of rising income inequality, including declines in unions and the real value of the minimum wage, as well as growing demand for more highly skilled workers, likely due to technological change. Policymakers considered ways to increase earnings among low-wage workers, such as raising the minimum wage, expanding the earned income tax credit, and encouraging individuals to get more education. As former President Bill Clinton wrote in 1997, “Today, more than ever before in our history, education is the fault line between those who will prosper in the new economy and those who will not.”1
Changing labor markets in the 1990s
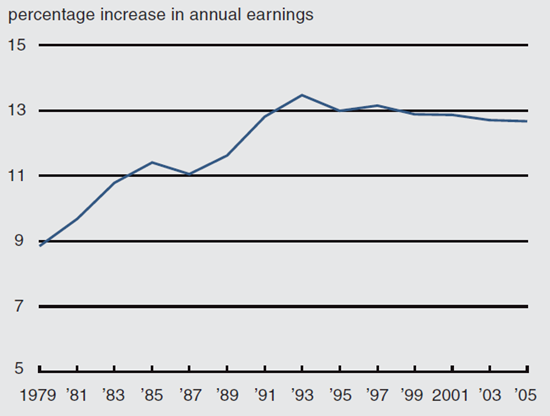
While the economic value of education remains high, its rate of increase has slowed or even declined since the early to mid-1990s.2 Economists measure the economic value of additional schooling as the average percentage increase in mean earnings for an additional year of schooling while controlling for other differences in individual characteristics, such as years of potential work experience, geographic region, sex, race, and marital status. Figure 2 shows that the increase in annual earnings associated with an additional year of schooling was roughly 8.9% in 1979. The value of an additional year of education peaked at 13.5% in 1993 and has since fallen to 12.7% in 2005.
2. Economic value of an additional year of education
The stagnation in the growth of the value of schooling occurred at the same time as college tuition was rising; from 1993 to 2004, average tuition and fees grew by nearly 46%.3 This led some to ask whether a college education was still worth the money. Nevertheless, our previous work suggests that even when the increased cost of college tuition has been taken into account, a four-year college degree is worth at least $300,000 more than a high school diploma over an average working lifetime in net present value terms.4 However, as with many investments, today’s performance is no guarantee of future performance.
So why has the economic value of education declined or stagnated over the past ten years? A large literature in the 1990s hypothesized that the major source of increasing wage inequality of the 1980s was an increase in “skill-biased technological change.”5 Namely, changes in technology increased the productivity of high-skilled workers relative to low-skilled workers, leading to a shift in demand toward more highly skilled labor. As a result, wages for high-skilled workers rose, while wages for low-skilled workers fell. It would seem reasonable, therefore, that an explanation for the leveling off of the return to education might be a slowdown in the increase in demand for such highly skilled labor. While this is certainly possible, we do not consider it the most likely explanation for two reasons. First, as figure 1 shows, there has been a large increase in the wages of college graduates. Similarly, Autor, Katz, and Kearney document that earnings at the 90th percentile of the earnings distribution have been rising steadily relative to median earnings since the early 1970s.6 Second, the supply of highly skilled workers likely increased during this period because of increases in college enrollment and more immigration of high-skilled workers. Between 1996 and 2000, enrollment in two- and four-year degree-granting institutions increased by nearly 7%; also, since 1999, 34% of immigrants entering the U.S. have had at least a bachelor’s degree, compared with 28% of immigrants arriving in the 1990s and 24% of immigrants arriving in the 1980s.7 Overall, the percentage of the population aged 25–65 with at least a bachelor’s degree rose from 26% in 1996 to 30% in 2004 (our calculations based on March CPS data). Autor, Katz, and Kearney also find that the relative supply of college-equivalent labor continued to increase throughout the late 1990s and early 2000s.8 The fact that the wages of college graduates increased so dramatically in spite of the likely increase in the relative supply of college graduates is consistent with increasing—not decreasing—demand.
The average earnings of workers with lower levels of education have also increased since 1993. It is this increase that accounts for the slowing growth in the value of education. Given the growth in the average earnings of college-educated workers, the value of education would have risen at a faster rate since 1993 than it did between 1980 and 1990 if the earnings of those with less education had either decreased or remained constant. And so, we might ask why the earnings of these less-educated workers have increased.
Changes in compensation
One possibility is that the changing earnings trends are an “illusion” driven by changes in compensation practices and/ or changes in labor force composition. For example, if highly educated workers increasingly receive compensation in the form of benefits, such as health insurance, while less-educated workers are less likely to receive health insurance, the value of education in terms of total compensation may be increasing at a faster rate than the value measured by wages and salaries alone. Pierce finds that compensation inequality was increasing faster than wage inequality through the mid-1990s and that it was driven largely by declines in the health insurance coverage rate for workers at the bottom of the distribution.9 Data from the U.S. Bureau of Labor Statistics’ Employer Costs for Employee Compensation indicate that employer benefits costs have been rising faster than wage and salary costs since 2000, which, depending on the distribution of the benefits, could mean that the value of education in terms of total compensation may have continued to rise at a high rate. In contrast, we think there is less support for labor force composition changes that contribute to the slowing of the growth in the value of education. Over the past ten years, labor force participation among high school dropouts has been increasing (even when assuming all incarcerated people are high school dropouts), while participation rates for those with more education have been falling. These changes in participation would more likely lead to an increase in the estimates of the value of education if we assume that within the completed education category, the expected earnings of the individuals who are not participating in the labor market are lower than the observed earnings of the individuals who are participating in the labor market. Of course, there may be other changes in the composition of the labor force that might explain these trends.
Minimum wage increases in the late 1990s may also have helped increase the wages of the least-skilled workers. However, minimum wage increases are unlikely to fully explain the trends for two reasons. First, the latest increase in the federal minimum wage was in late 1997, two years after average wages of the least-skilled workers began to increase. And, the federal minimum wage has not been changed since then, such that it cannot account for further increases in the wages of low-skilled workers. Although 17 states and the District of Columbia have raised their minimum wages above the 1997 federal minimum, several large states—including Florida, New Jersey, and New York—did not enact minimum wages above the federal minimum until 2005.10 Thus, only 30% of payroll employment was in states with minimum wages above the federal minimum as of January 1, 2004, making it unlikely that these state minimum wages fully account for changes in average wages across the entire country.11 Second, although Lee finds that the fall in the real value of the minimum wage can explain much of the increase in inequality at the bottom of the wage distribution over the 1980s (implying that the minimum wage increases of the mid-1990s also propped up wages at the bottom of the wage distribution), Autor, Katz, and Kearney question this interpretation.12 They highlight that much of the decline in the real value of the minimum wage during the 1980s occurred during an economic downturn; whereas, the minimum wage increases in the 1990s were legislated during economic expansions. As a result, the time series relationship between inequality and the minimum wage may be spurious. Further, both studies note the anomaly that the minimum wage seems to be related to inequality at both the bottom and the top of the wage distribution.
Conclusion
The booming economy of the late 1990s appears to have increased the average earnings of all workers, including those at the low end of the skills distribution. Studies of labor market cyclicality show that earnings and (especially) employment are procyclical and that less-educated individuals experience greater cyclical variation than more-educated individuals.13
The puzzle associated with this explanation, however, is why wages of the least educated continued to rise or at least did not fall relative to those of the more educated during the 2001 recession. Any explanation for the changes in the economic value of education over the past 15 years will likely involve a combination of the many factors discussed in this article. Going forward, the recent push to increase the minimum wage will likely help keep the value of education from increasing rapidly in the near future. That said, large shifts in the relative demand for, or supply of, more-educated or less-educated labor could change that. For now, at least, the value of education in terms of earnings remains near its peak, providing much incentive for young people to pursue a college education.
Notes
1 William J. Clinton, 1997, Call to Action for American Education in the 21st Century, special report prepared by U.S. Department of Education, Washington, DC, February 14, available at www.ed.gov/updates/PresEDPlan, accessed on April 4, 2005.
2 This discussion draws heavily on Lisa Barrow and Cecilia Elena Rouse, 2005, “Does college still pay?” The Economists’ Voice, Vol. 2, No. 4, article 3, available at www.bepress.com/ev/vol2/iss4/art3. Material used with permission from the publisher, The Berkeley Electronic Press, ©2005.
3 Authors’ calculations based on data for undergraduates from the U.S. Department of Education and Institute of Education Sciences, National Center for Education Statistics, 2005, National Postsecondary Student Aid Study, Data Analysis System (DAS) online application.
4 Barrow and Rouse (2005).
5 For example, see John Bound and George Johnson, 1992, “Changes in the structure of wages in the 1980s: An evaluation of alternative explanations,” American Economic Review, Vol. 82, No. 3, June, pp. 371–392; and Lawrence F. Katz and Kevin M. Murphy, 1992, “Changes in relative wages, 1963–1987: Supply and demand factors,” Quarterly Journal of Economics, Vol. 107, No. 1, February, pp. 35–78.
6 David H. Autor, Lawrence F. Katz, and Melissa S. Kearney, 2006, “The polarization of the U.S. labor market,” American Economic Review, Vol. 96, No. 2, May, pp. 189–194. They further document that since the late 1980s, both high- and low-skilled jobs have grown relative to “middle-skilled” jobs (routine cognitive and manual tasks, e.g., bookkeeping and repetitive production labor). This “polarization” of the labor market, they argue, is driven by computers directly substituting for middle-skilled tasks, complementing high-skilled labor, and having no direct effect on low-skilled jobs.
7 For data on college enrollment, see T. D. Snyder, A. G. Tan, and C. M. Hoffman, 2004, Digest of Education Statistics, 2003, U.S. Department of Education and Institute of Education Sciences, National Center for Education Statistics, Washington, DC: Government Printing Office, No. NCES2005-025, table 174, available at www.nces. ed.gov/programs/digest/d03/tables/xls/tab174.xls, accessed on April 1, 2005. For the educational attainment of immigrants, see U.S. Census Bureau, 2004, Current Population Survey, Foreign-Born Population in the United States, March, annual data tables (PPL-176), table 2.5, available at www.census.gov/population/www/socdemo/foreign/datatbls.html, accessed on January 16, 2007.
8 David H. Autor, Lawrence F. Katz, and Melissa S. Kearney, 2005, “Trends in U.S. wage inequality: Re-assessing the revisionists,” National Bureau of Economics Research, working paper, No. 11627, September.
9 Brooks Pierce, 2001, “Compensation inequality,” Quarterly Journal of Economics, Vol. 116, No. 4, November, pp. 1493–1525.
10 The 17 states are Alaska, California, Connecticut, Delaware, Florida, Hawaii, Illinois, Maine, Massachusetts, Minnesota, New Jersey, New York, Oregon, Rhode Island, Vermont, Washington, and Wisconsin, along with the District of Columbia. See John J. Fitzpatrick, Jr., 2006, “State labor legislation enacted in 2005,” Monthly Labor Review, Vol. 129, No. 1, January, pp. 3–29.
11 Authors’ calculations using payroll employment data from the CPS as of January 2006.
12 David S. Lee, 1999, “Wage inequality in the United States during the 1980s: Rising dispersion or falling minimum wage?” Quarterly Journal of Economics, Vol. 114, No. 3, August, pp. 977–1023.
13 Hilary W. Hoynes, 2000, “The employment and earnings of less skilled workers over the business cycle,” in Finding Jobs: Work and Welfare Reform, Rebecca Blank and David Card (eds.), New York: Russell Sage Foundation, pp. 23–71; and James R. Hines, Jr., Hilary W. Hoynes, and Alan B. Krueger, 2001, “Another look at whether a rising tide lifts all boats,” in The Roaring Nineties: Can Full Employment Be Sustained?, Alan B. Krueger and Robert M. Solow (eds.), New York: Russell Sage Foundation, pp. 493–537.


