This article looks at the relationships between internet searches for unemployment-related terms, unemployment insurance (UI), and the public health orders issued in the U.S. during the Covid-19 pandemic. We find that Google searches for unemployment-related subjects surged before the record increase in initial UI claims, which in turn peaked before the public health orders were implemented. As of mid-April 2020, these orders covered the vast majority of the U.S. population. Since then, the rates of increase in both search activity and initial UI claims have slowed.
In this Chicago Fed Letter, we explore the relationships between daily Google searches for unemployment-related subjects, weekly initial unemployment insurance claims, and public health orders (stay-at-home, shelter-in-place, and nonessential business closure orders) imposed by U.S. state and local governments in response to the Covid-19 pandemic. A sizable increase in search interest in unemployment and similar terms preceded the historic increase in initial UI claims in late March and early April of 2020 by several days. Growth in initial UI claims in turn peaked several days before state and local public health orders went into effect. By mid-April 2020, these orders had covered close to 95% of the U.S. population.1 Since then, the rates of increase in both Google search activity for unemployment-related subjects and initial UI claims have slowed.
A historic surge in new UI claims
As the Covid-19 pandemic led to the widespread shutdown of nonessential businesses, over 30 million new unemployment insurance claims (seasonally adjusted) were filed during the six-week period between March 15 and April 25, 2020. By comparison, just over 1.2 million claims were filed in a similar six-week period during February and early March of this year. Previously, the six-week record for seasonally adjusted initial UI claims was 3.9 million claims—set during the 1981–82 recession and nearly matched at the height of the Great Recession of 2007–09.2
Service sector businesses, including restaurants, bars, and personal services establishments, have been affected particularly badly by the pandemic. To take one oft-cited example, according to OpenTable, online reservations for restaurants in its network have ceased completely in many large cities that are under stay-at-home orders.3 Moreover, Homebase—an online scheduling and time-tracking firm that serves numerous small businesses—reports that almost 50% of their clients have closed since January of this year and that the hours worked by hourly employees of their clients is down by almost 60%.4 Many service industry workers have been let go outright by their employers.
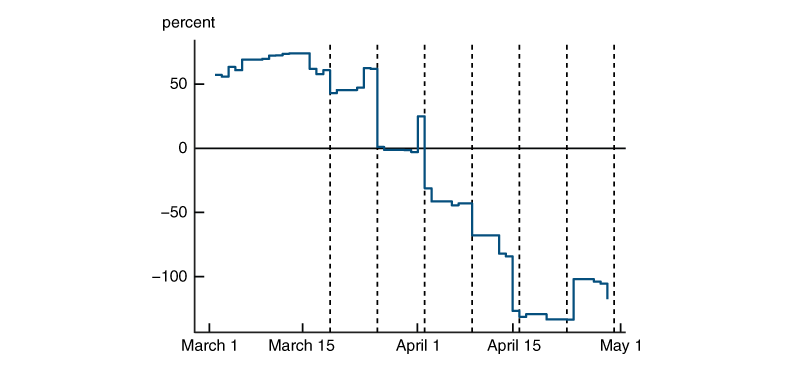
Forecasters were caught off guard by the sudden surge in new UI claims (see figure 1). The Citigroup U.S. Economic Surprise Index—which measures the deviation of actual data from the Bloomberg survey’s median forecast—saw sharp declines on days when UI claims data were released, indicating that initial claims came in well above the consensus forecast. The few forecasters who were not surprised by these large increases typically relied on extrapolating early daily reporting of UI claims by states; high-frequency measures of labor market activity, such as the Google Trends index made popular by Choi and Varian (2012);5 or a combination of both.
1. Citigroup U.S. Economic Surprise Index, 2020

Sources: Authors’ calculations based on data from Citigroup and the U.S. Department of Labor from Haver Analytics.
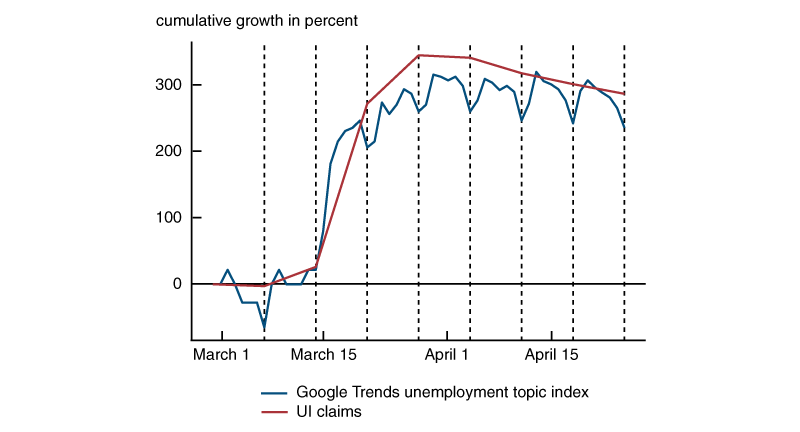
By mid-March 2020, it had become clear from looking at the Google Trends unemployment topic index for the U.S. as a whole (see figure 2 and note 5) that a seismic shift was happening. Starting on March 14, search interest in unemployment-related terms increased by over 200% over five days, eclipsing the growth seen at any point during the 2007–09 recession. Overall, the growth in this Google Trends index from March 14 through March 31 was 320%, roughly equaling the growth in U.S. initial UI claims over the same period of time (see figure 2).6 While growth in these web searches had leveled off some by mid-April, search levels remained historically high. At the same time, more initial UI claims were approved in the six weeks between March 15 and April 25 of this year than during the first 15 months of the 2007–09 recession.7
2. Google search activity and initial UI claims for the U.S., 2020

Sources: Authors’ calculations based on data from the U.S. Department of Labor from Haver Analytics and Google Trends.
Notably, the recent sharp spike in national search interest for unemployment-related terms strongly resembles state-level search activity after the landfall of major hurricanes, such as Hurricane Harvey in 2017 and Hurricane Katrina in 2005.8 Aaronson et al. (2020) use this observation to build a forecasting model for new UI claims based on state-level Google Trends unemployment topic indexes. Remarkably, they show that a large portion of these new UI claims can be predicted solely on the basis of the Google Trends data. In the next section, we take a closer look at this relationship and its correlation with the public health orders put in place during the pandemic.
Impacts of social distancing
Many states, counties, and municipalities have implemented various social distancing measures through public health orders in response to the Covid-19 pandemic. However, there has been substantial heterogeneity in the rollout of these orders, in terms of both the timing and manner in which they were put into effect. Some states rapidly implemented broad bans on economic and social activity, while others took a piecemeal approach. In states that took the latter approach, some local governments imposed their own orders. Finally, there is a small subset of mostly rural states that have not taken statewide or significant local action.9
Somewhat surprisingly, stay-at-home, shelter-in-place, and nonessential business closure orders appear not to have had direct effects either on Google search interest in unemployment and related subjects or on initial UI claims. Instead, such search interest and UI claims rose in advance of these orders, reflecting endogenous private sector and local-public-sector responses to the spread of Covid-19. By early March, many private sector firms had begun to take steps to limit people’s exposure to the virus, as had many local officials who closed public schools and universities.
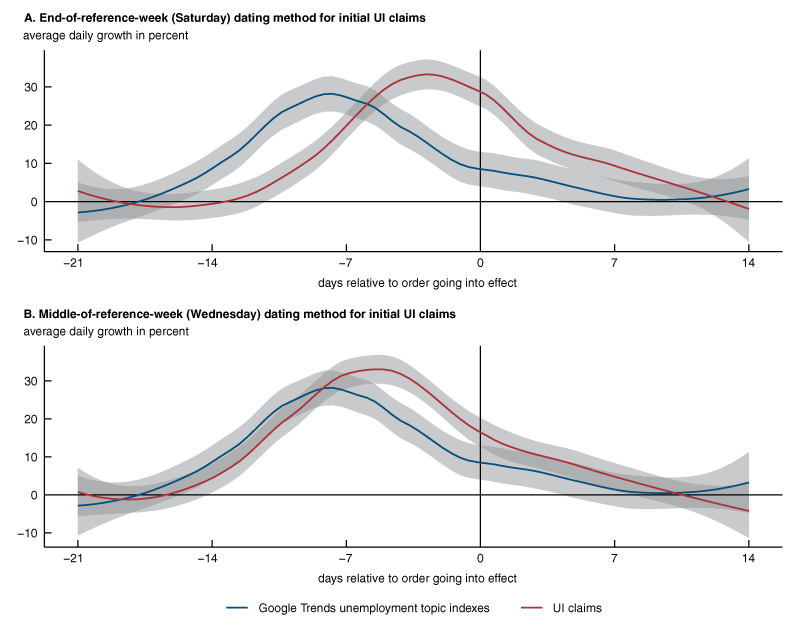
This pattern is shown in figure 3. We plot the smoothed means of state-level daily growth in initial UI claims (red line) and search activity for unemployment-related terms according to Google Trends (blue line), both weighted by state population.10 The horizontal axis represents days relative to the first major public health order in a state.11 A negative (positive) number along that axis represents days before (after) that first order. One practical issue is that the date ranges for weekly UI claims will vary depending on whether we use the end of the reference week (Saturday) or the middle of the reference week (Wednesday). Choosing between these two dating methods affects our results when comparing UI claims with the daily Google Trends search data and the public health orders. In the figure, we show both ways of dating the weekly UI claims in relation to the search data and public health orders.
3. Google search activity and initial UI claims for U.S. states around the timing of public health orders, 2020

Sources: Authors’ calculations based on data from the U.S. Department of Labor from Haver Analytics and Google Trends.
We find that Google search interest in unemployment-related subjects led the surge in initial UI claims by two to five days, depending on the method of dating the claims data. Growth in UI claims in turn then tended to peak before stay-at-home and similar major public health orders were implemented by three to six days.12 Growth in both measures then tapered off gradually after their respective peaks, but remained positive until about one to two weeks past the order’s date of implementation. The relative timings of these peaks before the public health orders went into effect suggest that, for the most part, these orders just codified and enforced existing trends, at least in terms of labor market activity. If the orders had an additional direct impact on either UI claims or search interest in unemployment-related subjects, we would instead expect to see a sharp increase in the growth rates of UI claims or search interest on or immediately after the date that the order went into effect.13
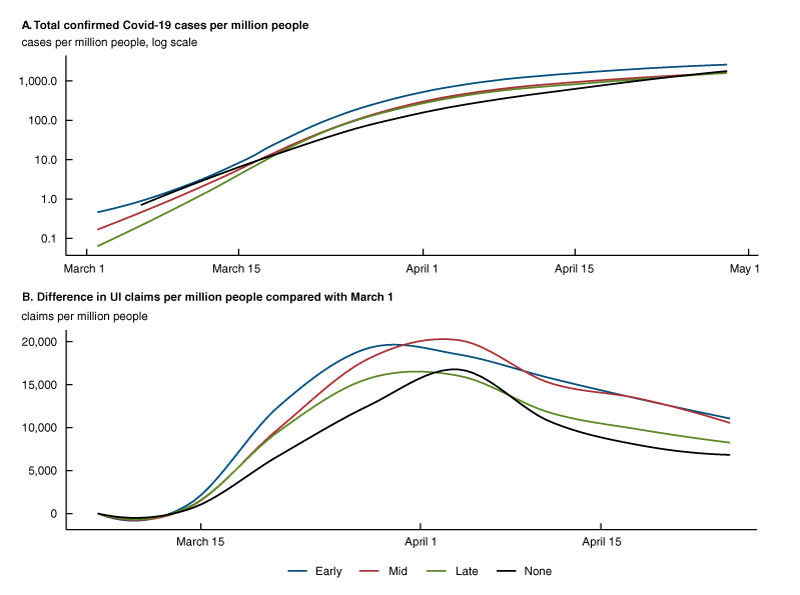
The analysis in figure 3, however, masks much of the regional heterogeneity in the response to the pandemic. One way to see this is in figure 4, which plots both confirmed Covid-19 cases and initial UI claims on a per capita basis by implementation date of public health orders for four groups of states (early, mid, and late implementers and nonimplementers). The differences in the timing of public health order implementations largely matched the spread of the virus—states with earlier outbreaks of the virus (primarily those on the East and West Coasts) moved first, and states with later outbreaks (mostly those in the Midwest and the South) followed suit. Early implementers saw the first upticks in the growth of UI claims, as well as earlier declines in the rates of growth in new claims (although the levels remain at unprecedented highs). In contrast, states that implemented orders later on or not at all saw UI claims begin to rise later, and have only recently started to see declines in the growth rates of new claims.
4. Confirmed Covid-19 cases and initial UI claims for U.S. states, by public health order implementation category, 2020

Sources: Authors’ calculations based on data from the U.S. Department of Labor from Haver Analytics and Johns Hopkins University.
Conclusion
Since mid-April, some states have extended their public health orders, while others have eased them. Based on our findings, state-level Google Trends indexes for unemployment-related subjects could be useful leading indicators for the stabilization and recovery of national and local labor markets. Notably, several states are reporting substantial backlogs of UI claims submitted in recent weeks.14 So, it may take some time before weekly initial UI claims reflect the most current labor market conditions. For those interested in tracking these developments in real time, national and state-level forecasts of UI claims based on the Google Trends data and the Aaronson et al. (2020) model will be posted weekly on this webpage.
Notes
1 See Alexander and Karger (2020) for the details of this calculation.
2 All UI claims values discussed in this paragraph and elsewhere in this article are based on data from the U.S. Department of Labor from Haver Analytics.
5 As Choi and Varian (2012) explain, Google Trends can generate a time series index of the volume of queries about a certain topic, such as unemployment, that Google users enter within a specific geographic area. Examples of forecasters who used such indexes to predict the historic surge in initial UI claims include Aaronson et al. (2020) and Sojourner and Goldsmith-Pinkham (2020).
6 Compound daily growth rates of initial UI claims are calculated from weekly growth rates in both figures 2 and 3.
7 Cajner et al. (2020) use weekly data from the payroll processor ADP (Automatic Data Processing Inc.) to draw a similar conclusion with payroll employment data for the U.S.
8 This observation is also made in Bram and Deitz (2020).
9 For the dates on which different social distancing and virus mitigation measures were taken in the 50 U.S. states and the District of Columbia, see the accompanying appendix.
10 We use nonseasonally adjusted numbers for state initial UI claims. The U.S. Department of Labor reports a seasonally adjusted number only for the U.S. as a whole. Daily growth of Google search interest is calculated using the inverse hyperbolic sine first difference transformation to account for occasional zero values of the Google Trends state indexes. For these isolated instances, using log first differences (which produce missing values) or interpolating leads to similar results.
11 Looking at days relative to when the public health order went into effect allows us to use a common timeline because states that did issue public health orders implemented them at different times. Gupta et al. (2020) and Baek et al. (2020) adopt similar approaches in their investigations on the timing of social distancing behaviors and how they relate to stay-at-home orders and economic activity. In some instances, we consider local-level public health orders for a large portion of a state’s population to effectively be a state-level order (e.g., St. Louis’s and Kansas City’s public health orders, which preceded Missouri’s order) in our analysis.
12 There was some surprise that, according to U.S. Bureau Labor of Statistics (BLS) data from Haver Analytics, total nonfarm payroll employment fell by roughly 700,000 in March. The BLS nonfarm payroll survey covered activity during the week of March 12, 2020—days before even the first statewide public health order (by California) had been implemented. However, our results suggest layoffs were well under way by then, especially in states that implemented public health orders early.
13 Alexander and Karger (2020) also find meaningful changes in the distance traveled, visits to nonessential businesses, and consumer spending before county-level public health orders were implemented, but an additional discontinuous effect on the day of the order. Of course, some of the effects ahead of an order’s implementation may be in anticipation of an eventual order. Note, however, that similar timing patterns arise in states that implemented orders relatively early and those that implemented orders relatively late.
14 See, e.g., Guilford (2020).
References
Aaronson, Daniel, Scott A. Brave, R. Andrew Butters, Daniel Sacks, and Boyoung Seo, 2020, “Using the eye of the storm to predict the wave of Covid-19 UI claims,” Federal Reserve Bank of Chicago, working paper, No. 2020-10, revised April 16, 2020. Crossref
Alexander, Diane, and Ezra Karger, 2020, “Do stay-at-home orders cause people to stay at home? Effects of stay-at-home orders on consumer behavior,” Federal Reserve Bank of Chicago, working paper, No. 2020-12, revised April 18, 2020. Crossref
Baek, ChaeWon, Peter B. McCrory, Todd Messer, and Preston Mui, 2020, “Unemployment effects of stay-at-home orders: Evidence from high-frequency claims data,” VoxEU.org, April 30, available online.
Bram, Jason, and Richard Deitz, 2020, “The coronavirus shock looks more like a natural disaster than a cyclical downturn,” Liberty Street Economics, Federal Reserve Bank of New York, blog, April 10, available online.
Cajner, Tomaz, Leland D. Crane, Ryan A. Decker, Adrian Hamins-Puertolas, and Christopher Kurz, 2020, “Tracking labor market developments during the COVID-19 pandemic: A preliminary assessment,” Finance and Economics Discussion Series, Board of Governors of the Federal Reserve System, No. 2020-030. Crossref
Choi, Hyunyoung, and Hal Varian, 2012, “Predicting the present with Google Trends,” Economic Record, Vol. 88, No. s1, June, pp. 2–9. Crossref
Guilford, Gwynn, 2020, “Some states’ unemployment claims surged as national rate fell,” Wall Street Journal, April 23, available online by subscription.
Gupta, Sumedha, Thuy D. Nguyen, Felipe Lozano Rojas, Shyam Raman, Byungkyu Lee, Ana Bento, Kosali I. Simon, and Coady Wing, 2020, “Tracking public and private responses to the COVID-19 epidemic: Evidence from state and local government actions,” National Bureau of Economic Research, working paper, No. 27027, April. Crossref
Sojourner, Aaron, and Paul Goldsmith-Pinkham, 2020, “Coronavirus job losses for the past two weeks could match two years of the Great Recession’s job losses,” Working Economics Blog, Economic Policy Institute, April 3, available online.


