

On March 17, 2020, seven counties in the San Francisco Bay Area put into place the first stay-at-home orders in the United States. In the following weeks, counties and states implemented a cascading sequence of stay-at-home orders, bans on public gatherings, shutdowns of nonessential businesses, and face mask mandates. But as small businesses began to face financial insolvency, states and counties began easing these restrictions. To evaluate the effectiveness of policies restricting mobility and business activity, it is important to document the effects of reopening businesses on public health and economic activity. In this Chicago Fed Letter, we measure the relationship between state-level reopenings of nonessential businesses and health outcomes (Covid-19 cases and deaths), mobility, and revenue at small and large retail businesses.
Underlying our analysis of these outcomes is a hand-collected data set of state- and county-level reopening orders, based on the New York Times’ reopening tracker map.1 We measure state reopening dates by the first date any county in the state reopened nonessential businesses for in-person shopping. The definition of a “nonessential” retail business varied by state, but often included such businesses as restaurants, hair salons, and retail stores.
Health outcomes and mobility
We begin by looking at patterns of health outcomes and mobility. We use data from the COVID Tracking Project describing new coronavirus cases and deaths. The COVID Tracking Project is a data collection effort conducted by the Atlantic Monthly Group, which collects data directly from state public health authorities and official press releases from governors and public health authorities.2 We use Unacast data on visits to nonessential businesses to measure mobility (see Alexander and Karger, 2020).3
We present two sets of figures for the health outcomes and mobility data. One set separates states into six groups according to the week they reopened,4 and the second set combines the reopening states into the following two groups to simplify the plots: 1) early reopeners—reopened nonessential businesses in the first three weeks, from April 20 to May 10; and 2) late reopeners—reopened nonessential businesses after May 10.
New Covid-19 reported cases and deaths
Figure 1, panel A, shows dramatic changes in Covid-19 caseload patterns based on the timing of a state’s reopening. States that were late to reopen had high caseloads in April and have seen dramatically lower case counts through May and June. Meanwhile, early reopening states initially had fewer than six cases per 100,000 residents in April and May, but that changed for the worse in mid-June (panels A and B). Since mid-June, the number of new cases in early reopening states has risen sharply to more than 25 cases per 100,000 residents. Not only is this rate higher than the current caseload in other states, but it also exceeds other grouped states’ peak Covid-19 case levels in March and April.5 Strikingly, even within the early reopening states, new case growth was faster in states that reopened earlier (figure 1, panel A). As the earliest reopening state was South Carolina on April 20, these differences by week of reopening have persisted for more than three months.
1. New cases and deaths
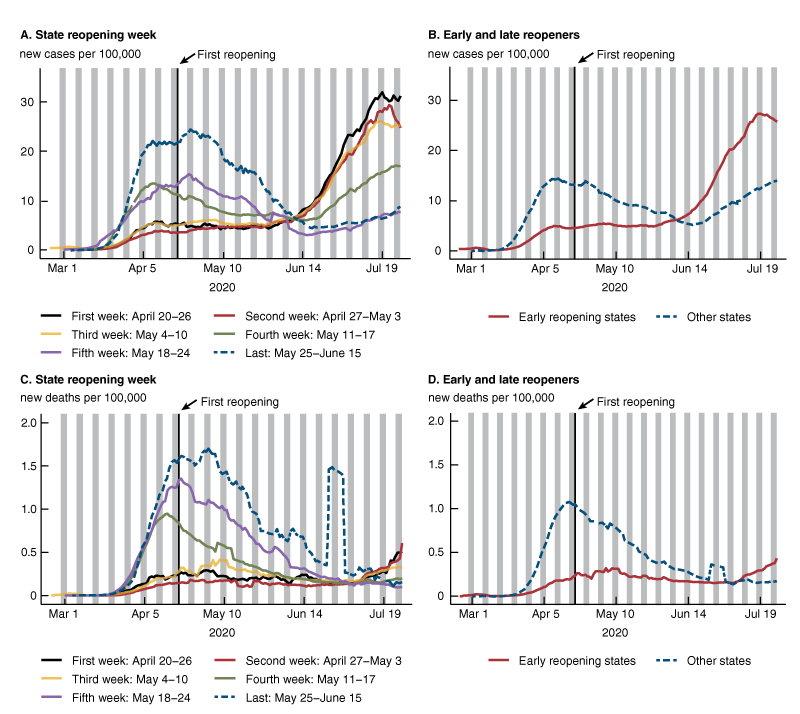
Source: Authors’ calculations based on data from the COVID Tracking Project.
In the past few weeks, the number of deaths due to Covid-19 has risen in states that reopened early (figure 1, panels C and D). In line with rising infection rates, the number of deaths per capita in these early reopening states trends upward with a roughly four-week lag relative to the initial increase in reported cases (panel C). While the late reopening states are now also seeing an upward trend in cases, it has not yet affected their Covid-19 death rates.
Mobility
Next, we analyze trends in mobility. Using data from Unacast, we construct a measure of mobility defined as the percent change in the number of visits to nonessential businesses relative to the average number of pre-pandemic visits to nonessential businesses between February 15 and March 7, 2020. We plot a seven-day moving average of this measure in figure 2.
2. Mobility: Visits to nonessential businesses
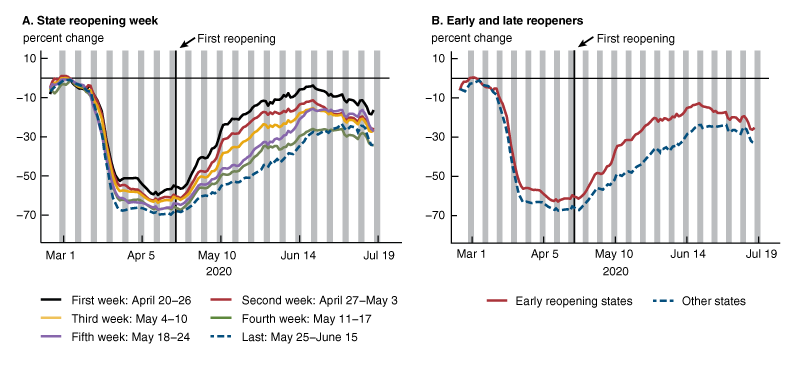
Source: Authors’ calculations based on data from Unacast.
In line with the goals of the reopening policies, the data plotted in figure 2, panels A and B, show that states’ reopening policies were associated with an increase in the mobility of their residents. The reopening orders correlate with increases in average levels of mobility in all states during May and June from a nadir of –65% in mid- to late March. Early reopening states saw an earlier and stronger increase in mobility, which persisted until late June. Again, when we break out the data by week of reopening, we find the mobility growth was faster in states that reopened earlier (figure 2, panel A).
Over the past month, however, early reopening states have experienced decreases in mobility, causing convergence in the mobility measures between the early and late reopening states (figure 2, panel B). Early and late reopening states now look fairly similar, clustering at a 30% decline in mobility relative to pre-pandemic levels, on average.
Putting together the trends in mobility and case volumes, we see that states with the earliest increases in mobility (i.e., the early reopening states) are the same states shown in figure 1 to be currently experiencing a surge in cases. Further, we see that the early reopening states have experienced a 10% decline in mobility since mid-June, which matches the beginning of the surge in cases in these states (see figure 1). This pattern suggests that increasing Covid-19 case rates may discourage mobility, even in the absence of legal shutdown orders. However, the recent decline is dwarfed by the initial decline in mobility in late March.
Business revenues
Given the evidence of a strong increase in visits to nonessential businesses following state reopenings, we next look at business revenue to see how reopening policies affected consumer behavior. Specifically, we look at the following outcomes: small business revenue at restaurants (using data from Womply6) and consumer spending at large businesses (using data from Second Measure7). We separate large business spending into three mutually exclusive spending categories that may be most affected by reopenings: retail stores, Amazon, and food delivery services. All values represent a seven-day moving average of the percent change in average per consumer spending relative to the average per consumer spending between February 15 and March 7, 2020.
In mid-March, immediate changes in consumer behavior in response to the Covid-19 pandemic led to a precipitous 40%–50% decrease in small business revenue of restaurants and a commensurate 60%-plus increase in consumer spending on food delivery services across all states. We also see a 40% increase in Amazon spending and a 10%–20% decline in consumer spending at large retail businesses.
As the restrictions on nonessential businesses eased, we find that there was a somewhat faster rebound in the revenue of restaurants (figure 3, panel A) and large retail stores (figure 3, panel D) among early reopening states relative to other states. In parallel, we see that consumer spending on food delivery services (figure 3, panel B) and at Amazon (figure 3, panel C) did not increase as much in states that were early to reopen nonessential businesses, as mobility and spending at small businesses recovered. The difference in consumer behavior in these groups of states, which carried forward through mid-June, is consistent with the evidence on increased mobility in early reopening states relative to other states.
3. Business revenues by timing of reopening (Womply and Second Measure)
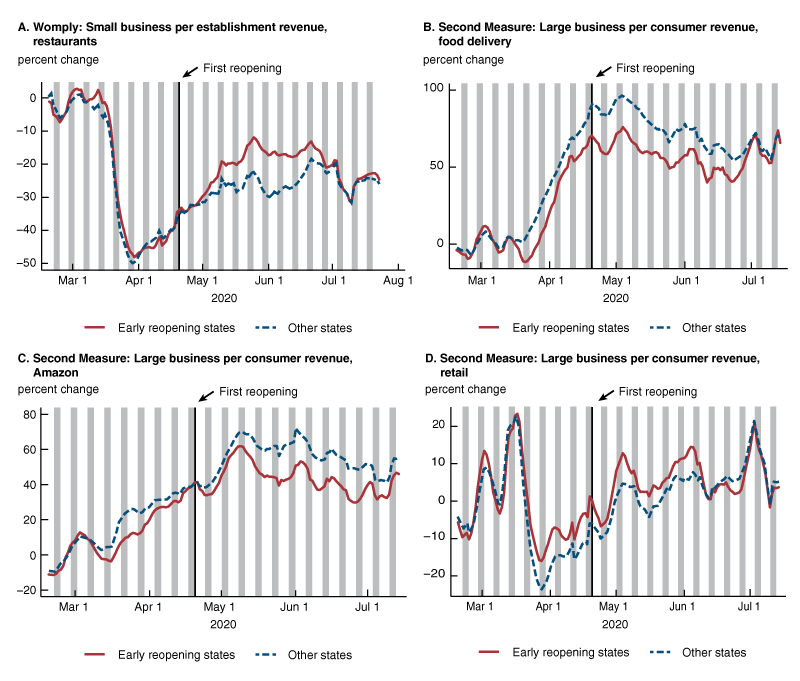
Sources: Authors’ calculations based on data from Womply and Second Measure.
Trends from mid-June to today
Consistent with the resurgence of Covid-19 cases, we find that since mid-June there has been a recurrence of the spending patterns we saw during the initial outbreak in mid-March. Restaurant revenue has decreased by more than 10% across all groups of states since mid-June, with early reopening states—many of which are currently experiencing significant increases in Covid-19 cases—seeing the largest decline (figure 3, panel A). In response, consumer spending on food delivery services has increased again (up by roughly 10%), and this increase is most prominent in early reopening states (figure 3, panel B). It appears that consumer behavior in early reopening states and other states has now largely converged, despite the initial acceleration of spending in the early reopening states.
Consumer spending at large retail companies spiked up to 10%–20% above pre-pandemic levels across all groups of states at the beginning of July, and then steeply declined. This pattern could represent consumers stocking up and/or turning back to online retail purchases, though it appears to be partially driven by a recurring monthly cyclicality in the data. Another possible explanation is that consumers are shifting toward larger, online retailers due to the surge in Covid-19 cases. The evidence on food delivery and Amazon spending increasing for all groups, particularly in states currently experiencing a surge in Covid-19 cases (figure 3, panels B and C), is consistent with this story as well.
Conclusion
Our analysis documents the relationship between the timing of states’ reopening and health outcomes (Covid-19 cases and deaths) and consumer responses (mobility and business revenues). Relative to states that reopened later, early reopening states experienced a faster recovery of business activity in the short term—for example, increased mobility in reopened states is reflected in increased consumer spending at restaurants. However, these gains may have come at the expense of an eventual increase in Covid-19 cases and deaths. The recent resurgence in Covid-19 cases, particularly in early reopening states, appears to have stalled or reversed this trend in both mobility and consumer spending.
Notes
1 More information about the data is available online.
2 More information about the data is available online.
3 For a complete description of the mobility data, see Diane Alexander and Ezra Karger, 2020, “Do stay-at-home orders cause people to stay at home? Effects of stay-at-home orders on consumer behavior,” Federal Reserve Bank of Chicago, working paper, No. 2020-12, May, revised June 22, 2020. Crossref
4 States that reopened in the first week: Alaska, Georgia, Oklahoma, and South Carolina; second week: Alabama, Colorado, Idaho, Maine, Mississippi, Montana, North Dakota, Texas, Utah, and Wyoming; third week: Arkansas, Arizona, Florida, Hawaii, Iowa, Indiana, Kansas, Missouri, North Carolina, Nebraska, Nevada, Pennsylvania, Rhode Island, Tennessee, and West Virginia; fourth week: California, Louisiana, Maryland, New Hampshire, New Mexico, New York, Ohio, Oregon, Virginia, Washington, and Wisconsin; fifth week: Connecticut, Kentucky, Massachusetts, Michigan, Minnesota, and Vermont; last to reopen: Illinois, Washington DC, Delaware, and New Jersey. South Dakota is excluded because it never implemented a statewide closure of nonessential businesses.
5 As an important caveat, we can only measure reported cases, and the amount of testing increased significantly from early May to mid-July.
6 Womply is a local commerce platform that provides marketing and financial applications and interfaces for small and medium-sized American businesses. Among other services, they assist companies with payment processing, billing, and payments, which are used to construct the measures of spending used in this analysis. For more information about our construction of this spending panel, see Alexander and Karger (2020).
7 Second Measure is a consumer data analytics company that analyzes large business purchasing data to provide insights on company performance and consumer behavior. For more information about our construction of this spending data, see Alexander and Karger (2020).


