Economic Mobility Project
Policy Briefs
  • Print
  • Email

Policy Brief, February 2022
If You Build a Library, Children Will Come—and Learn More, Too

In communities across America, local policymakers rely on data-driven research to help them gauge potential returns to public investment. But while a wealth of data on schools and infrastructure has made it possible to measure the effects of spending in these areas and others, one area of significant local importance has been historically understudied: investment in public libraries.

In 2018, local governments in the U.S. spent more than $12 billion funding the operation of 17,000 libraries. That same year, children checked out more than 750 million library items and attended library events more than 80 million times.

Thanks to detailed new data on nearly all public libraries and schools in the U.S., we’re able to observe the direct effects of these investments. In a new study co-authored with Gregory Gilpin at Montana State and Peter Nencka at Miami University, we not only show that spending on libraries increases library usage, but also uncover a direct, causal link between spending on libraries and higher student reading scores.

Children still need and use libraries

To study how spending on libraries impacts library usage, we combine data on local capital spending that funds major renovations and new library buildings with data on library spending, revenue, and usage. These data are collected annually by the Institute of Museum and Library Services.

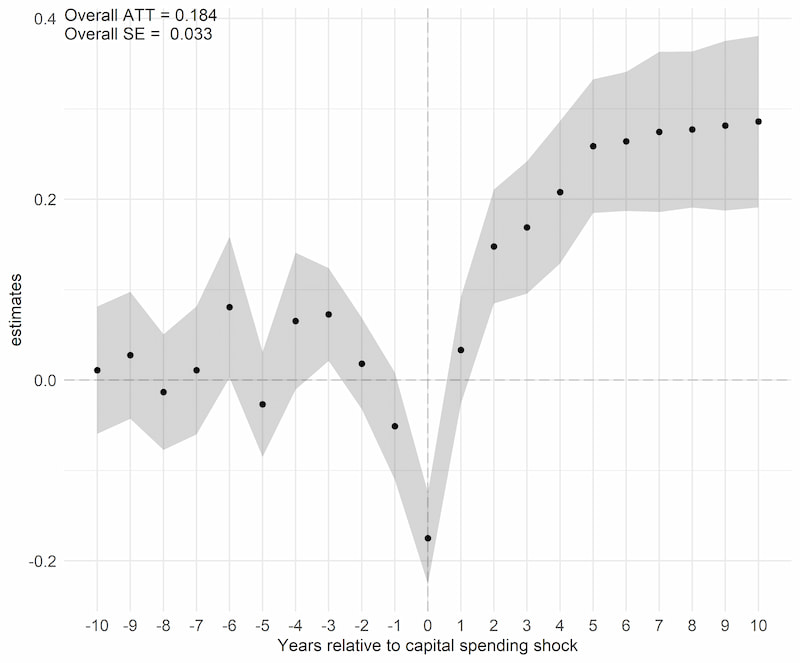
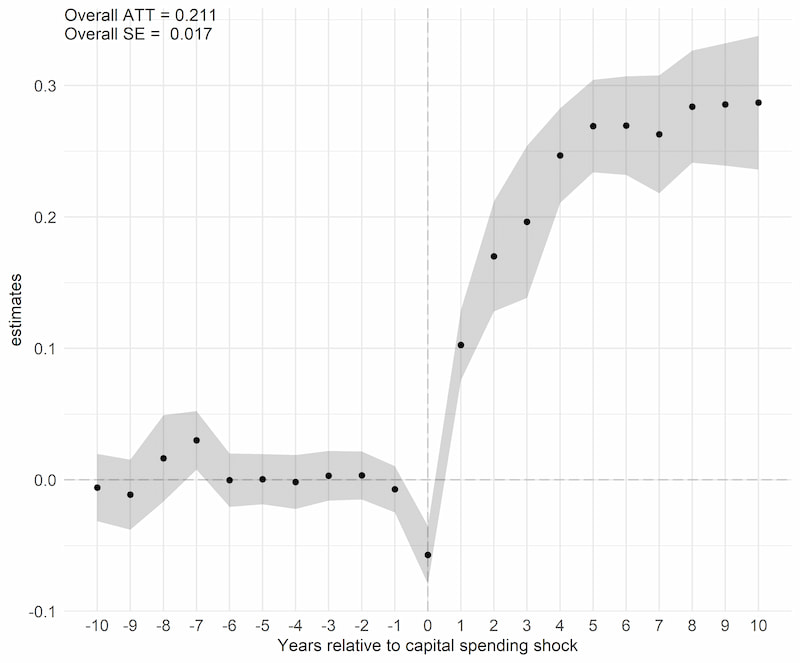
We find that local capital investment in public libraries from 1982 to 2018 increases library visits by 21%, increases children’s checkouts of items by 21%, and increases children’s attendance at library events by 18%. What’s more, these increases in usage persist for at least ten years after the investment.

Log children’s circulation
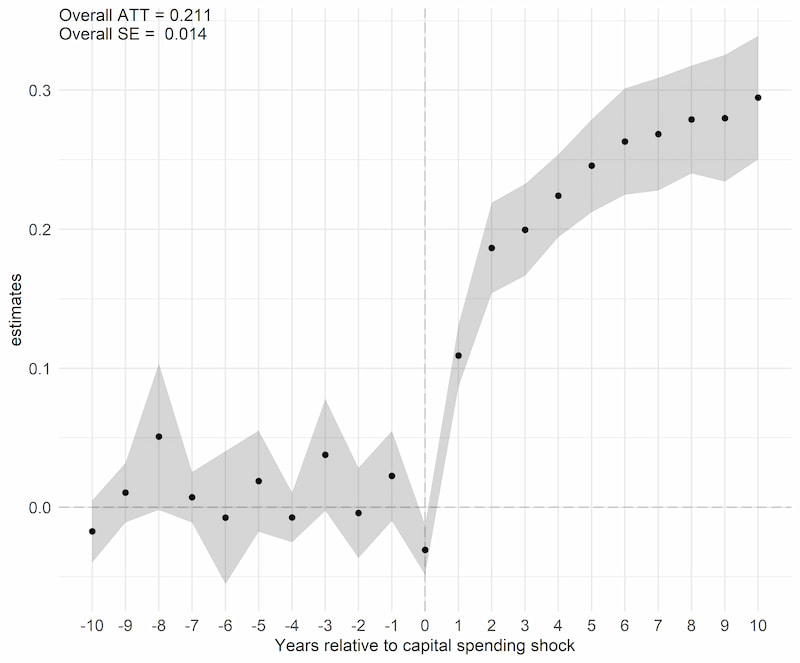
Figure plots the change in children’s circulation surrounding a sharp increase in capital library investment.  X-axis is years and Y-axis is the log change in children’s circulation, which is roughly the same as a percent change. Figure shows no change in children’s circulation in the years leading up to the sharp increase in capital spending, but in the years immediately after the capital spending, children’s circulation jumps significantly.

Log children event attendance

Figure plots the change in children’s event attendance surrounding a sharp increase in capital library investment.  X-axis is years and Y-axis is the log change in children’s event attendance, which is roughly the same as a percent change. Figure shows no change in children’s event attendance in the years leading up to the sharp increase in capital spending, but in the years immediately after the capital spending, children’s event attendance jumps significantly.

Log visits

Figure plots the change in library visits surrounding a sharp increase in capital library investment. X-axis is years and Y-axis is the log change library visits, which is roughly the same as a percent change. Figure shows no change in library visits in the years leading up to the sharp increase in capital spending, but in the years immediately after the capital spending, library visits jump significantly.
Event study estimates generated using the Callaway and Sant’Anna (2020) procedure described in Section 3 at the library-system level. A library spending shock is defined in Section 3. The outcome variables are (A) Log capital spending, (B) Log children’s circulation, (D) log children’s event attendance, and (D) log visits. All figures show bootstrapped 95 percent simultaneous confidence intervals. Unlike pointwise confidence intervals, simultaneous confidence intervals include the path of treatment over time with 95% confidence and account for the dependence of the presented coefficients across event-times. Standard errors are clustered by library system

These results look the same when we focus on more recent time periods. In short, the research shows that even in the era of the smartphone, there’s a large, untapped demand for local library resources. If you build a library, people—and especially children—will come and use it.

How libraries boost reading scores

Importantly, increases in book checkouts following investments show that communities rely on libraries for much more than computer access. Even today, people use libraries to read.

To study whether there’s a causal link between investing in libraries and student outcomes, we analyze district-level reading and math test scores for 3rd–8th graders in more than 5,000 school districts, courtesy of the Stanford Educational Data Archive (SEDA).

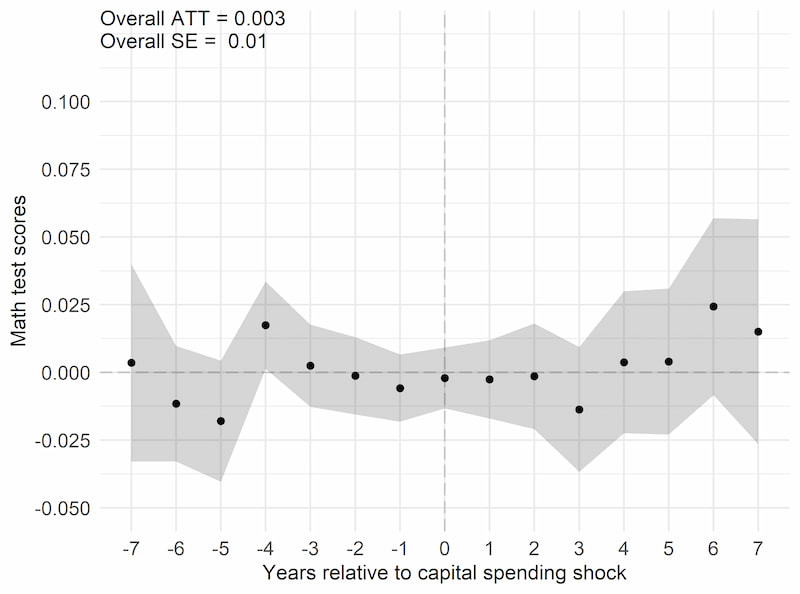
We find that when communities invest $1,000 or more per student in a local library, the reading test scores of students in nearby school districts increase by 0.02 standard deviations, on average, in the seven years following the investment. Unsurprisingly, given libraries’ focus on reading, we find no increase in student math scores.

Reading Test Scores
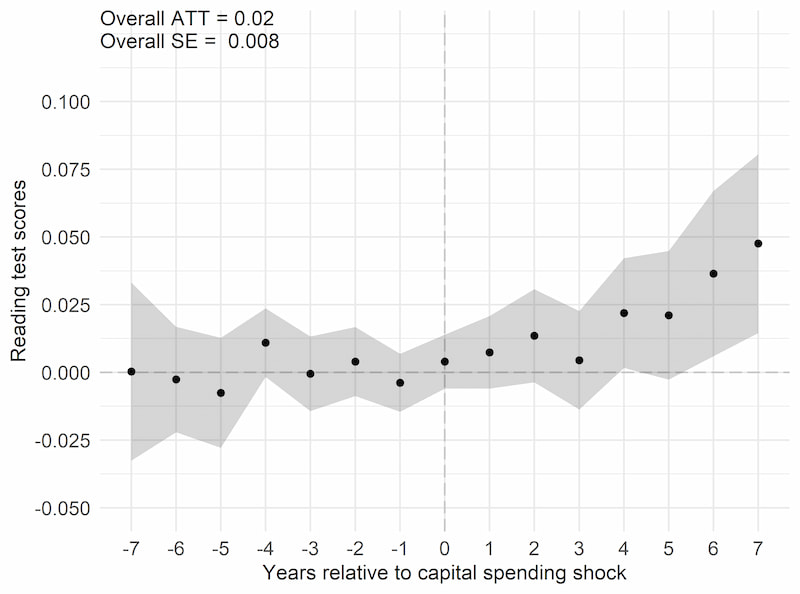
Figure plots the change in reading test scores surrounding a sharp increase in capital library investment. X-axis is years and Y-axis is the change in the average reading test score (measured in standard deviation units). Figure shows no change in reading test scores in the years leading up to the sharp increase in capital spending, but in the years immediately after the capital spending, reading test scores test scores of nearby children increase significantly.

Math Test Scores

Figure plots the change in math test scores surrounding a sharp increase in capital library investment. X-axis is years and Y-axis is the change in the average math test score (measured in standard deviation units). Figure shows no change in math test scores in the years leading up to the sharp increase in capital spending, and in the years immediately after the capital spending, math test scores of nearby children are not affected.
Event study estimates generated using the Callaway and Sant’Anna (2020) procedure described in Section 4 at the school district level. All figures show bootstrapped 95 percent simultaneous confidence intervals. Unlike pointwise confidence intervals, simultaneous confidence intervals include the path of treatment over time with 95% confidence and account for the dependence of the presented coefficients across event-times. Standard errors are clustered by school district.

Libraries are an effective, popular public investment

Interestingly, we find that in the years following a large capital investment, spending on libraries has no positive or negative effect on local housing prices, implying that homeowners value the improvement in local amenities enough to offset the cost of the local tax increases that fund the renovations and new buildings.

Taken together, the findings from this new research are good news for library lovers and even better news for communities looking for effective ways to improve young people’s educational outcomes.

Our paper shows that investment in public libraries is an evidence-based way to improve both community resources and student outcomes.

To learn more, download the full paper.


Opinions expressed in this article are those of the author(s) and do not necessarily reflect the views of the Federal Reserve Bank of Chicago or the Federal Reserve System.

Having trouble accessing something on this page? Please send us an email and we will get back to you as quickly as we can.

Federal Reserve Bank of Chicago, 230 South LaSalle Street, Chicago, Illinois 60604-1413, USA. Tel. (312) 322-5322

Copyright © 2024. All rights reserved.

Please review our Privacy Policy | Legal Notices