

Over the past 11 months, the Federal Reserve has raised the federal funds rate (FFR) at the fastest pace since the 1980s. This tightening of monetary policy was to combat inflation that surged in 2021 to levels not seen in 40 years and remained high throughout 2022.
In this Chicago Fed Letter, we use a quantitative macroeconomic model to tackle the question of whether the response of the Federal Reserve (the Fed) to recent high inflation is consistent with its historical behavior. This is an important question because systematic deviations from past behavior could lead the private sector to revise its expectations about how the Fed will respond to inflation going forward, which, according to macroeconomic theory, could affect its ability to stabilize inflation in the future.
We find that the fast tightening of 2022 was broadly in line with the Fed’s historical behavior. However, to evaluate the overall stance of monetary policy, it is also important to consider the market path of the FFR, i.e., the path expected by market participants. This path affects the longer-term interest rates that individuals and businesses face when making their consumption and investment decisions. The market path expected in 2022:Q4 has the FFR peaking 75 basis points lower than is consistent with past tightening cycles. It stays flat until 2023:Q4 and then declines at a gradual pace that is consistent with past Fed behavior, but at a lower level. Our model explains this gradual pace with the persistently high levels of inflation in 2022 and the Fed’s historical tendency to spread out its response to inflation over time. Despite the market path being more dovish overall compared to the Fed’s historical behavior, the model’s forecast of inflation has it falling to near the Fed’s 2% target by the end of 2025.
There is an important lesson to learn from the gradual pace of interest rate reductions in the market path. According to the model, what matters for stabilizing inflation is not so much the response of the interest rate to current inflation at the beginning of a tightening cycle but the expectations that the cumulative increase in the interest rate over the full cycle is sufficiently strong. Consequently, even if interest rates are raised more slowly than inflation rises, a central bank can still effectively stabilize inflation if financial markets expect that rates will be cut slowly when inflation is on the way down. This lesson is of particular importance when prices rise so rapidly that raising interest rates faster than inflation in the short run could destabilize financial markets.
Comparing tightening cycles
In panel A of figure 1, we compare the path of the FFR in 2022 to the past four tightening cycles (1994–95, 1999–2000, 2004–06, and 2015–18). In panel B, we show core PCE inflation during each of these tightening cycles. As one can notice from panel A, in 2022 the Fed raised the FFR faster than in any of the previous tightening cycles. While informative, these comparisons are insufficient to gauge the current stance of monetary policy.
First, in the previous tightening cycles the Fed was dealing with considerably lower inflation, as shown in panel B of figure 1. Therefore, it is possible that the current tightening actually entails a weaker response to inflation than before. Adjusting the rise in interest rates for the increase in inflation is critical to assess the effects of a monetary tightening on aggregate demand. It is the real cost of funds to a borrower and the real yield to a lender or to an investor that matters for households’ and firms’ decisions.
1. Federal funds rate and inflation during the five most recent tightening cycles
A. Cumulative increase in federal funds rate
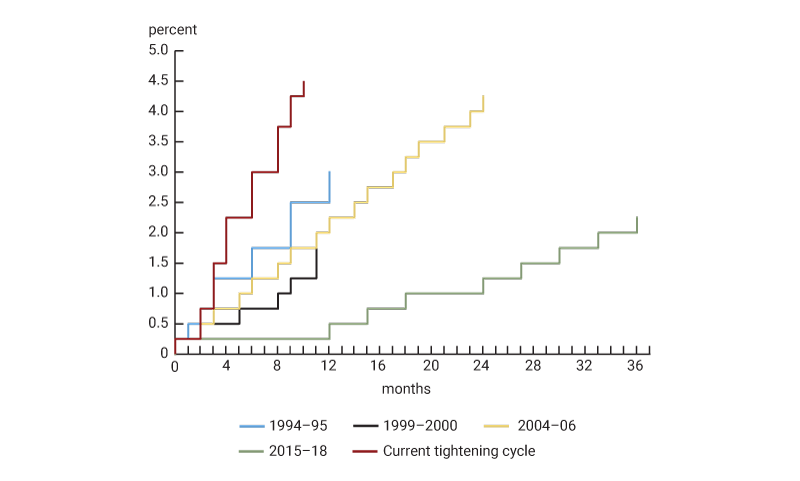
B. Year-over-year core PCE inflation
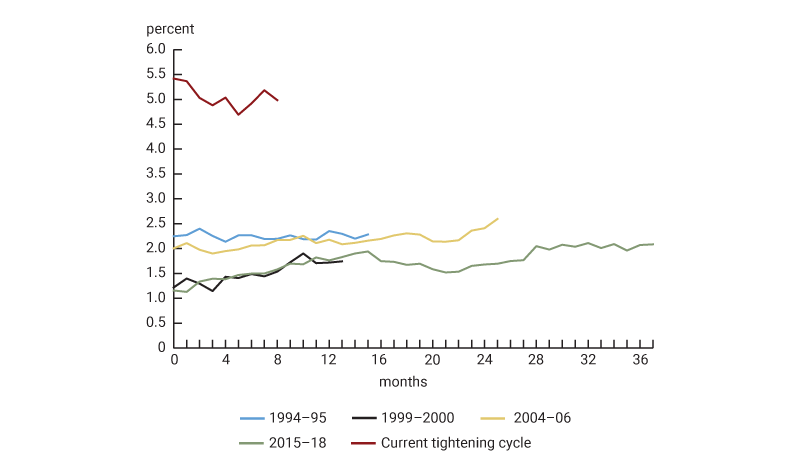
Source: Haver Analytics.
Second, the FFR in and of itself provides only an incomplete characterization of the stance of monetary policy. A more comprehensive characterization includes the path of the FFR expected by financial markets. The market path influences the longer-term interest rates that govern choices to consume and invest. Thus, changes in the expected path of interest rates are likely to influence economic conditions today.
We consider a model that takes these considerations into account. The next section describes monetary policy in the model and our empirical strategy. More details about the model and how we estimate it can be found in Ferroni, Fisher, and Melosi (2022).1
Analytical framework
In the model, the central bank sets the short-term nominal interest rate (the equivalent of the FFR) according to a mathematical rule. This rule posits that the interest rate responds to deviations of inflation from the central bank’s target (the inflation gap) and deviations of output from its long-run time-varying trend (the output gap), as well as the previous quarter’s interest rate (the inertial component).2 The first two components reflect the Fed’s commitment to pursuing its dual mandate of maximum employment and price stability.3 The inertial component of the rule captures central banks’ inclination to spread out their policy responses to inflation and output over time. The inertial component is essential for the rule to fit the dynamics of the FFR in the historical data and arguably reflects policymakers’ concern that abrupt changes in interest rates may disrupt financial markets.
In the model, monetary shocks capture deviations of the FFR from the estimated policy rule. When the deviations from the rule are negative, the central bank is more accommodative relative to its historical behavior. And when the deviations are positive, the central bank is more restrictive. If the FFR and the market path are always consistent with the estimated rule, our model would not detect any deviations from the rule—the monetary shocks would all be equal to zero.
We estimate the model using a large set of macroeconomic and financial data, including the market path.4 We assume that agents in the model expect the market path. The estimated rule is interpreted as capturing the historical behavior of the Fed in our estimation sample period, 1993–2016. This is a period in which U.S. monetary policy has been successful at stabilizing inflation, validating the use of the estimated rule as a benchmark.
Model-based comparison of tightening cycles
We assess the stance of monetary policy by comparing the current and expected FFR predicted by the estimated policy rule to the current FFR and the market path.5 Figure 2 displays our main findings. This figure compares the FFR in 2022 (gray line) and the market path from 2022:Q4 (blue line) with the path consistent with the estimated policy rule (orange line). The path consistent with the historical rule to the left of the vertical line is based on data up to 2022:Q4. To the right of the vertical line, this path is based on the model’s forecast of the inflation and output gaps conditioned on 2022:Q4 data.
2. Comparing the path of the federal funds rate (FFR) with the Fed’s historical behavior

Sources: Haver Analytics, Federal Reserve Bank of New York, and authors’ calculations.
The figure shows that the quick and robust tightening of monetary policy in 2022 (gray line) is roughly consistent with the Fed’s historical behavior as it is only slightly more contractionary (positive yellow bars) than the historical response (orange squares), just 40 basis points above what the historical response would have called for. However, going forward from 2022:Q4, the market path has the FFR becoming more accommodative than the historical rule (negative yellow bars). The market path in 2022:Q4 peaks at about 5% in 2023, while the historical rule peaks 75 basis points higher. The market path stays flat until 2023:Q4 and then declines at a gradual pace similar to the historical rule, but at a lower level.
We can use the model to understand why the Fed was expected to lower its policy rate slowly. To do this, we decompose the difference between the actual FFR (gray line) or the market path (blue line) and the market path as of 2021:Q4 (dashed blue line) into the parts contributed by the output (pink bars) and inflation (green bars) gaps and the inertial component (red bars).
At the end of 2021, the Fed was expected to lift off the FFR from its effective lower bound in 2022:Q2 and to keep raising rates at a gradual pace. At the end of 2022, after inflation had been high for a year and a half, the market path was revised up substantially and was hump-shaped.
The model explains this revision through a combination of shocks that hit the economy in 2022, which have persistent effects on the output and inflation gaps. Shocks in the model unexpectedly change the economic environment in which agents make their decisions. Examples of these shocks include persistent productivity shocks that affect potential output, transitory supply shocks that directly impact inflation, and the monetary shocks. The monetary shocks allow our model to account for revisions in the market path that are not accounted for by the nonmonetary shocks. Their contribution is shown by the yellow bars.6
By affecting agents’ decisions, the nonmonetary shocks lead to changes in the current and expected future path of the output and inflation gaps. This prompts the central bank to respond by adjusting the current interest rate and changes the path of interest rates expected by the model’s economic agents through their understanding of the policy rule. The pink and green bars capture the central bank’s immediate response to the revised paths of the output and inflation gaps, respectively, due to the nonmonetary shocks that occurred in 2022. The large inflation gap in 2022 explains a substantial share of the difference between the FFR and the market path as of 2021:Q4.
In the forecasting period, which lies on the right of the vertical line, the inertial component (red bars) accounts for the lion’s share of the revision in the market path at the end of 2022. This large role played by the inertial component mostly stems from the combination of the extraordinarily fast increase in inflation in 2022 and the central bank’s historical tendency to spread out its response to inflation over time.
The market path that is expected by agents in our model coincides with relatively benign inflation, which as of 2022:Q4 is forecast to be 2.2% by the end of 2025 (not shown). From a shock-accounting point of view, the benign outlook arises from the effects on inflation of the model’s nonmonetary shocks from 2022:Q4 and earlier waning over time. But this does not mean that monetary policy—specifically the historical rule—does not play a role in shaping the inflation outlook.
First, in the model, the interest rate path expected by agents after the ten quarters of the market path is determined by the historical rule. After ten quarters, the rule has the FFR jumping up and staying higher for some time. This offsets the accommodation from the dovish market path and therefore contributes to the benign outlook for inflation.
Second, the market path being systematically lower than the historical rule may lead market participants to expect a weaker response of monetary policy to inflation going forward. In the model this would make it more difficult for the central bank to stabilize inflation (see, for example, Clarida, Galí, and Gertler, 2000.)
Conclusion
In this Chicago Fed Letter, we have presented some model-based evidence that the robust monetary tightening carried out by the Fed in 2022 is broadly in line with its historical behavior. We have also shown that in 2022:Q4, the market path peaks 75 basis points lower than the historical rule. The market path stays flat until 2023:Q4 and then declines at a gradual pace similar to the historical rule, but at a lower level. According to the model, this gradual pace does not decrease the central bank’s ability to pursue price stability.
Our analysis is subject to a number of caveats. It is based on the assumption that U.S. monetary policy can be approximated by a fixed rule and that estimating this rule adequately captures the historical behavior of the Federal Reserve. This assumption is convenient because it allows us to interpret the observed deviations of the market path from the estimated rule. Yet this is only one way to interpret these deviations. They could also reflect combinations of changes in how the Fed responds to economic shocks, risk management that is not captured in our estimated rule, and markets pricing in macroeconomic risks.7 While our approach is a useful benchmark to evaluate the stance of monetary policy, it is not the only valid approach, and our results should not be interpreted as a direct measure of that stance.
Moreover, our model’s forecasts for GDP and inflation may differ from the markets’ forecasts. This difference may contribute to explaining why the model’s estimated historical rule prescribes a higher path for the FFR than markets expect. For instance, the market path could be lower than the historically consistent path because markets forecast softer economic growth and inflation than our model. We try to mitigate this issue by incorporating one- to four-quarter ahead expectations for GDP growth and inflation from the Survey of Professional Forecasters to inform the model’s forecasts. This addition renders our model’s forecasts for GDP growth and inflation very similar to those in that survey. To the extent that its forecasts accord well with the views of financial markets, this issue of the discrepancy between the model’s and the markets’ forecasts becomes less relevant.
Another caveat is related to the unprecedented nature of the ongoing inflationary pressures, which to some extent reflects supply disruptions due to the pandemic and the mitigation policies implemented by governments all over the world. In our analysis, we do not explicitly model the health and economic consequences of the pandemic, nor does our model feature these supply disruptions. We address this issue by modeling the outbreak of Covid-19 using a flexible econometric methodology that we developed in a recent paper (Ferroni, Fisher, and Melosi, 2022). In that paper, we show that this methodology can help economic models account for the unusual nature of the Covid-19 recession and recovery. However, this approach might only partially capture the extraordinary mix of economic and policy shocks set off by the onset of the pandemic.
Notes
1 The model belongs to the broad class of medium-scale dynamic stochastic general equilibrium models, which are shown to be well-suited to account for U.S. business cycle dynamics and to forecast economic aggregates, such as gross domestic product (GDP) and inflation. See, for example, Christiano, Eichenbaum, and Evans (2005), Smets and Wouters (2007), and Del Negro, Giannoni, and Schorfheide (2015).
2 The inflation gap is defined as the average of the two-period lagged, one-period lagged, current, and expected one-quarter-ahead inflation gaps. The output gap is defined similarly.
3 The output gap is a proxy for the employment gap (i.e., employment minus full employment). The link between these two gaps is regulated by Okun’s law.
4 Our measure of the market path is the median path taken from the Survey of Market Participants conducted by the Federal Reserve Bank of New York before regular meetings of the Federal Open Market Committee, the Fed’s monetary policymaking body.
5 One complication is that the market path might incorporate asymmetric risks to the economic outlook perceived by market participants. We abstract from this issue, but it is an important one. For instance, if market participants view risks to the outlook for economic activity as tilted toward the downside, then the market path will be lower than otherwise. This would be interpreted by our model as a dovish deviation from the historical rule.
6 As the market path would correspond to the historical rule without the monetary shocks, the yellow bars are equal to deviations of the market path from the historical rule.
7 Evans, Fisher, Gourio, and Krane (2015) discuss how empirically risk-management considerations have played a significant role in guiding monetary policy and show theoretically that risk management affects the optimal timing of liftoff from the zero lower bound.


