

Both consumer and small business sentiment indexes remain very pessimistic by historical standards. In this article, we take a closer look at possible explanations. Our analysis suggests that after the Covid-19 recession in the United States, the responses of consumers and small business owners to sentiment-related surveys have become less sensitive to labor market conditions.
More than three years into the recovery from the pandemic recession in the U.S.,1 traditional measures of both consumer and small business sentiment have yet to return to pre-pandemic levels. In fact, since April 2020, some measures, such as the University of Michigan’s Index of Consumer Sentiment, have continued to flirt with all-time lows, coming in at or below levels last seen in the aftermath of the Global Financial Crisis. Much commentary has been written on this topic.2 In this Chicago Fed Letter, we take a closer look at possible explanations for why sentiment has become persistently pessimistic.
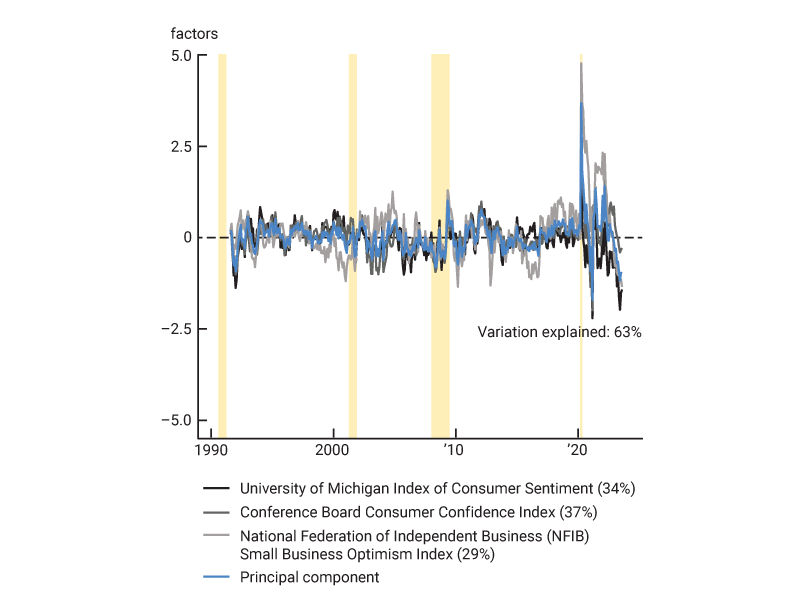
We begin by reestablishing the fact that others have recently documented: Statistical models based on a small set of economic variables can explain the vast majority of movements in prominent sentiment measures for the U.S. before April 2020. But these same models are unable to explain the persistently lower values observed after March 2020. To make this point, we focus on the University of Michigan Index of Consumer Sentiment, the Conference Board Consumer Confidence Index, and the National Federation of Independent Business (NFIB) Small Business Optimism Index.
We show that, historically, a first principal component (discussed in greater detail later) can explain over 60% of the discrepancy between the three sentiment indexes and our models’ predictions for them based on a handful of economic indicators. This suggests that whatever is holding back these indexes at the moment is likely to be a shared concern for both consumers and small business owners. Finally, we consider two possible explanations for their persistent pessimism: 1) a change after March 2020 in the average level of optimism conditional on prevailing economic conditions and 2) differences in the implicit weights assigned by survey respondents after March 2020 to various economic indicators.
For the University of Michigan index, we find, as others have, some evidence that the average level of optimism conditional on prevailing economic conditions has fallen since the Covid recession ended—a so-called pandemic effect. However, this feature is not broadly shared across the three sentiment indexes we examine. Instead, what statistically explains most of the discrepancy between sentiment and economic conditions after March 2020 is a decline in the implicit weights assigned by consumers and small business owners to labor market indicators, particularly the unemployment rate. This suggests that future work should take a closer look at perceptions of the labor market since April 2020.
Why have consumers and small business owners become more persistently pessimistic?
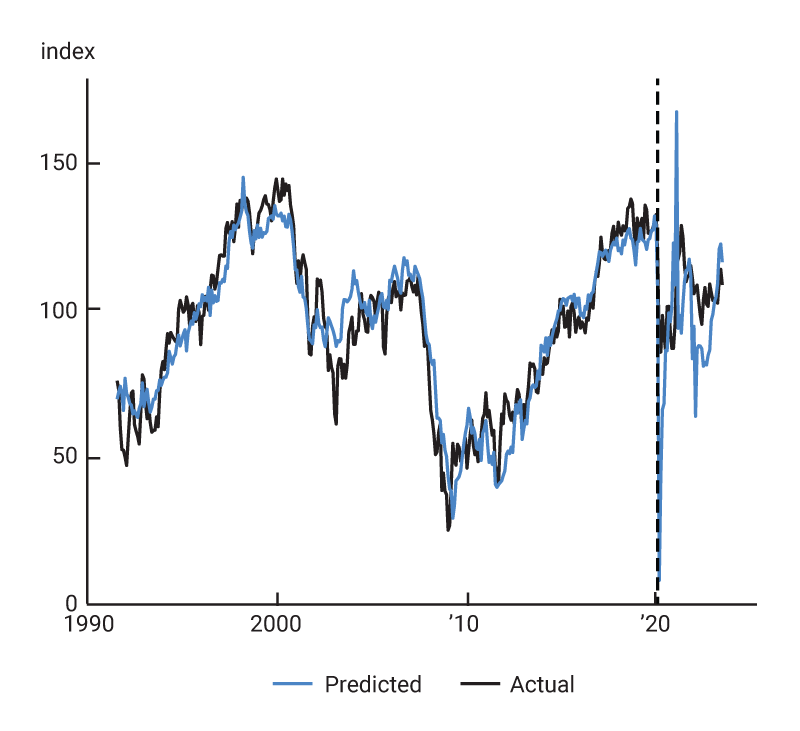
Other researchers have previously fit statistical models to U.S. consumer and small business sentiment indexes in order to document both their exceptional fit in pre-Covid times and the breakdown in that fit during the pandemic and its aftermath. We follow a similar strategy, but with a refined set of economic indicators (see figure A1 in the technical appendix) and a different estimation method. The fact that, like the other researchers, we also find large gaps between the models and reality after March 2020 (figure 1) only strengthens the case that this result is not likely to be due to a particular statistical procedure or set of economic indicators. In what follows, we describe our estimation method and results.
1. Bayesian linear regression model predictions for consumer and small business sentiment indexes
A. University of Michigan Index of Consumer Sentiment

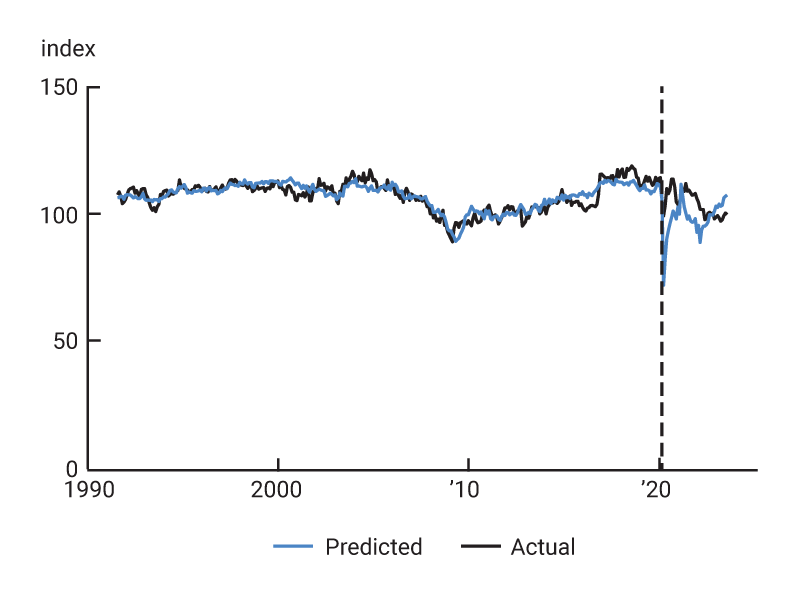
B. Conference Board Consumer Confidence Index
C. National Federation of Independent Business (NFIB) Small Business Optimism Index
Sources: Authors’ calculations based on data from the University of Michigan’s Surveys of Consumers, Conference Board, National Federation of Independent Business, and Haver Analytics.
To estimate our linear regression models,3 we use Bayesian methods that help to more clearly delineate which economic indicators correlate best with consumer and small business sentiment, as well as prevent the overfitting of these models to the period before April 2020.4 The Bayesian linear regressions achieve this result through the use of what are called regularized horseshoe priors.5 The horseshoe priors shrink imprecisely estimated coefficients toward zero to avoid giving undue weight to these statistical relationships. Regularized horseshoe priors require only a prior guess as to the number of such statistical relationships, which itself can be informed by data (an empirical Bayesian approach6).
These priors are an important feature of what we do for two reasons. First, the priors ensure that our regressions are not overfit from potentially including a larger number of economic indicators than is necessary to capture consumer and small business sentiment. Second, because we use our estimated models to construct out-of-sample predictions for consumer and small business sentiment after March 2020, the priors ensure that we are not placing too much weight on unrepresentative variations (or statistical noise) before April 2020 in the sentiment indexes and other economic indicators when doing so.
The fitted values from our regressions for the University of Michigan, Conference Board, and NFIB sentiment indexes estimated on data from August 1991 through March 2020 (our training sample) can be seen in figure 1 in comparison with their observed values. The underlying regression coefficients and their standard errors (see note 3) are shown in the technical appendix (see figures A2–A4). As figure 1 makes clear, all of the models fit quite well before April 2020, but none of them do as well recently. While one may have expected to see some divergence during the early stages of the Covid-19 pandemic, the persistence of this divergence through the present time is unprecedented.
Historically, a tight link existed between consumer and small business sentiment in the U.S. and economic conditions (as proxied by our set of economic indicators); however, that link appears to have been severed after the pandemic recession (our test sample), with significant and persistent gaps emerging between our models’ predictions and all three sentiment indexes. In each case, the regressions shown in figure 1 predict at the current moment more optimism on the part of consumers and small business owners than what is seen in the actual consumer and small business sentiment indexes. The University of Michigan index displays the widest gap between predicted and actual values, while the Conference Board and NFIB indexes display more moderate divergences.
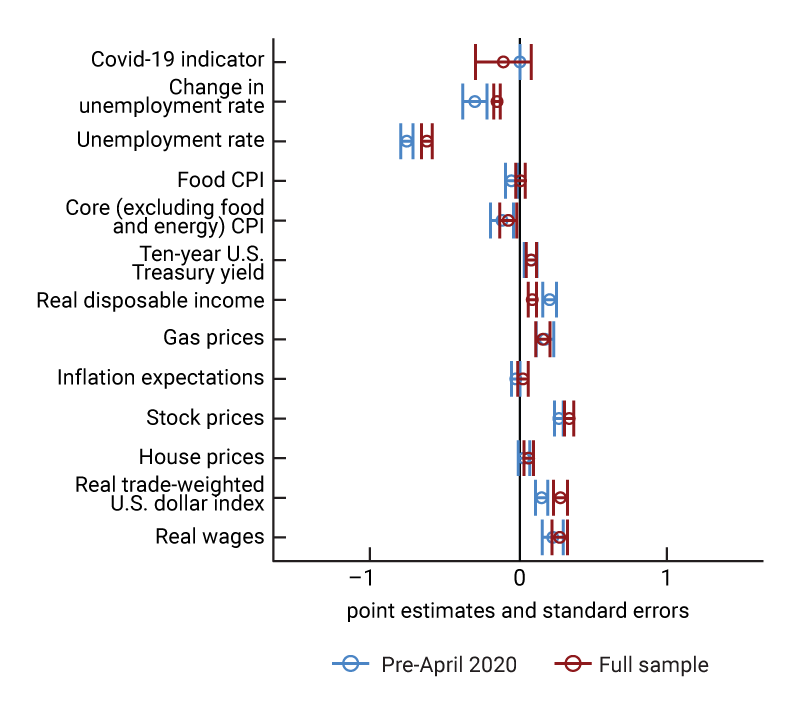
To understand what is driving these results, we compare in figure 2 our estimated regression coefficients from figure 1 (pre-April 2020) to what they are instead when fit to all available data through August 2023 (full sample). Doing so allows us to see if the implicit weights placed on economic indicators by survey respondents have shifted over time by incorporating the data after March 2020. Furthermore, we also allow for a level shift from April 2020 onward in our full sample regressions to capture the possibility that the average level of optimism conditional on prevailing economic conditions may have changed after the Covid recession in line with what other researchers have found. This pandemic effect is captured for each sentiment index in figure 2 by the Covid-19 indicator variable at the top of each panel; the regression coefficient is exactly zero for this variable by construction in the pre-April 2020 sample.7
2. Bayesian linear regression coefficients fit to pre-April 2020 and full samples
A. University of Michigan Index of Consumer Sentiment

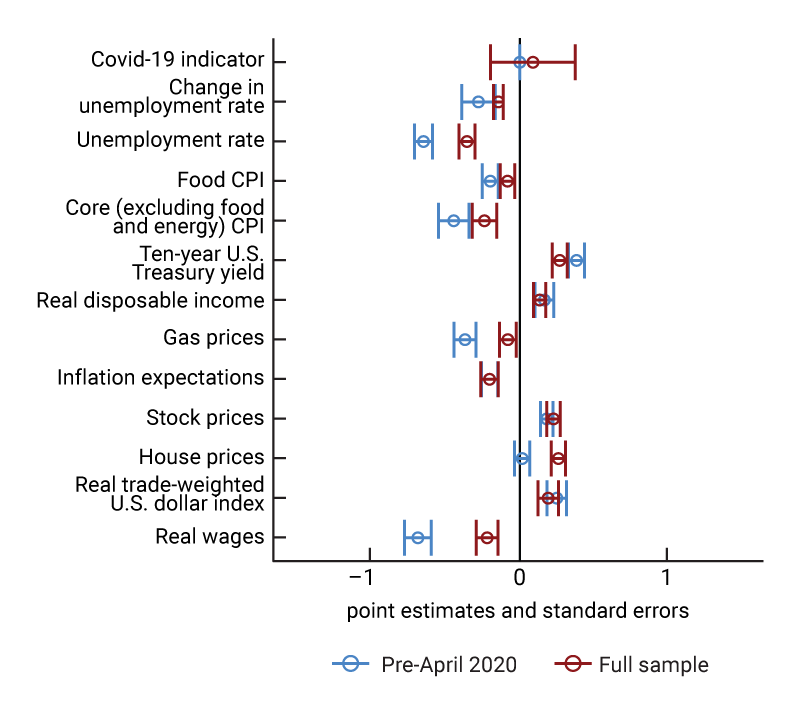
B. Conference Board Consumer Confidence Index
C. National Federation of Independent Business (NFIB) Small Business Optimism Index
Sources: Authors’ calculations based on data from the University of Michigan’s Surveys of Consumers, Conference Board, National Federation of Independent Business, and Haver Analytics.
Comparing the pre-April 2020 and full sample estimates for the University of Michigan index (figure 2, panel A), we find that the single biggest difference is in fact a decline in the average level of optimism conditional on prevailing economic conditions. In contrast, the Conference Board and NFIB indexes (panels B and C of figure 2, respectively) do not show a significant decline in their average levels in the post-March 2020 period after controlling for prevailing economic conditions. This result is crucial in explaining why the University of Michigan index is persistently below our model predictions in figure 1 after March 2020.
Once we account for this decline in the University of Michigan index, labor market indicators also seem to lose some of their importance in explaining consumer sentiment. This is true as well for the Conference Board and NFIB sentiment indexes.8 With the labor market being one of the primary sources of strength in the recovery from the pandemic recession, the failure of all three indexes to respond with the same vigor to labor market strength as one might have expected before April 2020 helps to explain their currently low values.9
Both the Conference Board and NFIB indexes contain survey questions that are directly related to labor market conditions, but the University of Michigan index takes an indirect approach instead by focusing broadly on business conditions and personal finances. This survey feature may explain why for the University of Michigan index the full sample regression fit is also improved by allowing for a lower regression intercept. However, once we account for this, we still see significant differences in the regression coefficients for both unemployment measures and real disposable income—a result that this index shares in common with the Conference Board index.
Interestingly, we do not see these coefficient differences appear in most other economic indicators, at least not to the same degree nor with the same level of statistical precision. This is not to say that they are not important in explaining the currently low values of consumer and small business sentiment indexes. For instance, it is clear that inflation indicators do indeed play a large role in this regard (see figure A5 of the technical appendix). But their statistical relationships with these indexes do not seem to have changed much, if at all, after the Covid recession and, thus, cannot explain the discrepancies that we see in figure 1.
What factors driving sentiment do the indexes share in common?
The divergences that we find between observed consumer and small business sentiment indexes and what’s predicted by past relationships with economic conditions are largely shared in common. In fact, when we take the first principal component of the residuals (or the linear combination that best explains the movements in all three) from the Bayesian regressions depicted in figure 1, it explains over 60% of their total historical variation. For this reason, we focus on that common part of our models’ prediction errors to understand what is driving the current gap between sentiment and economic conditions.
The first principal component—also referred to as a common factor—is plotted along with each of the three residual series it is constructed from in figure 3. The common factor’s lowest value before April 2020 was early in our sample in late 1991 following the 1990–91 recession. It was then nearly matched again during the Great Recession in 2008–09. More recently, there was a very large spike followed by a very large dip in it at the onset of the pandemic. However, it returned to normal quickly after that, and only in the past year or so has it again begun to approach its previous historical low. This timing suggests that what we are capturing in the common factor currently is likely more than just a pandemic effect.
3. The first principal component of our prediction errors
Sources: Authors’ calculations based on data from the University of Michigan’s Surveys of Consumers, Conference Board, National Federation of Independent Business, and Haver Analytics.
To test this further, we allow for both changing regression intercepts (level shifts) and changing regression coefficients (slope shifts) in our models that are estimated on the full sample period. As noted previously, the addition of the former to our linear regressions captures the possibility that the average level of optimism changed following the Covid recession after controlling for prevailing economic conditions. By adding the latter to our linear regressions, we can also now measure how much the implicit weights assigned to economic indicators by survey respondents may have changed as well.
As shown in figure 4, the common factor constructed allowing only for different regression intercepts (level shifts) still displays the recent divergence seen in figure 3 (repeated in figure 4). So, while there is something to the notion that consumers and small business owners are more pessimistic on average now than they were before April 2020 after controlling for prevailing economic conditions, the magnitude of the change is not that large when considered across all three consumer and small business sentiment indexes. In many respects, this result is just a restatement of what we see in figure 2.
4. Principal components allowing for differences in post-March 2020 regression coefficients
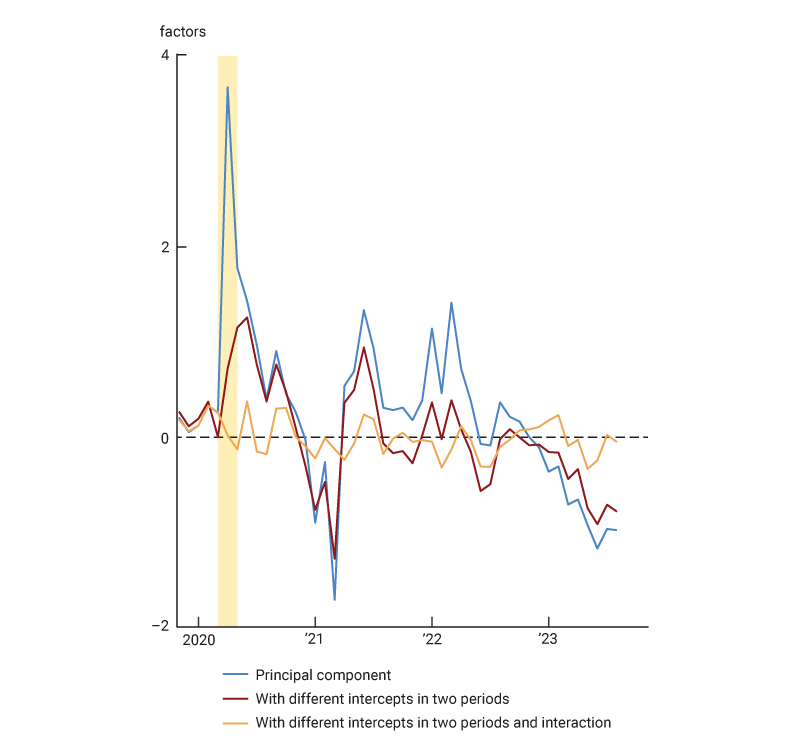
Sources: Authors’ calculations based on data from the University of Michigan’s Surveys of Consumers, Conference Board, National Federation of Independent Business, and Haver Analytics.
However, if we also allow the regression coefficients to differ in the pre-April 2020 period and the post-March 2020 period (i.e., slope shifts), the divergence goes away (also shown in figure 4). This suggests that the recent behavior of consumer and small business sentiment is consistent with both a small persistent change in the average level of optimism conditional on prevailing economic conditions and a larger change in the sensitivity to economic conditions. That said, only the latter can be stated with a reasonable level of statistical precision (see figures A2–A4 in the technical appendix).
This raises the question of which economic conditions both consumers and small business owners have become more or less sensitive to than they were before April 2020. We saw examples for each individual sentiment index earlier in figure 2. To investigate which variables show a change in sensitivity across the common component of all three indexes, we construct a single set of coefficients by taking a weighted average of the slope shift coefficients for each variable from the models where we allow for both level and slope shifts, with weights matching those of the related principal component in figure 4.10
The resulting coefficients are shown in figure 5. The three coefficients that have witnessed the most significant changes in the post-March 2020 period (i.e., large differences from zero in the figure) that we can estimate to a reasonable level of statistical precision (i.e., standard error ranges that do not include zero) are for our two unemployment-based measures of the labor market and real disposable income. The positive coefficients here for both the current change and lagged level of the unemployment rate and negative coefficient for real disposable income combined with the opposite sign coefficients on these variables before April 2020 (see figures A2–A4 in the technical appendix) imply that they have become noticeably less important (i.e., closer to zero regression coefficients) for predicting consumer and small business sentiment after the Covid recession.
5. Post-March 2020 changes in model coefficients (weighted average)
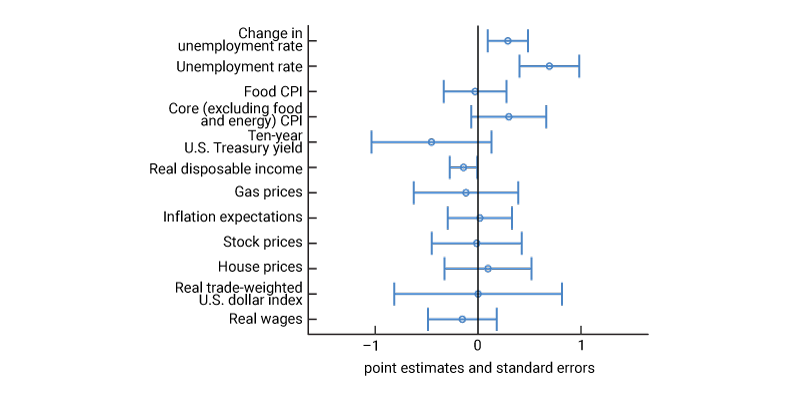
Sources: Authors’ calculations based on data from the University of Michigan’s Surveys of Consumers, Conference Board, National Federation of Independent Business, and Haver Analytics.
We infer from figure 5 that consumers and small business owners are simply not reacting to the tight labor markets of the past year or so as strongly as they would have in the past. Explaining why is beyond the scope of our statistical models. But our results suggest an avenue for future research to gain a better understanding of what is driving the persistent pessimism of consumers and small business owners.
Conclusion
In summary, we, like other researchers, find that notable gaps exist currently between consumer and small business sentiment indexes and what would be predicted by prevailing economic conditions based on pre-April 2020 statistical relationships. While part of these gaps appears to be driven by newly persistent pessimism after the Covid-19 recession in the U.S., consumer and small business sentiment are also clearly not reacting to strong labor market conditions in the same manner that they used to.
While the reasons for this change are unclear, our results suggest one possibility: Consumer and small business sentiment and labor market conditions may share a nonlinear relationship—in which at a sufficiently low level of the unemployment rate, people stop accounting for either the level of tightness in the labor market or changes in it (or possibly both). A good test of this might be to examine the 2019 period more closely, as it too was characterized by similarly low levels of the unemployment rate. It may be that consumers and small business owners today are viewing this period as the relevant benchmark for labor market developments following the Covid recession.11
There is, of course, another possibility that could also explain our findings: We could be omitting a variable from our regression models that is both correlated with consumer and small business sentiment and labor market conditions and that also changed tremendously after March 2020. One possibility that our models perhaps do not fully capture is the increase in the level of prices since 2019, for instance, because our sample period does not include the 1970s and 1980s, when Consumer Price Index (CPI) inflation last reached a level similar in magnitude to its peak after the Covid recession.12 Such an explanation is consistent with sentiment remaining low even as inflation has slowed, since prices remain much higher than before.
Time-series methods like ours applied to aggregate data may also be insufficient to fully capture what is happening with consumer and small business sentiment. Exploring geographic or demographic variation in sentiment and labor market conditions may prove to be more fruitful in determining if such a confounding variable does indeed exist or not.13 But in the absence of such evidence, the most we can say using the method described in this article is that something has clearly changed following the Covid recession in how consumers and small business owners respond to sentiment-related survey questions based on prevailing labor market conditions.
Notes
1 According to the National Bureau of Economic Research, the Covid-19 pandemic recession in the U.S. began in February 2020 and ended in April 2020.
2 See, e.g., Claudia Sahm, 2023, “Why are American consumers still so gloomy? Blame Covid,” Opinion, Bloomberg, September 15, available online, and Economist Newspaper Limited, 2023, “The pandemic has broken a closely followed survey of sentiment,” Economist, September 7, available online.
3 A linear regression assumes that a relationship of the form Y = Xb + e exists between two variables: 1) a dependent variable (Y) and 2) an independent variable (X). The regression coefficient (b) captures how Y may be expected to change given a change in X, with e capturing residual variation in Y unexplained by X. The standard error of b is then a measure of statistical uncertainty for how precisely this effect is measured.
4 Overfitting refers to when a model is optimized to explain a sample of data that may differ substantially from the underlying population. It tends to manifest itself through poor predictions of future data, or out-of-sample forecasts. Bayesian linear regression methods aim to minimize the likelihood of overfitting by penalizing imprecisely estimated statistical relationships between variables using prior (or external) information. For a general discussion of overfitting, see, e.g., Jake Lever, Martin Krzywinski, and Naomi Altman, 2016, “Model selection and overfitting,” Nature Methods, Vol. 13, No. 9, September, pp. 703–704, Crossref.
5 For more information on horseshoe priors, see the following articles: Carlos M. Carvalho, Nicholas G. Polson, and James G. Scott, 2010, “The horseshoe estimator for sparse signals,” Biometrika, Vol. 97, No. 2, June, pp. 465–480, Crossref, and Juho Piironen and Aki Vehtari, 2017, “Sparsity information and regularization in the horseshoe and other shrinkage priors,” Electronic Journal of Statistics, Vol. 11, No. 2, pp. 5018–5051, Crossref.
6 For more details on this procedure, see Aki Vehtari, Andrew Gelman, and Jonah Gabry, 2017, “Practical Bayesian model evaluation using leave-one-out cross-validation and WAIC,” Statistics and Computing, Vol. 27, No. 5, September, pp. 1413–1432, Crossref.
7 The pre-April 2020 coefficient is zero because we set the indicator variable itself to be zero prior to the end of the Covid recession in the U.S. as determined by the National Bureau of Economic Research.
8 In the technical appendix, we also report results from full sample regression models (figures A2–A4) that do not include the Covid-19 indicator variable. In those results, we also find a declining importance of labor market indicators after March 2020.
9 Figure A5 in the technical appendix demonstrates this further by breaking down our models’ predictions after March 2020 into contributions from labor market indicators (labor), inflation indicators (inflation), and financial indicators (asset prices). The models expect to see a big decline followed by a big boost in sentiment coming mostly from rising and then declining unemployment. The boost was then expected to grow over the past year as inflation-adjusted earnings rose. However, the sentiment data reveal something different, declining less than expected in 2020 and rebounding less since then. So, to reconcile the data with the models and improve their fit after March 2020, the full sample regressions primarily choose to downweight the labor market indicators.
10 Principal components are only identified up to scale and, thus, require a scale normalization. We scale our principal components so that they represent a weighted average of each of the three underlying series, with weights that are positive and sum to 1 in absolute value.
11 This comparison between 2019 and today may also be a contributing factor in and of itself. See, e.g., Betsey Stevenson, 2023, “Anger is what’s driving the US economy,” Opinion, Bloomberg, November 13, available online.
12 Another factor that is commonly cited as a potential explanation is political polarization and its impact on consumer and small business sentiment. However, this potential factor predates the pandemic. See, e.g., Olivier Armantier, John J. Conlon, and Wilbert van der Klaauw, 2017, “Political polarization in consumer expectations,” Liberty Street Economics, Federal Reserve Bank of New York, blog, December 15, available online. So, for this to be an explanation for the current situation and important enough to impact our results requires polarization to have become worse over time, particularly over the past year or so. There is some evidence that this may be the case, particularly for the University of Michigan Index of Consumer Sentiment—see, e.g., this figure on U.S. consumer sentiment by party affiliation published by Reuters.
13 See, e.g., the analysis of state-level variation in consumer sentiment found in Jesse Wheeler and Scott Brave, 2022, “Weak consumer sentiment is impacting regional retail sales,” Morning Consult, research note, July 13, available online by subscription. They find that differences in consumer sentiment levels across U.S. states can be partially explained by differences in inflation and labor market conditions. Their analysis, however, does not include the mid-2022 to late 2023 period that we analyze.


