

Between March 2022 and June 2023, the unemployment rate, the most commonly used gauge of labor market tightness, remained in a narrow range between 3.4% and 3.7%. Yet, over this period, nominal wage growth increased to unusually high levels and then moderated, though it remains at a historically high rate. The disparity between a relatively constant unemployment rate and large movements in nominal wage growth has led to a divide in public discourse, with some seeing low unemployment and strong wage growth as a sufficient sign of the strength of the labor market and others concerned that the consistently low unemployment rate suggests labor market strength has plateaued and might be susceptible to a rapid deterioration.1
In this article, we take a broader approach to examining labor market tightness during the pandemic recovery period (i.e., the period following the general reopening of the economy in late 2020). We focus on worker movements into and out of the labor force, job switching on the part of workers, and employers’ hiring behavior. We show that, although the unemployment rate has been uncharacteristically stable, this broader view of the labor market shows considerable movements in all three of these measures from early 2021 onward. All three measures suggest the labor market experienced a historic rise in tightness followed by a moderation in that tightness that began toward the end of 2022. Moreover, all three measures are more consistent with the behavior of nominal wage growth than the unemployment rate. Perhaps most importantly from a policy perspective, these broader measures, along with nominal wage growth, suggest that despite the steady moderation in labor market tightness, the labor market remained strong by historical standards going into the second half of 2023.
Unemployment and wages: A puzzling relationship
Starting in early 2022 and continuing through mid-2023, the unemployment rate remained low at a near-constant rate. Figure 1 shows that over the same period, employers raised wages substantially, driving nominal wage growth higher than it has been in decades. Measures of nominal wage growth peaked in early 2022 and came down somewhat in 2023.
1. Unemployment and nominal wage growth
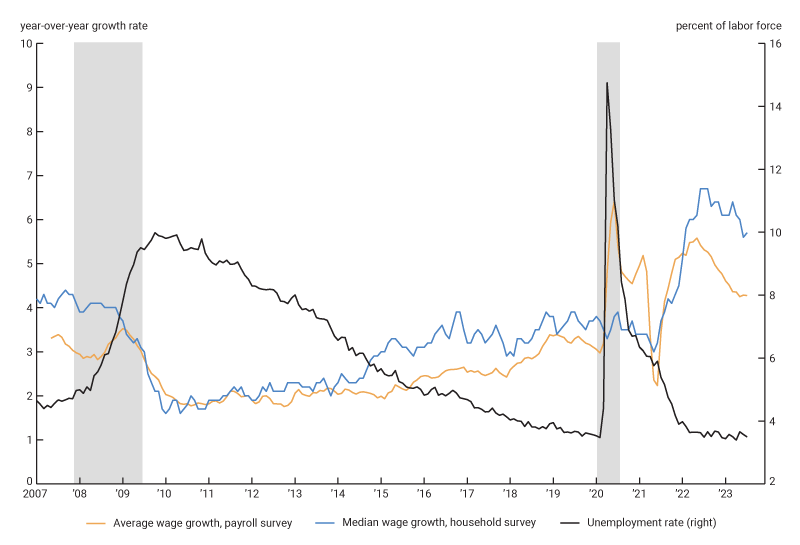
Source: U.S. Bureau of Labor Statistics.
The behavior of the unemployment rate and wage growth during this period is at odds with the relationship predicted by a standard (wage) Phillips curve, which is a key input into many macroeconomic analyses that guide monetary and fiscal policy. It postulates that unemployment and nominal wage growth (or similarly, inflation) should move in opposite directions over the business cycle. The fact that wage growth (and inflation) has increased substantially and then moderated, while the unemployment rate has remained stable is inconsistent with the prediction that a flat unemployment rate should be accompanied by flat wage growth or conversely that increasing wage growth should correspond to falling unemployment. This has generated considerable discussion within policy circles on the true state of the labor market and how vulnerable it may be to the recent rapid tightening of monetary policy by the Federal Reserve. For example, some policymakers interpret it as evidence supporting the idea that the Phillips curve relationship is relatively flat, meaning there is only a weak relationship between wage growth (or similarly, inflation) and unemployment.
The behavior of labor force participation and labor supply
To understand more about the labor market during the pandemic recovery period, we begin with an examination of the labor force participation rate (LFPR) and a broader measure of labor supply. Figure 2 shows that the LFPR plummeted during the pandemic recession and lockdown period of early 2020 to mid-2020 and remained below its pre-pandemic levels through mid-2023. This occurred despite very strong employment growth in the U.S. since 2021.2 A reduction in labor supply increases wage pressures, since employers find it harder to fill their open positions.
2. Potential work hours versus the labor force participation rate
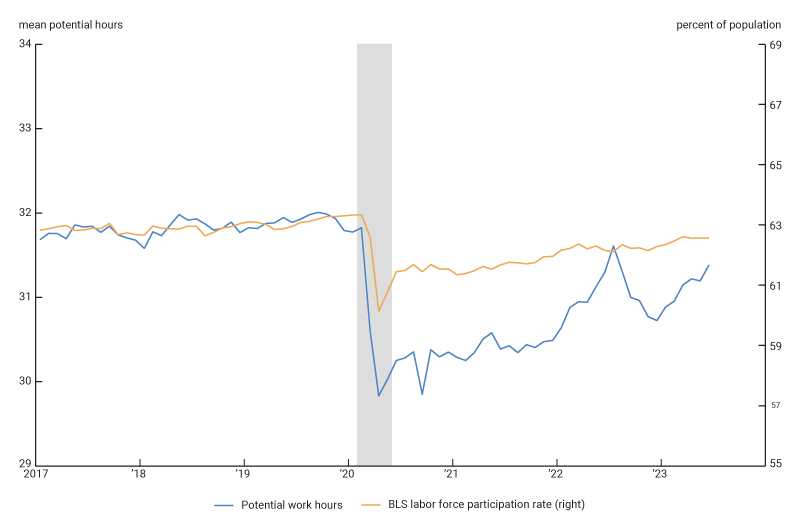
Sources: U.S. Bureau of Labor Statistics, Faberman, Mueller, and Şahin (2022), and authors’ calculations.
Recent research uses data from the Survey of Consumer Expectations (SCE) from the Federal Reserve Bank of New York to calculate a broad measure of labor supply.3 These studies use information on what individuals report as their desired and actual work hours to generate an aggregate measure of labor supply, referred to as potential work hours. The authors measure potential work hours as the average number of hours per week an individual desires to work. The SCE asks this of all individuals regardless of their labor force status. If a retired person would like to exit retirement and work ten hours per week, or if a part-time worker prefers an additional ten hours per week over their current level, the potential work hours measure would capture these preferences. The measure is analogous to the labor force participation rate, in that both are measures of labor supply. The difference is that the labor force participation rate measures labor supply based on the number of potential workers, while the potential work hours measure takes into account how much those individuals are willing to work. Figure 2 shows that potential work hours also dropped steeply during the recession and lockdown period, but much farther than the LFPR. Like the LFPR, this measure has yet to return to its pre-pandemic levels. Faberman et al. (2020) show that, historically, the LFPR and potential work hours tracked each other closely over time, so that larger swings in potential work hours during and immediately after the pandemic are an anomaly.
More recent work by Faberman, Mueller, and Şahin (2022) shows that a large part of the difference between the changes in the two measures can be explained by a sharp rise in those identified as out of the labor force (i.e., they are not actively looking for work) that truly do not want to work at all. Prior to the pandemic, about 41% of those out of the labor force preferred zero work hours. By 2021, the share rose to 50%. Extending their analysis with the most recent data from the SCE, we find that this share rose again, to 54%, in 2022. A large part of the decline in potential work hours is driven by individuals age 55 or older, who report not wanting work and are out of the labor force for reasons besides retirement. Consequently, the low rate of potential work hours during the pandemic in 2020 and in the early recovery period in 2021 reflects a sharper decline in labor supply than suggested by the LFPR. Since mid-2022, however, potential work hours have risen considerably and are slowly converging towards the LFPR as of mid-2023. This suggests that, more recently, labor supply may be rebounding more quickly than the LFPR implies, and therefore may be easing the upward wage pressures caused by relatively low labor supply.
Vacancies, job switching, and wage growth
Though the unemployment rate has remained steady during the pandemic recovery, other measures of the labor market generally have not. Moreover, the changes in these other measures have been more strongly correlated with the behavior of nominal wage growth. We show this in figure 3. The job vacancy rate peaked at nearly 3 percentage points above its 2019 average, and despite falling through much of 2022 and 2023, remained about 1.4 percentage points above its 2019 average in mid-2023. The high vacancy rate suggests employers’ labor demand has moderated but remains strong. The quit rate follows a similar trajectory. A higher quit rate implies a high degree of job switching on the part of workers, since most who quit are moving directly to another job. The quit rate peaked at 0.6 percentage points above its 2019 average in 2022, which was its highest recorded rate since at least 2001. It has fallen since then, but remained just above its 2019 average through mid-2023.
3. Changes in vacancies, quits, and wage growth since 2019
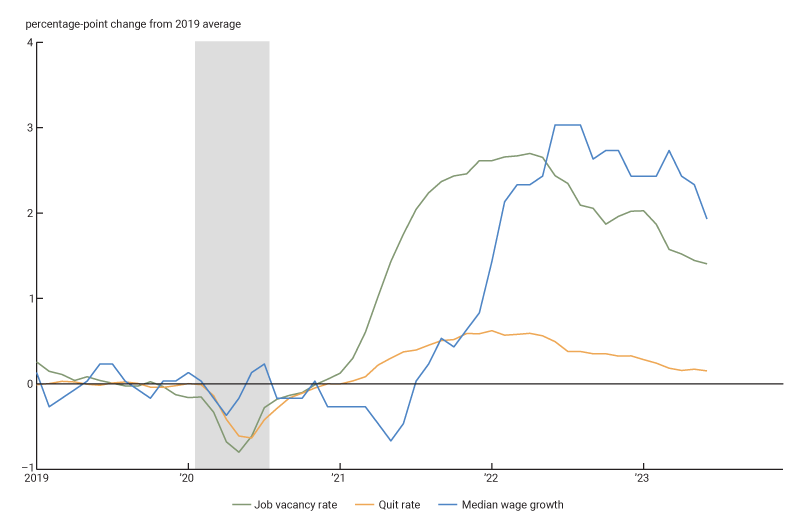
Sources: U.S. Bureau of Labor Statistics and authors’ calculations.
The similar movements in vacancy and quit rates are not coincidental. Higher vacancy rates generally reflect an increase in labor demand. Workers are more likely to switch jobs when new job opportunities are more plentiful. The record rise in the vacancy rate reflected a historic rise in job opportunities for many workers, inducing many workers who quit their old jobs to take these new opportunities. A high quit rate can also generate upward wage pressures, since potential job switchers must usually be enticed away from their current employers with better pay. Research by Faberman and Justiniano (2015) suggests a tight relationship between the quit rate and nominal wage growth and, to a lesser extent, inflation.4
When the quit rate rises, for whatever reason, it can affect the unemployment rate, though countervailing forces make its net effect on the unemployment rate ambiguous. A higher quit rate lowers the job-finding rate of the unemployed (and thus increases the unemployment rate) by increasing the number of job seekers in the labor market competing with the unemployed. A higher quit rate also opens up additional vacancies for the positions that the job switchers leave and the increase in job seekers makes it easier for employers to fill their vacancies, increasing their incentive to create new positions. This increases the job-finding rate of the unemployed (and thus decreases the unemployment rate). As a result, a higher quit rate may have little net effect on the unemployment rate.5 Consequently, the historic rise in vacancy and quit rates may be a major reason we see sharp movements in nominal wage growth with little change in the unemployment rate.
Changes in employers’ hiring behavior
Finally, we examine whether hiring behavior following the pandemic is consistent with the high nominal wage growth we observe during the period. One way employers may choose to deal with a high rate of unfilled vacancies is to raise the wage they offer to attract more workers. Another way is to adjust their hiring standards. For example, Modestino et al. (2020) show that recessions (periods when vacancy rates are low) are associated with “upskilling,” or a tightening of hiring standards. They use Lightcast (formerly BurningGlass) data on online job postings to show that, on average, employers increased their education and experience requirements during the Great Recession. This implied that employers were able to hire more qualified workers at the same wage. This a form of downward wage pressure, in the sense that the more-qualified hire likely could have earned a higher wage (or a less-qualified hire likely could have earned the offered wage) had the economy not been in recession. Aggregate measures of nominal wage growth will miss this form of wage pressure, since it operates by adjusting the quality of the worker hired rather than the wage paid to workers of similar quality.
We can see if hiring standards behaved analogously in the pandemic recovery period—i.e., whether the sharp rise in the vacancy rate led employers to lower their hiring standards. We extend the analysis by Modestino et al. (2020) in several ways. We use the same Lightcast data to analyze how changes in hiring standards, measured using the education requirements of posted job vacancies, are related to the recent changes in labor market tightness. We focus on the 2012:Q1 to 2023:Q2 period and extend their analysis to examine the relationship of education requirements to state-level changes in the unemployment rate and the quit rate over time. We focus on the fraction of vacancies within a detailed occupation-state-quarter grouping that requires more than a high school degree and estimate its relationship to the unemployment and quit rates within a regression analysis that includes a variety of controls.6 We also allow the relationship to differ between the pre-pandemic period and afterward.
Figure 4 reports the coefficient estimates for the relationships of the state-level unemployment rate and quit rate in the pre-pandemic period and afterward (defined in the regression as 2020:Q2 to 2023:Q2). The figure shows that education requirements fall when the state quit rate is high. Hiring standards are slightly higher when the unemployment rate falls, but the relation is not statistically different from zero. Thus, employers generally lower their hiring standards when the quit rate is high. The figure also shows that hiring standards were even more responsive to the quit rate during the pandemic and in the subsequent recovery period. That is, for a given increase in the quit rate, hiring standards fell more during the pandemic and the subsequent recovery than they did prior to it. Notably, we find that education requirements were essentially unrelated to the unemployment rate during this period.
4. Response of job posting education requirements to changes in labor market tightness
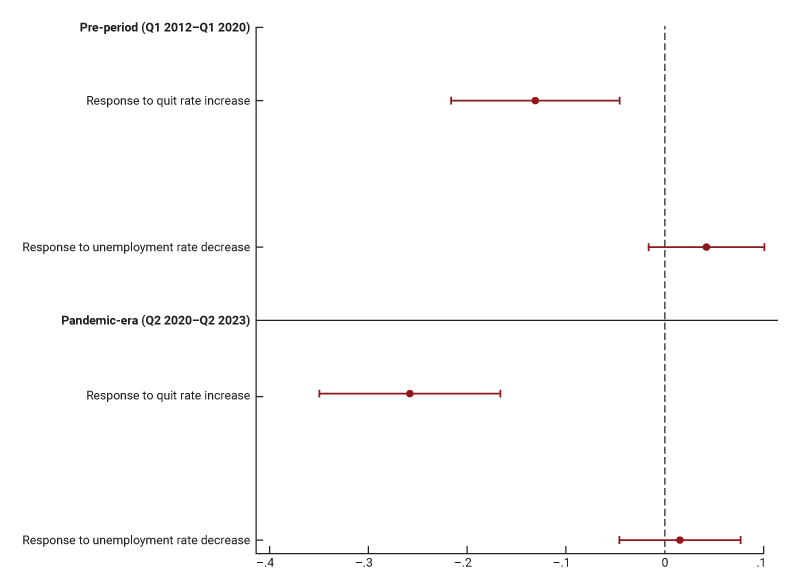
Sources: Lightcast job vacancy data and authors’ calculations.
There are three things to conclude from these results. First, relative to the pre-Covid period, the decline in hiring standards was larger for a given increase in the quit rate. This suggests the historic rise in the quit rate reflected a sharp increase in labor demand that could have led to an even larger than expected increase in wage pressures, since employers were willing to hire workers who were less qualified than usual in response to the tight labor market during the pandemic recovery period. Second, our results suggest that the unemployment rate, even if it had changed during the pandemic recovery period, would not have led to similar wage pressures. Finally, while we do not have explicit estimates on how the relationship between quits and hiring standards may have changed during 2023, we do know that the quit rate has moderated since early 2022, suggesting that at least some of these wage pressures have abated.
Conclusion
In this article, we examine a broad range of measures of labor market tightness in the pandemic recovery period. The constancy of the unemployment rate sheds little light on movements in wage growth over the period. In contrast, measures of labor supply have risen from very low levels during the pandemic, vacancy and quit rates have hit record levels, and hiring standards have fallen further than one would have expected during the recovery. These movements have occurred alongside a sharp rise in wage growth over the same period. Wage growth moderated in early 2022, and we observe moderation in quit rates and vacancy rates, along with a stronger recovery in labor supply, over the same period.
Put together, these results suggest that the standard Phillips curve relationship between unemployment and wage growth misses key aspects of labor market tightness that have contributed to wage pressures. Instead, we show that a broader analysis of the labor market suggests that wages grew rapidly because the labor market was considerably tighter than what the unemployment rate alone suggested. Wage growth has moderated since early 2022, consistent with moderation in the tightness implied by our broader measures, but nominal wage growth and these broader measures remained elevated compared to their pre-pandemic levels through mid-2023.
Notes
1 For example, see the recent studies by Figura and Waller (2022) and Blanchard, Domash, and Summers (2022). Both use the relationship between job vacancies and unemployment, i.e., the Beveridge curve, to make their arguments. Figura and Waller argue that the low unemployment rate makes the conditions for a “soft landing” of the economy from its current strong growth plausible, while Blanchard, Domash, and Summers argue that the current pace of inflation, coupled with low unemployment suggests a sharp contraction is necessary to get growth under control.
2 While the LFPR remained below its 2019 levels through mid-2023, Hobijn and Şahin (2023) show that it was above multiple estimates of its pre-pandemic trend. This suggests that labor supply may actually be relatively high at the end of our sample period, despite remaining below its pre-pandemic rate.
3 These studies are Faberman, Mueller, Şahin, and Topa (2020) and Faberman, Mueller, and Şahin (2022). In both studies, the authors derive a measure of labor market underutilization called the aggregate hours gap (AHG), which measures the difference between total potential work hours—measured based on individuals’ desired work hours, regardless of whether they are employed, unemployed, or out of the labor force—and their actual work hours. The measure combines the survey responses on work hours from the SCE with additional labor market information from the Current Population Survey (i.e., the survey used to estimate the official unemployment rate statistics). The authors show that their measure captures significant changes in labor market underutilization beyond changes in the unemployment rate. The potential work hours measure we report here is the denominator in their AHG measure, making it analogous to the official definition of the labor force (i.e., the sum of all employed and unemployed), which is the denominator of the unemployment rate.
4 Recent studies by Faccini and Melosi (2023) and Moscarini and Postel-Vinay (2022) present theoretical models of job switching that illustrate the links between quits, wage growth, and inflation.
5 Barlevy, Faberman, Hobijn, and Şahin (2023) provide a more detailed illustration of the link between quits, vacancies, unemployment, and inflation within a Beveridge curve framework.
6 Specifically, we group vacancies by state and three-digit occupation and group them by the quarter in which they are posted. We calculate the fraction of vacancies within each group that reports requiring more than a high school degree. We then regress this variable on the state unemployment rate (from the Bureau of Labor Statistics, Local Area Unemployment Statistics), the state quit rate (from the JOLTS), interactions of these variables with a pandemic-period dummy (equal to one from 2020:Q2 forward), and controls for the fraction of vacancies requiring more than a high school degree in 2012, the state median age, the state population share (age 25+) with a college degree, and occupation × quarter fixed effects. We estimate the regression over the 2012:Q1 to 2023:Q2 period.


