

Introduction and summary
Beginning in 1942, the Federal Reserve helped the U.S. Treasury to finance war debt by pegging interest rates on short-term Treasury bills (T-bills) at a fixed interest rate and capping rates on longer-term Treasury securities. This episode provides an interesting antecedent that modern central bankers might review in trying to understand the potential costs and benefits of yield curve caps or targets. Indeed, the Fed’s policymaking body, the Federal Open Market Committee (FOMC), recently noted that its committee members had reviewed this episode, along with other more recent episodes of yield curve targeting in Japan and Australia.1 In this article, I review both the onset and the end of yield curve control.
Regarding the onset, I highlight a few basic takeaways for the modern central banker. First, yield curve control can cause a central bank to lose control of the size and maturity distribution of its government securities holdings. As long as investors were unwilling to hold Treasury bills at 3/8 percent, the Fed had no choice but to acquire whatever quantity of bills the Treasury issued. Indeed, the Fed’s yield curve targeting in this era eventually led it to acquire large amounts of Treasury bills, which had low investor demand given a steeply upward sloping yield curve.
Second, I offer a new explanation of why the Fed’s acquisition of T-bills did not immediately follow the advent of its yield curve targeting. Although scholars have appealed to incomplete communications or lack of credibility, these explanations seem incomplete, as contemporary discussions show that sophisticated investors understood Fed policy within a couple of months and believed it to be credible. Instead, I suggest another factor that temporarily generated an increase in demand for Treasury bills during 1942: a special standing facility for buying and selling Treasury bills that created a de facto interest on excess reserves system.
Third, the episode was rife with significant tension between the Fed and Treasury, serving as a useful reminder of the disagreements that can accompany such far-reaching actions by a central bank. The T-bill facility itself was a compromise struck to manage a conflict over how to manage the short end of the yield curve while keeping long-term interest rates low. Overall, these tensions persisted, in one form or another, until the Treasury–Federal Reserve Accord in 1951.
The unwinding of the yield curve control regime with the 1951 accord offers its own lessons. One such lesson is that the end of yield curve control will cause capital losses for investors holding longer-term securities if long-term yields rise. Here I focus on the mortgage market in particular and note that some downward pressure on the supply of mortgage credit appears to have resulted in response to these capital losses to lenders. A second lesson is that yield curve control can lead financial firms to create business models that are predicated on complete stability in government security prices. In this case, the accord transformed the fixed spread between mortgage rates in government programs and Treasury rates into a floating spread. In other words, yield curve control can change not only the expected level of interest rates but also their expected volatility. In this episode, the business models of financial institutions, once disrupted, took some time to be reformulated, resulting in temporary tightness in credit availability.
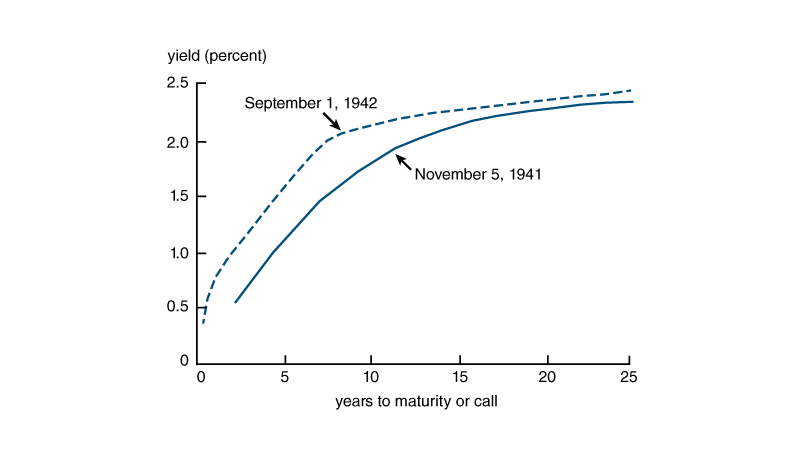
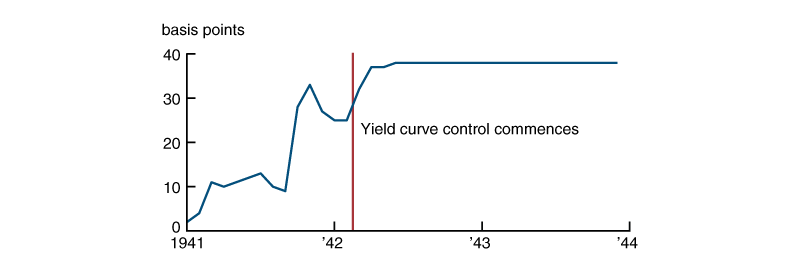
Figure 1. The World War II-era pattern of interest rates
The rest of this article proceeds as follows. In the next section, I review the onset of yield curve control in 1942 and seek to explain the pattern of Treasury holdings by the Federal Reserve. In the following section, I describe conditions in the mortgage market following the end of yield curve control with the accord in 1951. I conclude with a brief summary of the lessons learned.
The onset of yield curve control
Upon the entry of the United States into World War II, the U.S. Treasury faced the task of financing an enormous debt expansion. The Federal Reserve assisted the Treasury in this effort by implementing a form of yield curve targeting, capping interest rates at several points along the yield curve: from 3/8 percent on T-bills to 2½ percent on long-term bonds. This pattern can be seen in figure 1. Rates were set to be slightly higher than those that prevailed in November 1941, just prior to the attack on Pearl Harbor.
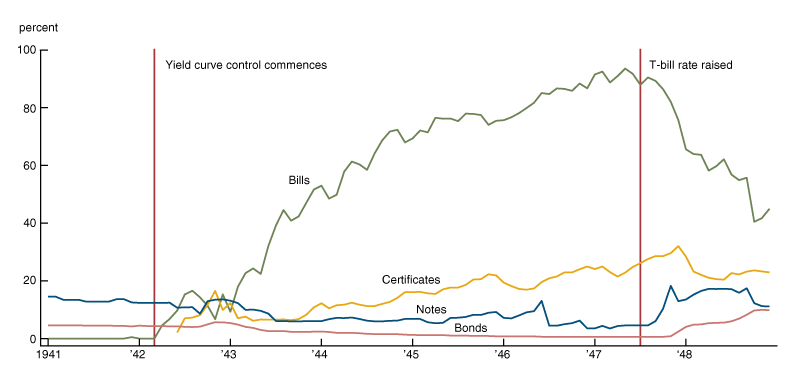
To implement this policy, the Fed purchased Treasury securities as necessary to prevent interest rates from rising above the caps. In particular, the Fed acquired very large amounts of Treasury bills from 1943 to 1947, as can be seen in figure 2. Figure 3 shows that the Fed did not acquire nearly as large a share of other Treasury securities, at least until 1947 when the T-bill rate was raised. From 1943 to 1947, private investors evidently preferred longer-term Treasury securities that carried higher interest rates, still featured very high liquidity, and had no real risk of capital losses given the Fed’s rate caps. The Fed’s purchases were carried out in the secondary market, in many cases by banks buying bonds from the Treasury and immediately reselling without profit to the Fed (Murphy, 1950, pp. 212–213).
This general story is well known and has been reviewed by scholars such as Friedman and Schwartz (1963), Meltzer (2002), Chandler (1949), and Garbade (2020). What these accounts devote less attention to is a puzzle revealed by a close look at figures 2 and 3. The Fed did not commence significant purchases of T-bills until 1943, though its yield curve control had been in place since March 1942, and market yields on T-bills were constant at 3/8 percent since that date. Why were private investors willing to take on billions of dollars in T-bills until mid-1943, and what changed?
Figure 2. Holdings of Treasury bills
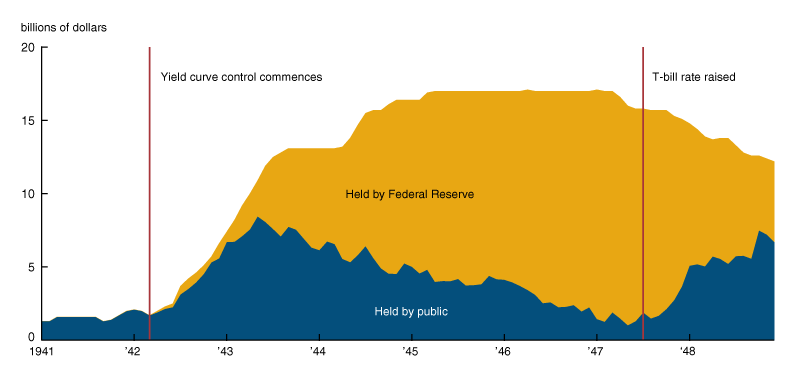
Figure 3. Percentage of Treasury instruments owned by the Federal Reserve
Below, I review the potential explanations for this delay. Scholars have pointed to the lack of communication by the Fed and the poor credibility of its interest rate caps. I find mixed evidence for these mechanisms. I suggest that another mechanism contributed to the delay, in which commercial banks converted excess reserves into T-bills during late 1942 and early 1943. This mechanism focuses on the Fed’s establishment of a standing facility to buy and sell T-bills at a specified rate, essentially converting T-bills into an interest on excess reserves system and increasing the demand for T-bills.
Communication and credibility
Communication of the World War II-era yield curve control was poor by modern central banking standards. Neither the Fed nor the Treasury announced the yield curve control policy upon implementation in March 1942 or any time soon thereafter, with the one exception of the 3/8 percent target on Treasury bills announced in April 1942. Walker (1954) argues that private investors were unaware of the Fed’s yield curve control at the longer end of the yield curve, stating that this was “perhaps the case in the United States during most of 1942.” Likewise, Wicker (1969) states that “commercial bankers did not become aware immediately of the policy of maintaining a fixed pattern of rates. The learning process was inevitably a slow and gradual one depending as it did upon close observation of the behavior of the Treasury and the Federal Reserve.” These views are largely just assertions, though, as neither scholar provides any direct evidence on private sector beliefs.
To assess the beliefs of contemporaries, I reviewed every issue from March to December 1942 of the Commercial and Financial Chronicle (CFC), a leading financial weekly newspaper that featured a weekly column dedicated to the Treasury market. This review shows that as early as the end of May 1942, writers at the CFC had full comprehension of Fed policy and its implications. The first clear statement of this comprehension came on May 21, 1942, when the CFC not only described the yield curve control policy but also immediately jumped to the implications for the maturity distribution of private portfolios:
The price level of the United States Government securities is going to remain just about where it is today if the Federal Reserve and Treasury can manage it. … They can. … What ought to be troubling an investor these days is not the trend of interest rates … but the best distribution of maturities. (Commercial and Financial Chronicle, 1942b)
In the following weeks, the CFC pounded away at the same theme. History by quote is always a perilous endeavor, but the bottom line here is that it is easy to find positive evidence that at least some contemporaries, perhaps the relatively sophisticated ones who specialized in the Treasury market and read the CFC, were aware of the Fed’s policies well before mid-1943.
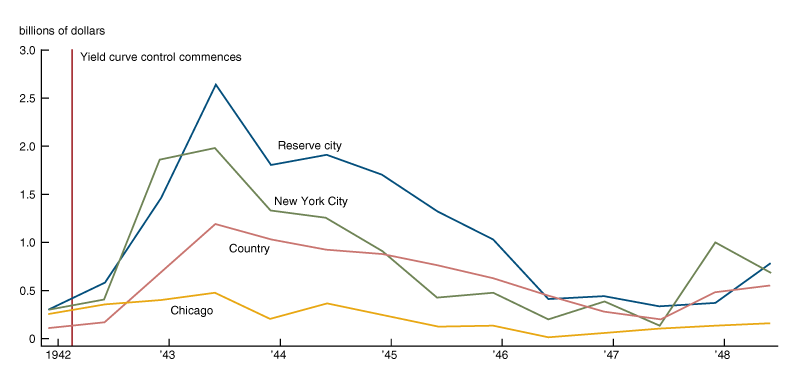
Moreover, investor sophistication does not appear to be empirically related to the pattern of T-bill purchases in late 1942 and early 1943. Figure 4 shows that member banks in New York, Chicago, and other reserve cities2—the sophisticated money market banks—purchased large amounts of T-bills up to mid-1943 and accounted for 81 percent of member banks’ T-bill holdings in June of that year. So-called country banks owned the remaining 19 percent. In comparison, country banks accounted for 29 percent of member banks’ assets. I focus on banks because they accounted for 80 percent of publicly held Treasury bills in this period. Overall, therefore, the private sector acquisition of T-bills was not driven by the smaller and less sophisticated banks that might have been less aware of yield curve control.
Figure 4. Holdings of Treasury bills by type of member bank
Scholars have also suggested that investors delayed their shift out of T-bills because the longer-maturity yield curve caps were not considered credible. It is difficult to rule out this channel, but the evidence is still a bit mixed. Walker (1954) describes investors as hoping long-term rates would rise, which could cause investors to avoid those instruments. Indeed, some contemporary accounts note that investors recalled the experience of Treasury markets after World War I, in which a postwar rise in interest rates left investors with losses on long-term bonds (Commercial and Financial Chronicle, 1942a, b; Eichengreen and Garber, 1991). In addition, there may have been genuine policy uncertainty even within the government, as the Fed and Treasury debated the achievable level of long-term yields during 1942, though they very much desired to keep long-term rates at 2½ percent. Those Fed–Treasury discussions were private at the time, but private investors were perhaps able to perceive this uncertainty in some way. Therefore, these sources of uncertainty could have caused investors to avoid long-term bonds. That said, investors were also concerned that short-term T-bill rates would rise, as noted by Chaurushiya and Kuttner (2003). The Fed in particular pushed for a rise in T-bill rates as they viewed the sharp upward slope of the yield curve to be a mistake. Therefore, it is not clear that policy uncertainty would drive investors to T-bills in particular during this period.
Special status of T-bills
T-bills had a special status in the government securities market because the Federal Reserve established a standing facility to buy and sell T-bills from member banks on demand and at a fixed price of 3/8 percent. The facility was announced in two stages: In April 1942, the Fed announced it would buy bills at 3/8 percent, and then in August 1942 it announced it would sell bills back to banks at the same rate. No such facility existed for any other Treasury instrument. The Fed’s yield curve control, therefore, was a peg for the T-bill rate but a cap for the other rates. The purpose of the special facilities for T-bills appears to have been to ease reserve management for banks during the war.
Figure 5. Member banks’ reserves, 1939–48
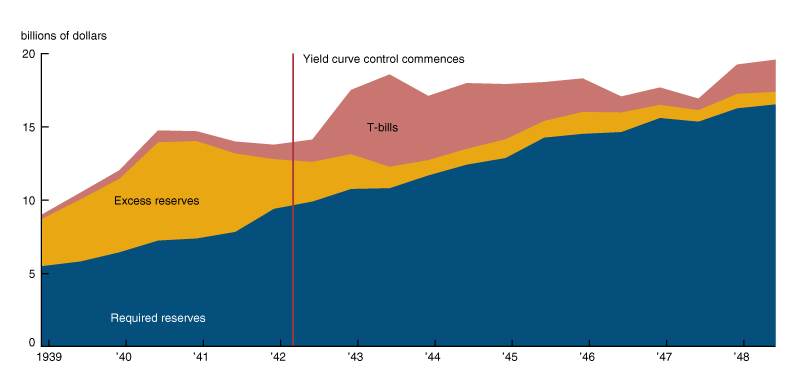
As a result of this facility, banks had little incentive to hold excess reserves. Any excess reserves could instead be invested in T-bills, which could be converted into reserves on demand via the standing T-bill facility. Effectively, T-bills were excess reserves in all but the legal sense. The bill facility therefore functioned in a similar way to the Fed’s modern Interest on Excess Reserves (IOER) powers.
Figure 5 shows the stock of reserves, excess reserves, and T-bills held by member banks over time. From December 1941 to June 1943, banks shed $1.9 billion in excess reserves, while gaining $4.8 billion in T-bills. Therefore, about 40 percent of the rise in T-bills during this period can be thought of as a reinvestment of excess reserves.
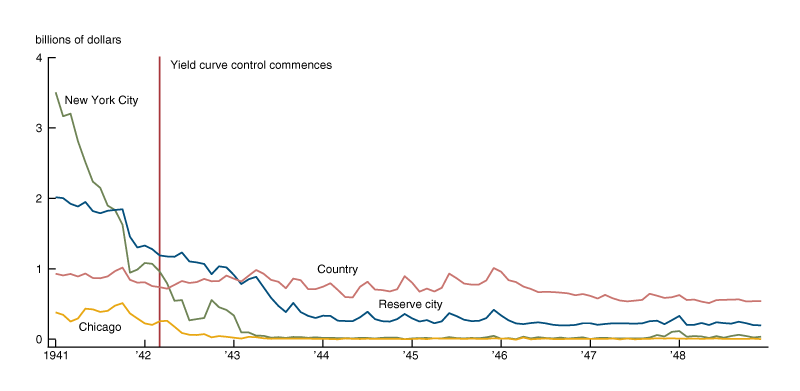
What changed in mid-1943? The answer to this question is a bit more difficult. One factor is that excess reserves at this point had been cut to the bone by some banks, particularly the large and sophisticated New York City money market banks as shown in figure 6. These banks therefore ceased converting excess reserves into T-bills at that point. This effect was clear to the Federal Reserve at the time. The August 1942 issue of the Federal Reserve Bulletin (Board of Governors of the Federal Reserve System, 1939–51) noted that in recent months the reserve city banks outside of New York and Chicago had been the most important source of demand for T-bills, as the banks in those two cities had largely finished converting excess reserves into T-bills. Both Fed and Treasury officials also constantly noted the stubbornly high level of excess reserves at country banks and called on those banks to do more to finance the war effort by converting their reserves into Treasury securities of some variety.
Low levels of excess reserves can explain why bank T-bill holdings stopped growing in mid-1943, but it is harder to explain why non-Fed T-bill holdings actually shrank. In part, the answer may be that banks’ deposits grew rapidly during the war, gradually increasing the level of required reserves, and banks saw the T-bill facility as making T-bills the most convenient avenue to gain those required reserves. Indeed, much of the run-off of T-bills apparently occurred operationally as a conversion of T-bills into required reserves using the Fed’s T-bill facility. Discussions from this period emphasize that T-bill holdings acted as a buffer for banks to adjust reserves as needed, which were volatile on a short-term per-bank basis, as reserve requirements swung wildly given the impact of war financing operations on bank balance sheets. For example, in July 1943 the Federal Reserve Bulletin noted that “Many member banks hold Treasury bills in order to be in a better position to meet possible reserve needs at times of withdrawal of war loan accounts” (Board of Governors of the Federal Reserve System, 1939–51).
Figure 6. Evolution of excess reserves
Evidence from bank-level data
To provide some further perspective on the acquisition of Treasury bills by commercial banks after the advent of the peg, I have digitized bank-level balance sheet information for all commercial banks in New York that were members of the Federal Reserve System, totaling about 570. These balance sheets are publicly available from the Federal Reserve Bank of St. Louis’s FRASER archive. I chose the state of New York as it contained the nation’s biggest banks in New York City, and also since it was the country’s most populous state and had large numbers of banks outside of New York City.
Figure 7. New York City banks’ 1942 conversion of excess reserves into Treasury bills
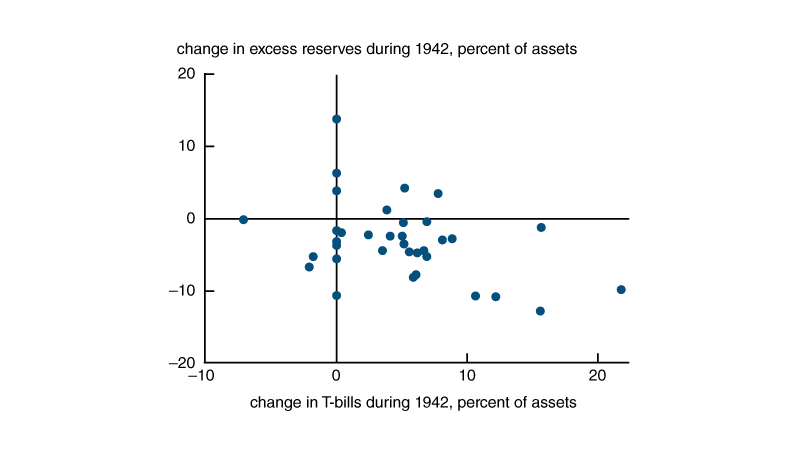
Figure 7 shows the pattern in which central reserve banks in New York City substituted Treasury bills for excess reserves between year-end 1941 and year-end 1942. Chase National Bank provides a telling example. Chase was the largest bank in the country, and it grew from $3.8 billion in assets at the end of 1941 to $4.5 billion at the end of 1942. During this period, it increased its Treasury bill holdings by $400 million, accounting for a large portion of its new asset holdings, and reduced its excess reserves by about $100 million. I view it as unlikely that Chase acquired such enormous amounts of T-bills out of ignorance of the implications of the Fed’s yield curve control.
Other banks in New York were much slower and less likely to acquire Treasury bills. At the end of 1942, only 17 percent of banks in New York held any Treasury bills at all. Moreover, figure 8 shows that the largest banks were the ones that acquired Treasury bills. In this figure, the top decile includes almost all of the New York City banks and shows that 65 percent of banks in the top decile by asset size acquired Treasury bills while banks in the bottom deciles were much less likely to acquire such instruments.
Figure 8. Share of Treasury bills and certificates by bank size
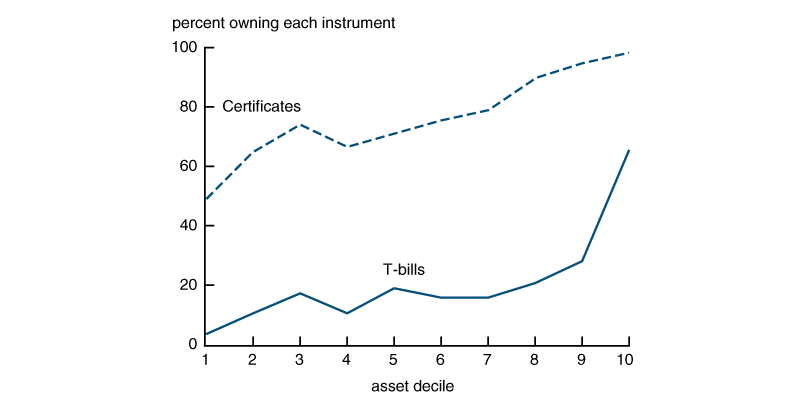
Figure 8 also shows that certificates were much more popular across the spectrum of banks. Certificates were instruments with maturities of 9–12 months and were newly issued in 1942 for the first time since 1934. Pegged at 7/8 percent, the additional yield was evidently a very attractive trade-off for the longer durations.
Figure 9. Evolution of yields on T-bills
Source: Board of Governors of the Federal Reserve System (1976, p. 693).
T-bills and tensions between the Fed and the Treasury
The interaction of T-bills, excess reserves, and yield curve control was an area of great tension between the Fed and the Treasury.
The long end of the curve was of paramount importance to both institutions, given its centrality to the ultimate cost of war finance. But the two institutions differed greatly on what they believed was necessary on the short end to support a 2½ percent long-term rate. The initial agreement from March 1942 held that rates would be “maintained on about the present curve of rates,” but allowed for some flexibility on the short end in recognition of uncertainty and disagreement. This initial agreement called for the Fed to begin supporting the market once the T-bill rate reached 1/4 percent and increasing its support as the rate reached 3/8 percent. Afterwards, T-bill rates averaged a little over 30 basis points in April, before the establishment of the T-bill facility on April 30 at 3/8 percent, after which rates rose to that level and stayed there (figure 9).
The Treasury was dissatisfied with this flexibility on the short end, preferring a more concrete commitment to low short-term rates, preferably at 1/4 percent. To accomplish this, it judged that the Fed must supply a large amount of excess reserves to keep downward pressure on short-term rates. Without a large amount of excess reserves, the Treasury doubted that Fed purchases of securities alone could maintain the desired pattern of rates (Wicker, 1969). The Treasury’s position was based in part on its empirical experience during the 1930s, in which excess reserves had generally kept short-term rates low, except in 1937 when that year’s infamous increase in reserve requirements caused upward pressure on short- and ultimately long-term Treasury rates as well. No economic model necessarily lay behind this view; contemporaries just describe it as a historical empirical relationship that informed Treasury beliefs (Murphy, 1950, pp. 96–99 and 122–125).
In contrast to the Treasury, the Fed viewed long-term interest rates as the product of forward-looking expectations (Murphy, 1950, p. 103). The Fed therefore viewed a less-steep yield curve as more internally consistent given expectations that it would persist. It also had more confidence in its ability to control rates via open market purchases. The Fed therefore viewed that short-run rates should be higher, around 3/4 to 1 percent, and somewhat flexible, with the Fed only intervening if upward pressure on long-run rates emerged.
The T-bill facility was the resolution to these arguments between the Treasury and the Fed from early 1942. The Fed won a somewhat higher T-bill rate, at 3/8 percent rather than 1/4 percent as the Treasury preferred, but still lower and less flexible than the Fed preferred, leaving the yield curve with a significant upward slope. In turn, the Treasury won a hard cap on short-term rates to be enforced with certainty by the Fed. That this resolution may seem lopsided in favor of the Treasury is a reflection of the power dynamics at play; this is a period of history in which Meltzer (2002) describes the Fed as “under Treasury control.”
The debate over excess reserves continued for some time after the establishment of the T-bill facility. Upon each major financing operation in the spring and summer of 1942, the Treasury would call for excess reserves to be raised, preferably through a reduction in reserve requirements. The Treasury was worried that if banks did not have excess reserves as large as any given Treasury debt sale, then the debt sale would fail. This operational concern was soon made moot by legal changes that allowed banks to participate in war debt sales without their reserve positions being affected. By mid-to-late 1943, the success of the T-bill facility eventually helped convince the Treasury that short-term rates could be pinned down without large amounts of excess reserves, which the Fed viewed as unnecessary at best.
The Treasury–Federal Reserve Accord of 1951 and the short-lived crunch it caused in residential mortgage markets
I now turn to the end of yield curve control with the Treasury–Federal Reserve Accord of 1951. The accord was an agreement between the Treasury and the Federal Reserve that restored the Federal Reserve’s ability to independently conduct monetary policy and therefore had momentous implications for the history of central bank independence. In the short run, the accord’s impact on financial markets is generally considered to have been fairly limited. Most accounts of the accord spend relatively little time describing how financial markets reacted to the Fed no longer capping yields on Treasury securities. For example, Friedman and Schwartz (1963, pp. 624–625) simply write that “the market quickly adapted itself to fluctuations in the prices of government securities without any financial crisis.” This relatively placid response contrasts with fears that prevailed prior to the accord, expressed at various points in time by the Fed, Treasury, and other market commentators. These fears centered on the potential for dysfunction in the government bond market and uncertainty about how much interest rates would actually increase. As for the latter, Meltzer (2002, p. 714) suggests that “apparently, existing market rates had not been far from equilibrium rates.”
These accounts get the big picture right. No financial crisis ensued. But they miss some aspects of financial tightness that emerged and that may be relevant for policymakers who seek to understand this episode and the lessons it may provide about how yield curve targeting could affect financial markets. After the accord, financial pressure emerged temporarily across long-term private borrowing markets. At the time, the Federal Reserve observed that the “availability of long-term credit in the mortgage and the corporate and municipal bond markets was considerably curtailed” following the accord (Board of Governors of the Federal Reserve System, 1939–51). Below, I review the tightness that emerged in residential mortgages in particular, where the impact was especially pronounced.
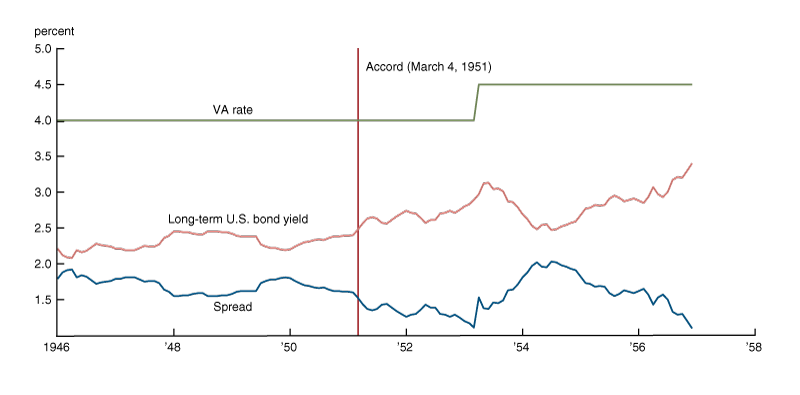
Figure 10. VA mortgage rates and spread with long-term U.S. Treasury bond yields
Mechanisms
The accord caused a short-lived bout of tightness in the residential mortgage market via two mechanisms. The first mechanism involved increased volatility in the spread between mortgage rates and Treasury rates. At this time, the mortgage rates of prime importance were those on Veterans Administration (VA) and Federal Housing Administration (FHA) loans, which together accounted for about 50 percent of all outstanding mortgages by 1950—up from 25 percent in 1945, implying their share of new mortgage originations was very high. The VA administratively set the maximum interest rate on mortgages it would insure at 4 percent, as seen in figure 10. This created a minimum 150 basis point spread over long-term Treasury rates, which were capped before the accord at 2½ percent. The minimum spread made for favorable secondary market conditions, particularly for mortgage originators that depended on the ability to quickly sell loans after origination. For these mortgage companies, a fixed minimum spread meant steady demand from buyers in the secondary market, such as insurance companies.
In contrast, a floating spread introduced more uncertainty to demand after the accord. In this way, the accord caused mortgage companies to pull back from originations temporarily as they adjusted to new market conditions, lest they be forced to warehouse mortgages longer than they desired. Indeed, “the critical situation that has developed in the mortgage market since last March” reportedly led some mortgage companies to cease production of new loans, particularly if they were small or if they did not benefit from diversification from servicing rights (Insured Mortgage Portfolio, 1951, p. 21). These mortgage originators also faced pressure from banks that made warehouse loans to them, which pressured them to reduce the size of their warehousing lines given the increase in risk (Commercial and Financial Chronicle, 1951).
Figure 11. VA loan completions
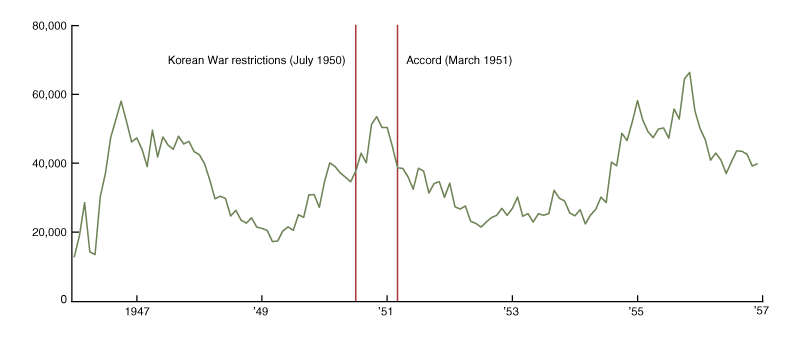
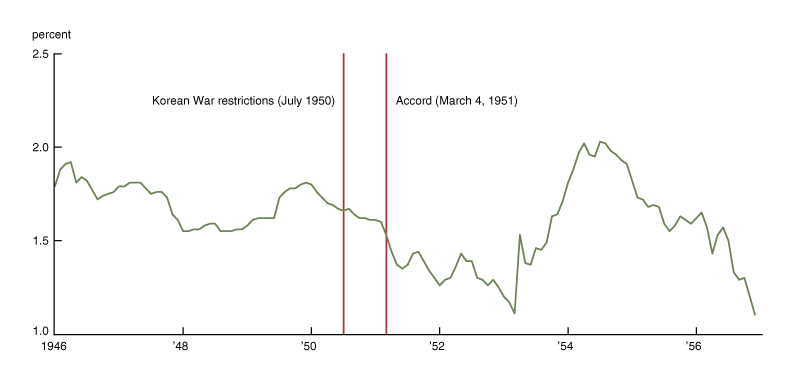
Figure 12. Spread between VA mortgage rate and long-term Treasury rate
The VA might have been able to defuse some of these tensions by moving to a floating rate model, but of course there had been no real need to have such a model operationally ready during a time of yield curve control. I would also speculate that the VA may have been reluctant to give up its control over interest rates, even as this policy of fixed rates created volatility over time in the willingness of lenders to make VA loans.
This episode reveals that the World War II-era yield curve control had brought about a business model at mortgage companies that relied on complete stability in interest rates. The accord in turn disrupted that business model. Eventually mortgage companies coalesced around a new business model in which they relied more heavily on prior commitments, that is, securing advance promises from lenders in the secondary market (mostly insurance companies) to buy loans prior to origination of a loan or even the construction of a subdivision. This allowed mortgage companies to avoid warehousing risk. Nevertheless, the volume of these commitments fluctuated with the forward-looking expectations of insurance companies, still leaving the market with more volatility than it had before the accord (Klaman, 1959, p. 44). In this way “the honeymoon ended in 1951,” in the words of Jones and Grebler (1961, p. 31).
Figures 11 and 12 together show the relationship between VA loan completions and the spread between VA and long-term Treasury rates. VA loan volumes tend to respond to the spread at a lag of a few months. As a result, VA loan volumes fell to low levels after the accord, comparable to those recorded during the 1949 recession. Also notable is the increased volatility of the interest rate spread after the accord.
These figures also show a surge in VA loan closures just after the announcement of credit restrictions related to the Korean War in July 1950, effective for applications dated after October 1950. This announcement caused a surge in VA loan insurance applications before the October deadline and a somewhat more spread-out surge in loan completions as depicted in the figure. Therefore, it is hard to separate out the effects of the accord and the Korean War on VA loan volumes with aggregate data.
The second mechanism involved capital losses on the stock of government debt held by real estate lenders. Some lenders had been funding real estate loans in the postwar period up to 1951 by selling some of their large holdings of government securities—which had been easy and predictable in a market with yields capped at 2½ percent—and using the proceeds of the sale for mortgage loans. This process is illustrated in figure 13 using data from life insurance companies. The Federal Reserve had often been the buyer of Treasury securities on these transactions. When long-term yields rose after the accord, long-term Treasury securities held by private lenders now had capital losses, and selling these securities entailed the realization of those losses.
Figure 13. Life insurance company holdings of U.S. government securities and residential mortgages
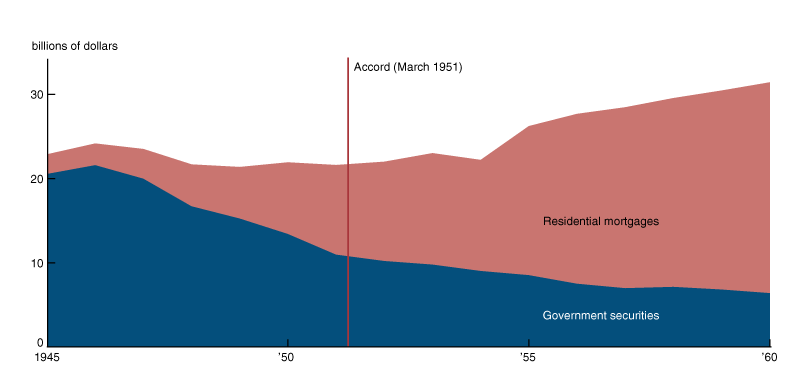
The result was less willingness of lenders to fund mortgages in this manner, especially among lenders that had depended on this channel for funding, such as commercial banks and insurance companies (Jones and Grebler, 1961, pp. 31, 67; Housing and Home Finance Agency, 1952, pp. 26–27, 70). The same dynamic also led to some tightness in corporate and municipal borrowing markets. What is special about mortgage markets is the combination of this effect with the rise in interest rate spread volatility.
The Federal Reserve was well aware of these effects at the time. The Board’s 1951 annual report states that the accord “had an immediate effect upon the supply of mortgage credit” (Board of Governors of the Federal Reserve System, 1952, p. 9). The October 1951 minutes of the FOMC suggest that on balance the Fed viewed mortgage market tightness resulting from the accord as consistent with their aim of reducing inflation: “Credit constraints played some role in curbing inflation, especially in the mortgage market, and that it was likely that had the change in policy not occurred investment institutions would have continued to sell bonds to the Federal Reserve” (Federal Open Market Committee, 1951, p. 3).
Capital losses for investors were perhaps the biggest sticking point in negotiations between the Fed, Treasury, and the Truman administration leading up to the accord. In fact, as part of the accord the Treasury offered investors the option to exchange certain long-term 2½ percent bonds with 2¾ percent bonds, partly on the belief that patriotic investors who had funded the war effort should not bear losses (as they had after World War I). This exchange plan had one side effect, as lenders who held such bonds were effectively “immobilized” as they waited for the exchange to occur (Board of Governors of the Federal Reserve System, 1939–51). Altogether, lenders with exchangeable bonds pulled away from lending as they waited to exchange them, and lenders that didn’t have exchangeable bonds pulled away from lending because they had unrealized capital losses.3
Link with construction activity
Contemporaries saw a direct connection between tightness in residential mortgage markets and a drop-off in construction activity. “Throughout most of the summer [of 1951] the shortage of mortgage money was a serious problem to home builders and buyers,” as the “severe tightening of mortgage money” contributed to the decline in housing starts, according to the Housing and Home Finance Agency (HHFA), the top federal housing agency of the day (Housing and Home Finance Agency, 1952, pp. 19, 27). Newspapers carried stories about this impact as well. For example, The Washington Post noted that:
It’s difficult for a veteran to get the 4 percent GI home loan right now if he wants to buy an existing house. It’s even tougher for a builder to get financing on houses he wants to build and sell under the Veterans’ Administration mortgage guaranties. … When a builder contacts his mortgage broker here for funds to build a GI home loan subdivision, the broker has to turn him down. … It is “virtually impossible to assure a builder that his houses can be sold GI when they are completed.” (Washington Post Company, 1951).
The builders referred to in this quote likely were trying to arrange for a type of construction loan in which the loan is directly converted into a set of individual VA mortgage loans upon completion of construction.
Figure 14. Housing starts: Growth in one-family nonfarm private homes (year-over-year)
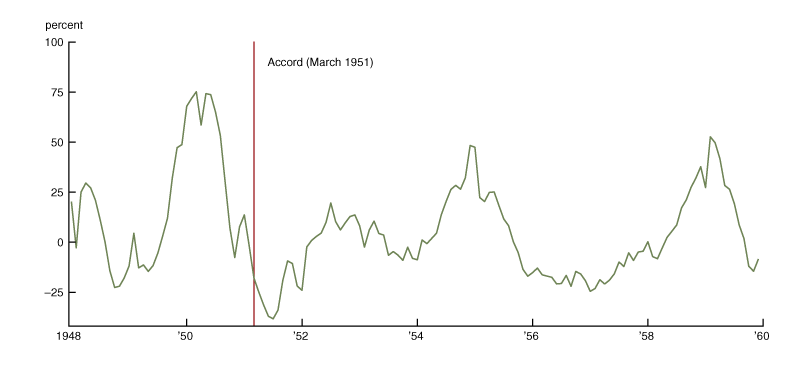
Figure 14 shows the growth of housing starts over the postwar period. These starts contracted on a year-over-year basis in the 1949 recession and in 1951 following the accord and the onset of the Korean War. Again, it is difficult to separate out the effect of the Korean War policies and the accord. According to the HHFA, Korean War mobilization did restrict the availability of “certain critically scarce metal items [but] the over-all supply of building materials was satisfactory in 1951” (Housing and Home Finance Agency, 1952, p. 2).
Conclusion
This article has sought to understand the financial dynamics surrounding the beginning and the end of yield curve control in the United States from 1942 to 1951. Regarding the onset, scholars have puzzled as to why the Federal Reserve did not begin acquiring large amounts of Treasury bills until 1943, a year after the advent of its yield curve targeting. The history reviewed here emphasizes that while investors did have an immediate incentive to go long under the upward sloping yield curve, a special T-bill facility created an incentive to invest in the short end as well, given perfect liquidity and a slightly higher interest rate than had prevailed at that maturity previously. Therefore, this period from mid-1942 to mid-1943, when commercial banks acquired T-bills in large amounts, should not be thought as an aberration from rational action by private investors. Rather, it is an episode that reveals the core of how the Treasury and Fed tried to manage the yield curve as a whole. The T-bill facility was a compromise between the two institutions as they tried to manage the short end of the Treasury curve in a way that would be consistent with a 2½ percent cap on long-term rates.
This article has also sought to understand the impact of the end of yield curve control in 1951, in particular for the residential mortgage market. One lesson of this episode is that the end of yield curve control will cause capital losses for investors holding longer-term securities if long-term yields rise. If such investors include major credit providers, some degree of downward pressure on the supply of credit would be the natural result. This mechanism is not dramatically distinct from capital losses that can occur during any typical period of rising long-term rates, but the magnitude of credit losses may be particularly significant following a long period in which yield curve control shaped asset holdings. A second lesson is that yield curve control can lead financial firms to create business models that are predicated on complete stability in government security prices. In other words, yield curve control can change not only the expected level of interest rates but also their expected volatility. In this episode, the business models of financial institutions, once disrupted, took some time to be reformulated, resulting in temporary tightness in credit availability.
Notes
1 Federal Open Market Committee (2020a, 2020b).
2 Banks in reserve cities were required to maintain higher legal reserves than so-called country banks (commercial banks located in other areas).
3 The bonds up for exchange were “bank-restricted” bonds, that is, bonds that were not purchasable during the war by banks. The Treasury had imposed ownership restrictions on many long-term bond issues in the aim of keeping bank assets liquid and out of fear of a mechanism in which bank ownership of such bonds would lead to inflation. Thus, banks were primarily the lenders that held bonds not up for exchange, while insurance companies and savings banks were the lenders participating in the exchange, along with legions of household investors.
References
Board of Governors of the Federal Reserve System, 1976, Banking and Monetary Statistics, 1941–1970, report, Washington, DC.
Board of Governors of the Federal Reserve System, 1952, Thirty-Eighth Annual Report of the Board of Governors of the Federal Reserve System: Covering Operations for the Year 1951, Washington, DC, available online.
Board of Governors of the Federal Reserve System, 1939–51, Federal Reserve Bulletin.
Chandler, Lester V., 1949, “Federal Reserve policy and the federal debt,” American Economic Review, Vol. 39, No. 2, March, pp. 405–429, available online.
Chaurushiya, Radha, and Ken Kuttner, 2003, “Targeting the yield curve: The experience of the Federal Reserve, 1942–51,” Board of Governors of the Federal Reserve System, memo, June 18, available online.
Commercial and Financial Chronicle, 1951, Vol. 173, No. 5014, William B. Dana Company, May 24.
Commercial and Financial Chronicle, 1942a, Vol. 155, No. 4076, William B. Dana Company, May 28.
Commercial and Financial Chronicle, 1942b, Vol. 155, No. 4074, William B. Dana Company, May 21.
Eichengreen, Barry, and Peter M. Garber, 1991, “Before the accord: U.S. monetary-financial policy, 1945–51,” in Financial Markets and Financial Crises, R. Glenn Hubbard, ed., Chicago: University of Chicago Press, pp. 175–206.
Federal Open Market Committee, 2020a, minutes of the Federal Open Market Committee, July 28–29, 2020, Washington, DC, August 19, available online.
Federal Open Market Committee, 2020b, minutes of the Federal Open Market Committee, June 9–10, 2020, Washington, DC, July 1, available online.
Federal Open Market Committee, 1951, minutes of the Federal Open Market Committee, Washington, DC, October 4, 1951, available online.
Friedman, Milton, and Anna Jacobson Schwartz, 1963, A Monetary History of the United States, 1867–1960, Princeton, NJ: Princeton University Press.
Garbade, Kenneth, 2020, “Managing the Treasury yield curve in the 1940s,” Federal Reserve Bank of New York, staff report, No. 913, February. Crossref
Housing and Home Finance Agency, 1952, Fifth Annual Report: Calendar Year 1951, Washington, DC: U.S. Government Printing Office.
Insured Mortgage Portfolio, 1951, Laughlin, C., and E. V. McDonald, “A mortgage company looks at Title I,” Vol. 16, No. 2, Fourth Quarter, pp. 21–22.
Jones, Oliver, and Leo Grebler, 1961, The Secondary Mortgage Market: Its Purpose, Performance, and Potential, Los Angeles: University of California, Los Angeles.
Klaman, Saul B., 1959, The Postwar Rise of Mortgage Companies, New York: National Bureau of Economic Research.
Meltzer, Allan H., 2002, A History of the Federal Reserve, Volume 1: 1913–1951, Chicago: University of Chicago Press.
Murphy, Henry C., 1950, The National Debt in War and Transition, New York: McGraw-Hill.
Walker, Charls E., 1954, “Federal Reserve policy and the structure of interest rates on government securities,” Quarterly Journal of Economics, Vol. 68, No. 1, February, pp. 19–42. Crossref
Washington Post Company, 1951, “It’s tough to get a GI home loan nowadays,” Washington Post, April 22, p. R1.
Wicker, Elmus R., 1969, “The World War II policy of fixing a pattern of interest rates,” Journal of Finance, Vol. 24, No. 3, June, pp. 447–458. Crossref


