

Introduction and summary
In this article, we first examine the pertinent differences between electric vehicles (EVs) and internal combustion engine (ICE) vehicles and then address the question of how the rapid growth of EVs might impact the prevailing geography of automotive production in North America—which comprises Canada, Mexico, and the United States.1 We suggest that the geography of battery electric vehicle (BEV) production is influenced by factors such as agglomeration economics and economies of scale that also underlie the location of ICE vehicle production.
Until now, BEVs have accounted for a rather small share of total motor vehicle sales in North America and across the globe. Worldwide, 8 percent of total sales of light vehicles (cars and light trucks) were BEVs and plug-in hybrid electric vehicles (PHEVs)2 in 2021; moreover, in 2021, these types of electric vehicles made up 17 percent of light vehicle sales in Europe, 13 percent in China, 4 percent in North America, and 2 percent in the rest of the world (Irle, 2022). The BEV share of such sales is anticipated to increase rapidly in the years ahead. As BEV sales increase, an important question is the extent to which production will take place in current locations or move to new ones. We suggest that production facilities are likely to continue to be located near their final markets.
In the next section, we discuss the distinctive features of BEVs—including a U.S. regulatory environment that supports increasing their production and sales, as well as some obstacles to consumer acceptance—that may impact the distribution of BEV factories. In the section after that, we describe the current geography of traditional ICE vehicle production in North America and the underlying economic factors explaining it. We then discuss in the following section the emerging geography of BEV production across North America—specifically, the locations for light vehicle and battery production. Finally, we present some closing thoughts on the future of BEV and battery manufacturing in North America.
Distinctive features of BEVs (and other EVs)
In many respects, a BEV differs little from a traditional ICE vehicle. Both consist of a passenger compartment with seats, gauges, and steering mechanisms, built on a platform to which axles, wheels, brakes, and tires are attached. The basic difference between an ICE vehicle and a BEV is the source of propulsion. An ICE vehicle includes an engine powered by igniting gasoline and an elaborate transmission, whereas a BEV features a motor powered by a battery pack and a simpler transmission. For both an ICE vehicle and BEV, the powertrain represents a substantial portion of the vehicle’s cost: on average, 29 percent in the case of an ICE vehicle and 39 percent in the case of a BEV.3
A BEV is powered entirely by an electric motor.4 The electrical energy to power the motor is stored in a battery pack typically attached to the chassis under the passenger compartment. The BEV’s battery pack is recharged by plugging the vehicle into a source of electricity.5
A BEV is equipped with regenerative braking, which gives the motor a little recharge every time the driver touches the brake pedal (Union of Concerned Scientists, 2018). The vehicle captures energy normally lost during braking by using the electric motor as a generator and storing the captured energy in the battery. A BEV does not have a gas-powered ICE, so this type of vehicle does not need a fuel line or an exhaust system.
An ICE vehicle’s transmission contains between four and ten gears that are connected to the engine by means of an input shaft and a crankshaft and to the axles by means of an output shaft. The transmission gears adjust the input shaft and crankshaft to turn faster or slower than the output shaft, depending on conditions. Torque is a rotating force produced by an engine’s crankshaft. The speed of the turn is measured as the number of revolutions per minute (RPM) that the input shaft—as well as the engine’s crankshaft to which it is attached—rotates (Sherman, 2016).6
As with an ICE vehicle, a BEV needs a transmission to transfer power from the motor to the axles and to change the direction of rotation. A BEV needs only one gear rather than as many as ten, as found in an ICE vehicle, although some BEVs are being marketed with multiple gears. Unlike an ICE, which needs gears to increase torque at low speeds, an electric motor generates 100 percent of its torque even at low speeds (Adams, 2019; Fernie, 2016; and Sorokanich, 2017).
As we mentioned before, in addition to the BEV, the motor vehicle industry produces other types of electrified vehicles, which are defined as follows.
- Hybrid electric vehicle (HEV). An HEV, more commonly called a hybrid vehicle, is powered almost entirely by an ICE, but as the car moves from a complete stop, it first uses electric power. The ICE kicks in as the vehicle achieves speed. A computer determines when the vehicle is to use gas or electricity. The battery can also reduce engine idling when the vehicle is stopped (Diaz, 2020; and Klier and Rubenstein, 2021b).
- Plug-in hybrid electric vehicle (PHEV). A PHEV has both an electric motor and an ICE. The PHEV battery can be charged either by an outside electric power source (like a BEV battery can) or by the ICE. A PHEV operates as a BEV until its battery capacity drops to a certain level, at which point a relatively small ICE generates more electricity or powers the wheels directly (depending on the configuration) for additional range (Diaz, 2020; and Klier and Rubenstein, 2021b).
- Fuel cell electric vehicle (FCEV). An FCEV has an electric motor powered by hydrogen gas stored in a tank attached to the vehicle, sometimes in combination with a small battery.7
The Biden administration has set a goal for EVs to make up 50 percent of new vehicles sold in the United States in 2030 (White House, 2021).8 In this section, we reference forecasts from industry analysts for EV production and sales in the years ahead. We then review national and state policies and regulations designed to promote the production and sales of EVs. Finally, we discuss possible factors that have made some consumers reluctant to purchase an EV. That reluctance could be a significant barrier to achieving the Biden administration’s 50 percent goal.
EV production and sales forecasts
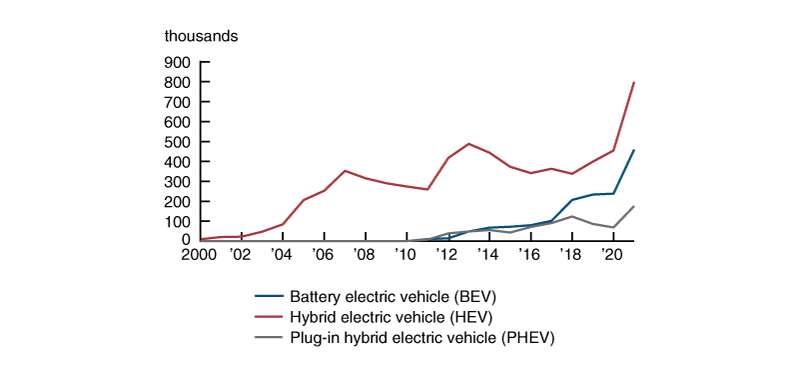
EV sales in the United States totaled 1,434,637 in 2021, made up of 459,474 sales of BEVs, 799,046 of HEVs, and 176,117 of PHEVs, according to our calculations based on data from Wards Intelligence (we excluded the sales of FCEVs). Sales of BEVs have increased every year since 2008—the year that Tesla sold its first car (see figure 1). The largest increase was between 2020 and 2021, when sales rose by over 220,000 units from 238,540 to 459,474. As a share of total vehicle sales in the United States, BEVs accounted for 3.1 percent in 2021,9 and the three EV categories (BEVs, HEVs, and PHEVs) combined amounted to a 9.6 percent share of the total that year, according to our calculations based on sales data from Wards Intelligence.
Figure 1. Annual electric vehicle sales in the United States, 2000–21
Forecasts by industry leaders for electric vehicle production and sales in North America—and in the United States in particular—during the next few years vary widely. IHS Markit forecasts an electric vehicle share of 64 percent of total North American light vehicle production in 2030 (a BEV share of 36 percent and an HEV and PHEV share of 28 percent) (see figure 2). A 2021 KPMG survey of 1,118 automotive industry executives resulted in widely varying forecasts for EV adoption; the mean response for EV market share in 2030 was 52 percent in the United States, China, and Japan and 48 percent in Western Europe, but answers ranged from 5 percent to 90 percent (Irwin, 2022).
Figure 2. North American light vehicle production, 2018–30, by propulsion type
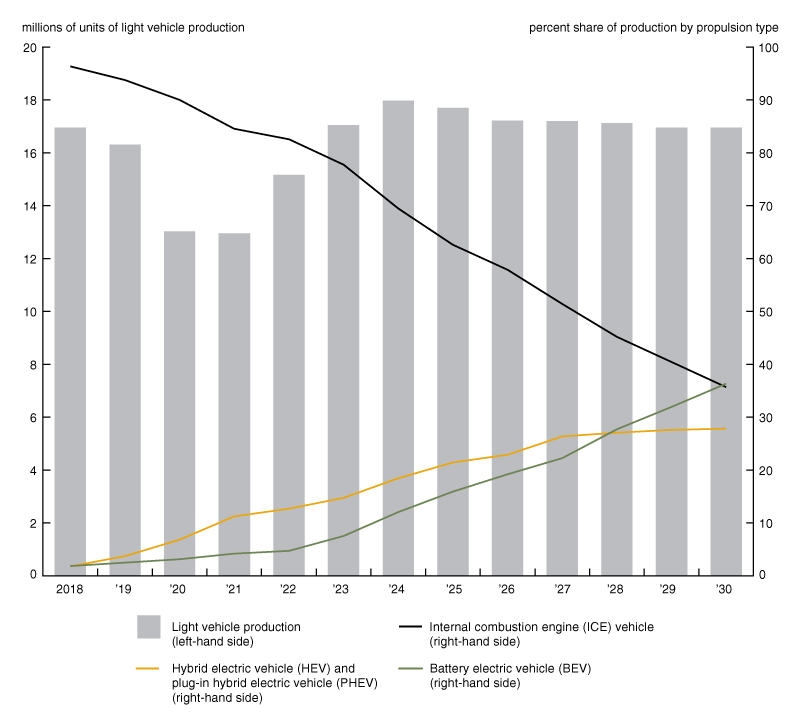
Source: Robinet (2022).
On the one hand, ZF Group, the world’s third-largest motor vehicle parts supplier, anticipated EVs to represent 49 percent of all vehicles assembled in North America in 2030 and 45 percent of all vehicles assembled worldwide. On the other hand, Magna International, the world’s fourth-largest parts supplier, forecasted a 2030 EV market share of only 20 percent worldwide and the EV market share in the United States to be below the global average. Both projections were shared in early 2022. A representative from Bosch, the world’s largest parts supplier, declined to share a forecast of 2030 EV production or sales at a major trade show in January 2022 (Irwin, 2022).
Regulatory and policy impacts on EV production and demand
In the United States, three types of government policies have encouraged the growth of BEV production and sales—namely, fuel economy standards, financial incentives, and ICE vehicle bans.10
The longest-standing policies have been the enactment of regulations designed to control vehicle emissions and increase fuel efficiency. At the federal level, several pieces of legislation, beginning with the 1965 Motor Vehicle Air Pollution and Control Act, set national standards for emissions. The 1970 amendments to the federal Clean Air Act required reductions of around 90 percent in emissions of hydrocarbons and carbon monoxide by 1975 and of nitrogen oxide by 1976, later pushed back by two years because of pressure from auto manufacturers. The Environmental Protection Agency (EPA), which had been established by the 1970 National Environmental Policy Act, was charged with enforcing the Clean Air Act (Flink, 1990, p. 387).
In order to decrease dependency on foreign oil, federal policy during the 1970s was focused on mandating more fuel-efficient vehicles (Flink, 1990, p. 389). The 1975 Energy Policy and Conservation Act authorized the U.S. Department of Transportation’s National Highway Traffic Safety Administration (NHTSA) to establish Corporate Average Fuel Economy (CAFE) standards. The actual averages in 1974 were 13.2 miles per gallon (mpg) for the Detroit Three automakers—Chrysler (now Stellantis), Ford, and General Motors (GM)—and 22.2 mpg for foreign automakers (Flink, 1990, p. 388). Each automaker was required to achieve an overall average by 1985 of 27.5 mpg for cars and 19.5 mpg for light trucks; the CAFE level increased in 2010 to 23.4 mpg for light trucks (Klier and Linn, 2011; and U.S. Department of Transportation, National Highway Traffic Safety Administration, 2014).
Fuel efficiency for cars and light trucks combined remained virtually unchanged through the 1990s and the first decade of the twenty-first century; the fuel economy average rose from 21.2 mpg in 1990 to 22.6 mpg in 2010 (U.S. Environmental Protection Agency, 2021, table 3.1, p. 32). Fuel efficiency for light vehicles did improve at a somewhat faster rate between 2010 and 2020; however, the actual average achieved in 2020 was 25.4 mpg overall (U.S. Environmental Protection Agency, 2021, table 3.1, p. 32). Given the lower CAFE standard for light trucks compared with that for cars, the rapid increase in the market share for trucks translated into slower growth for the overall actual fuel economy average (U.S. Environmental Protection Agency, 2021, pp. 30–31).
The 2007 Energy Independence and Security Act raised the CAFE standard for cars and trucks combined to 35 mpg by 2020 (Sissine, 2007). In 2011, the Obama administration set a combined CAFE standard for both cars and light trucks of almost 55 mpg by 2025 (White House, Office of the Press Secretary, 2012). In 2018, the Trump administration began a process of revising the CAFE standard down to about 40 mpg by 2026 (Beitsch, 2020). Before that lower standard could be implemented, the incoming Biden administration reversed course again, and in 2022 it raised the CAFE standard to 49 mpg by 2026 (Lode and Deeb, 2022).
The fuel economy of a BEV is calculated as miles per gallon equivalent (MPGe). Consuming one gallon of gasoline is considered equivalent to consuming approximately 33.7 kilowatt hours (kWh) of electricity (Ganz, 2022). The average BEV consumes approximately 0.346 kWh per mile, and therefore travels approximately 2.9 miles per 1 kWh; as a result, the MPGe for an average BEV is calculated as 2.9 miles per kWh multiplied by 33.7 kWh, or approximately 98 MPGe.11 Thus, to comply with a CAFE standard of 49 mpg by 2026, automakers have moved quickly to produce a large number of BEVs that could offset ICE efficiencies of 25 or so mpg to reach the 49 mpg average.
California has led the way in emissions controls, beginning with a requirement that as of 1963 all new vehicles sold in that state had to be equipped with a device to ventilate the crankcase (Flink, 1990, p. 387). The California Air Resources Board (CARB), created in 1967, sets and enforces vehicle emissions and efficiency standards.12 The U.S. Clean Air Act gives California the authority to adopt emissions standards higher than the federal ones set by NHTSA and EPA, and CARB has frequently done so (Lattanzio, 2022, pp. 10–11). CARB is authorized to regulate greenhouse gas (GHG) emissions. Carbon dioxide (CO2), a GHG, is emitted by cars, providing the link to fuel economy standards. Adding to CARB’s influence, 17 other states (Colorado, Connecticut, Delaware, Maine, Maryland, Massachusetts, Minnesota, Nevada, New Jersey, New Mexico, New York, Oregon, Pennsylvania, Rhode Island, Vermont, Virginia, and Washington) have since enacted legislation to implement CARB standards (California Air Resources Board, 2022).
Two types of financial incentives have encouraged the sales of BEVs. One set of incentives is directed at the vehicle manufacturers—and the other at consumers.
The principal incentive directed at manufacturers stems from California’s ZEV (zero-emission vehicle) mandate. According to a CARB rule adopted in 1990 and modified in 2012, each car sold earns a number of credits based on what type of EV it is and what its battery range is. The credit requirement to be in compliance with the ZEV program has been 7 percent of each auto manufacturer’s total vehicles sold within a CARB state since 2019—and this credit requirement will rise to 22 percent in 2025; notably, given that not all EVs receive only 1 credit per sale (many get above 1 credit), the ZEV credit share of an automaker’s total vehicle sales within a state does not directly reflect the EV share of that total (Union of Concerned Scientists, 2019).13
Moreover, a manufacturer complies with the ZEV requirement by producing and selling no- and low-emission vehicles or by purchasing ZEV credits from companies willing to sell their surplus credits. From selling some of its ZEV credits, Tesla earned nearly $600 million in 2019, $1.6 billion in 2020, and $1.5 billion in 2021 (Stock Dividend Screener, 2022). Besides California itself, 15 other states follow California’s ZEV system: Colorado, Connecticut, Maine, Maryland, Massachusetts, Minnesota, Nevada, New Jersey, New Mexico, New York, Oregon, Rhode Island, Vermont, Virginia, and Washington (International Council on Clean Transportation, 2022; and California Air Resources Board, 2022).
The principal consumer incentive is the Clean Vehicle Credit contained in the Inflation Reduction Act of 2022. Consumers are entitled to a federal income tax credit of up to $7,500 for the purchase of a new EV that meets two requirements—specifically, $3,750 in credit depending on where critical minerals contained in the battery were sourced and another $3,750 in credit depending on where the battery components were manufactured or assembled.
The critical battery minerals requirement to receive the first $3,750 tax credit indicates that a significant (shifting) portion of the critical minerals must be extracted or processed in the United States or a U.S. free trade agreement partner country or recycled within North America; this share must exceed 40 percent of the battery’s value in 2023, 50 percent in 2024, 60 percent in 2025, 70 percent in 2026, and 80 percent in 2027 and beyond.
The battery components requirement for the second $3,750 tax credit indicates that a significant (shifting) portion of the value of the battery’s components must be manufactured or assembled in North America; this share must be at least 50 percent of the battery’s value in 2023, 60 percent in 2024 and 2025, 70 percent in 2026, 80 percent in 2027, 90 percent in 2028, and 100 percent in 2029 and beyond.
To be eligible for the credits, the manufacturer’s suggested retail price must not exceed $80,000 for vans, sport utility vehicles (SUVs), and pickups and $55,000 for other vehicles. In addition, the consumer’s modified adjusted gross income must not exceed $150,000 for a single tax filer, $225,000 for a head-of-household filer, and $300,000 for joint filers.14
The Clean Vehicle Credit replaces a $7,500 tax credit for a vehicle acquired after December 31, 2009. The original credit did not include sourcing or income requirements, but only the buyers of a company’s first 200,000 BEVs or PHEVs qualified for the full tax credit. The Inflation Reduction Act of 2022 ended this per-manufacturer lifetime cap of 200,000 vehicles being eligible for the full tax credit.15
While there are now federal EV tax credits available, 31 states have imposed additional fees for registering EVs (see figure 3). All 31 states levy these extra registration fees for BEVs, while a subset of 18 states levy them for PHEVs and/or HEVs. For example, to the base annual vehicle registration fee, Ohio imposes an additional $100 for hybrid motor vehicles and $200 for plug-in electric motor vehicles. The justification for the extra fees is that by not using gasoline, an EV owner does not contribute to the fuel tax—an important source of revenue for road maintenance (Igleheart, 2022).
Figure 3. U.S. states with fees for non-internal-combustion-engine (non-ICE) vehicles
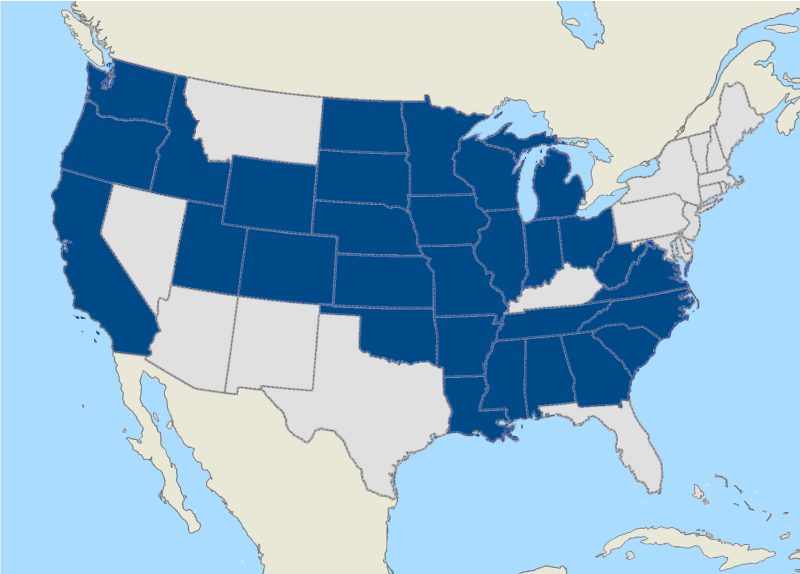
Sources: Authors’ adaptation of information from Igleheart (2022); and ArcGIS.
The most extreme policy supporting BEV production is an outright ban on the sale of ICE vehicles. As of August 2022, 12 U.S. states had banned ICE vehicle sales—through either executive order or legislation—in most cases by 2035: California, Connecticut, Hawaii, Maine, Massachusetts, New Jersey, New Mexico, New York, North Carolina, Oregon, Rhode Island, and Washington (Jones, 2022; and Dow, 2021).16 The Biden administration chose not to issue an outright ban and instead set a national goal of 50 percent EV sales in 2030. Most automakers have been supportive of the Biden administration’s goal (Shepardson and Mason, 2021). To support its national EV sales goal, the Biden administration has enacted and begun implementing policies to provide funds for charging stations and other electricity infrastructure for BEVs (see, for example, U.S. Department of Transportation, Federal Highway Administration, 2022).
Obstacles to consumer acceptance of BEVs
Some consumers are reluctant to buy BEVs because their sticker prices tend to be higher than those for ICE vehicles. According to Cox Automotive (2021), just over half of shoppers noted “EVs were too expensive to seriously consider.” A 2022 study by Energy Innovation Policy and Technology LLC compared all of the costs associated with buying and operating several vehicles available in both ICE vehicle and BEV models (Orvis, 2022). We focused on four of the six pairs analyzed: the Hyundai Kona SEL, Ford F-150, Kia Niro, and Volvo XC40. Among those four models, the initial purchase price averaged 36 percent higher for the BEV versions. However, the lifetime ownership cost (including the initial purchase) was 11 percent lower for the BEV versions (authors’ calculations based on data from Orvis, 2022).
From the perspective of consumers, the most distinctive feature of a BEV is the need to plug it into a charger. Surveys suggest that consumer reluctance to purchase a BEV stems primarily from recharging issues. Although most charging is done at home (J.D. Power, 2021a), two principal concerns are the availability of a charging station when needed and the time it takes to recharge the battery.
The inability to find a charging station when needed is a major source of “range anxiety.” According to one J.D. Power article, EV drivers feel range anxiety “when the battery charge is low, and the usual sources of electricity are unavailable,” sparking “a fear of getting stranded somewhere, which adds time, inconvenience, and stress to a journey” (Wardlaw, 2020). As the New York Times reported, Asad Hussain, a senior analyst at PitchBook, observed: “You talk to anyone who’s on the fence about buying an E.V. and the No. 1 concern that comes to mind is range anxiety” (Chokshi, Goldstein, and Woo, 2021). The 2021 J.D. Power Electric Vehicle Experience (EVX) Ownership Study concluded that among people who owned a BEV, the driving range of the battery was the most frequently cited factor in deciding which one to buy (J.D. Power, 2021b).
Range anxiety is triggered by lack of a nearby charging station. The United States had 48,441 public charging stations with 125,240 ports as of late November 2022.17 Public charging stations are currently not distributed uniformly across the United States. As of April 2021, California had 30 percent of the stations across the entire United States; New York, 6 percent; Florida and Texas, 5 percent each; and Massachusetts, 4 percent (authors’ calculations based on data from Zpryme, 2021). Public charging stations were most frequently installed at hotels, car dealerships, office buildings, and federal government facilities (Zpryme, 2021).
Consumers are also reluctant to purchase BEVs because of the time it takes to charge. Charging ports at stations are designated as Level 1, Level 2, or Level 3—also known as DC (direct current) fast charging—depending on the speed with which the charge is delivered (the higher the level, the faster the charge). In 2022, only 21 percent of the ports at public charging stations were Level 3 ports, which offer 480 or more volts of DC power and deliver around 60–80 miles of driving range per 20 minutes of charge. Predominating in 2022—78 percent of the national total—were Level 2 ports, which offer 240 volts of AC (alternating current) power and deliver around 10–20 miles of driving range per hour of charge. The remaining 1 percent were Level 1 ports, which offer 120 volts of AC power and deliver only 2–5 miles of range per hour of charge.18
Car and Driver sent 11 BEV models on a 1,000-mile drive beginning and ending in Ann Arbor, Michigan, with most of the time spent in Ohio. Tesla’s Model Y and Model 3 vehicles completed the trip in around 18 hours—with 15 hours of that time devoted to driving (for an average of 67 miles per hour) and 3 hours devoted to charging at Tesla’s proprietary fast-charging stations. Other automakers’ BEV models took much longer to charge (Tingwall, 2021). A 17 percent longer travel time compared with an ICE vehicle—even for some of the best-performing BEVs—is a significant disincentive for motorists who regularly drive relatively long distances.19 As reported by Automotive News, Ryan Miller, manager of electrified powertrain development at the Hyundai Kia America Technical Center in Chino, California, conceded: “To close that gap is a monumental task” (Iliff, 2021).
To facilitate long-distance travel—the principal source of range anxiety—the Biden administration announced in February 2022 that it would use the $5 billion that Congress allocated as part of the 2021 Infrastructure Investment and Jobs Act to support BEVs by constructing more charging stations. States were required to submit plans by August 2022 to explain how they would install high-voltage chargers along major highways, no more than 50 miles apart. Another $2.5 billion has been allocated to constructing chargers in rural areas and other communities where private sector providers have not been constructing them (Ewing, 2022).20
Meanwhile, the National Electric Highway Coalition (NEHC) was established in December 2021 to install fast-charging stations along major U.S. highway routes by the end of 2023 to facilitate electric vehicle growth. NEHC was formed through the merger of two smaller organizations established earlier in 2021—the Electric Highway Coalition, which had been set up by six major utility companies, and the Midwest Electric Vehicle Charging Infrastructure Collaboration, which had been set up by five Midwest states (Jones, 2021).
Charging stations are not distributed uniformly across the United States. A map based on data from the U.S. Department of Energy’s Alternative Fuels Data Center (AFDC) displays the high density of charging stations along north–south routes on the East and West Coasts, as well as the paucity of such stations in much of the remainder of the country (see figure 4).
Figure 4. Locations of public charging stations for electric vehicles in the United States, November 2022
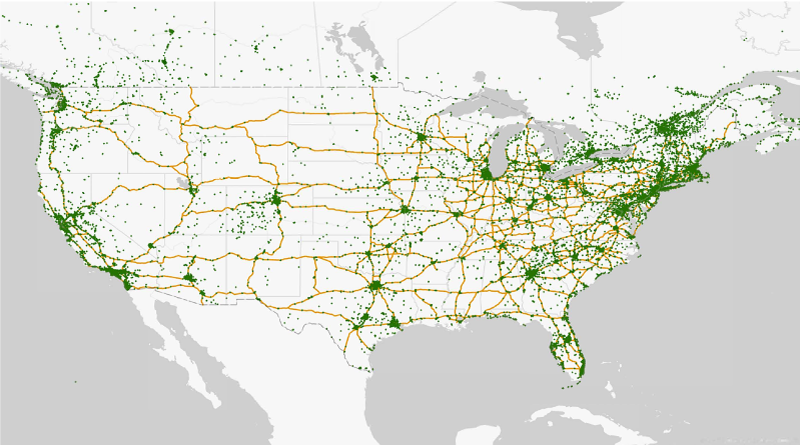
Sources: Authors’ adaptation of data from the U.S. Department of Energy, Office of Energy Efficiency & Renewable Energy, Alternative Fuels Data Center, available online; and ArcGIS.
The distribution of charging stations also varies widely among metropolitan areas (Bui, Slowik, and Lutsey, 2021, figure 2, p. 4). For the 50 most populous metropolitan areas, the number of DC fast chargers per million population ranged in 2021 from around 250 in San Jose to around ten in New Orleans, and the number of Level 2 chargers per million population ranged from around 900 in San Jose and Los Angeles to around 75 in Oklahoma City (Bui, Slowik, and Lutsey, 2021, figure 2, p. 4). Metropolitan areas with relatively high densities of charging stations have relatively high BEV ownership rates. According to Bui, Slowik, and Lutsey (2021, p. 12), there is “a clear trend where electric [vehicle] sales and public charging infrastructure grow in unison.”
Besides federal and regional efforts to expand and improve electric charging infrastructure in order to boost BEV adoption, there are some state-level ones under way. For instance, Michigan State University researchers developed a plan for optimizing the location of charging stations within Michigan. They concluded that Michigan’s top priority was to place stations along the highways between population centers before filling out the network with units in cities (Ghamami et al., 2019, 2020).
The installation of more charging stations in relation to boosting BEV adoption (and vice versa) is a chicken-and-egg challenge. Indeed, sales of BEVs are not increasing rapidly enough for charging stations to yield a profit (Chokshi, Goldstein, and Woo, 2021). Pournazeri (2022) states that “for Level 2 chargers, the total cost of EV charger deployment can vary between $2,700 to $24,000 per charger (excluding outliers), and for DCFCs [DC fast-charging units], it can range from $70,000 to $130,000.”21 Yet, venture capital has been pouring into charging companies, just as it has into start-up BEV manufacturers.
ChargePoint is the leader in installing charging stations. The company had installed around 49,000 ports as of the fourth quarter of 2021, or 43 percent of public ports in the Station Locator maintained by the U.S. Department of Energy’s Alternative Fuels Data Center (Brown, Schayowitz, and White, 2022, p. 10). Tesla’s two sets of proprietary charging networks (Destination and Supercharger) together accounted for around 20 percent of public ports; 19 other companies running EV charging networks—plus some out-of-network stations—tracked by the AFDC Station Locator system accounted for the remaining share of public ports (authors’ analysis based on data from Brown, Schayowitz, and White, 2022, figure 8, p. 10). Other BEVs have generally not been able to charge on Tesla’s network, mostly because Tesla uses a different plug. However, as part of its implementation of the 2021 Infrastructure Investment and Jobs Act, the U.S. Department of Transportation will mandate standardized plugs (and adapters) at public charging stations to accommodate all BEVs (including Tesla vehicles) (McAllister and Curran, 2022).22
As an alternative to charging stations, Ample, a start-up company in San Francisco, has opened battery swap stations in the San Francisco area, primarily for Uber drivers. At the Ample station, the specific battery modules that are drained are identified and replaced in ten minutes—still longer than what it typically takes to fill up at a gasoline pump. The discharged modules removed from the vehicle are charged and reused in other vehicles (Baldwin, 2021; and Lienert, 2021).
The scale of the charging infrastructure and the speed with which it grows will be important factors affecting the pace at which consumers accept the new propulsion technology (Keith, Struben, and Naumov, 2020). If plug-in vehicles increasingly start showing up on roads, fuel stations and crude oil refineries could shut down and auto repair shops could adjust to primarily service EVs. In time, it may become too challenging for consumers to own conventional ICE vehicles (Plumer, Popovich, and Migliozzi, 2021). As reported by the New York Times, Christopher R. Knittel, MIT Sloan School of Management economist, stated: “It would not shock me if the transition eventually starts accelerating. Right now it can be inconvenient to own an electric vehicle if there are no charging stations around. But if we do get to a world where there are charging stations everywhere and few gas stations around, suddenly it’s less convenient to own a conventional vehicle” (Plumer, Popovich, and Migliozzi, 2021).
The geography of ICE vehicle production in North America
The two key factors shaping the geography of ICE vehicle production are agglomeration economics and economies of scale (Klier and Rubenstein, 2015, 2017). Agglomeration refers to the association of productive activities in proximity to one another (Gregory et al., 2009, p. 14). The motor vehicle industry is considered one of the most highly agglomerated (Ellison and Glaeser, 1997).
The economic geography principles underlying agglomeration are derived from the work of Alfred Weber (1929). Weber distinguishes between bulk-reducing and bulk-gaining industries. In a bulk-reducing industry, inputs are heavier or occupy a greater volume than the final product, whereas in a bulk-gaining industry, the fabricated product is heavier or occupies a greater volume than the inputs. According to Weber, in order to minimize shipping costs, a bulk-reducing industry locates production facilities near its sources of inputs, whereas a bulk-gaining industry locates production facilities near its markets.
The motor vehicle sector is a good example of a bulk-gaining industry. Accordingly, its production facilities are located to minimize shipping to consumers. This plays out at both the global and regional scale.
At the global scale, most ICE vehicles sold in North America, as well as their gasoline-powered engines, are produced in North America. Imports from other regions, such as Asia and Europe, account for only 24 percent of vehicles sold in North America and for only 14 percent of engines installed in vehicles assembled in North America (Klier and Rubenstein, 2022).
At the regional scale, most of North America’s final assembly plants for ICE vehicles (as well as engine plants) are clustered in either “auto alley” or central Mexico (see figure 5). Auto alley is the auto production corridor within the United States between the Great Lakes and the Gulf of Mexico with an extension at its northern end into southern Ontario, Canada. It became the principal location for auto production beginning in the 1980s in order to minimize distribution of assembled vehicles to consumers throughout the United States (Rubenstein, 1992). In the twenty-first century, a second center of agglomeration for auto production emerged in central Mexico (Klier and Rubenstein, 2017).
Figure 5. Locations of light internal combustion engine (ICE) vehicle assembly plants in North America, 2021
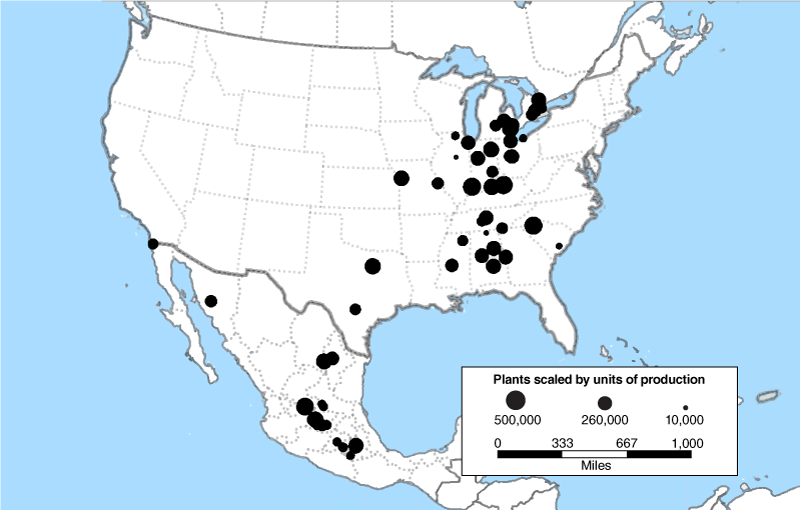
Sources: Authors’ adaptation of data from Wards Intelligence and Maptitude.
Also playing a major role in the geography of ICE motor vehicle production is the principle of economies of scale. Economies of scale refer to the fact that the volume of output can influence the per-unit cost of production (Cedillo-Campos, Sanchez-Garza, and Sanchez Ramirez, 2006; Klier and Rubenstein, 2015, p. 105; Lung, 2004; Truett and Truett, 1996, 2001, 2003; and Wynn-Williams, 2009). An automaker’s total number of production facilities is influenced by varying economies of scale for final assembly operations and for internal combustion engine production. For ICE vehicle production, automakers have tended to operate around twice as many assembly plants as ICE engine plants, as economies of scale in engine production are substantially larger than in vehicle assembly.23 Furthermore, engine plants and final assembly plants for ICE vehicle production tend to co-locate near each other. The median distance between engine and vehicle assembly plants in North America is 376 miles, well within a one-day driving distance for delivery of engines to final assembly plants (Klier and Rubenstein, 2021a).
The emerging geography of BEV production in North America
Given the importance of agglomeration economics and economies of scale underlying the geography of ICE vehicle production, the question is whether we can expect the same factors to be shaping the expansion of BEV production. According to Sam Fiorani, vice president of AutoForecast Solutions, the answer is yes: “Build where you sell” is a strategy that will become more profitable for EVs in his estimation (Karkaria, 2021). To Automotive News (Karkaria, 2021), Fiorani cited two reasons:
- Given the added cost of shipping heavier BEVs (relative to ICE vehicles), auto manufacturers are already motivated to source them in North America for local final markets.24
- In addition, the fact that a smaller labor force is needed to assemble EVs (than ICE vehicles) provides less incentive to manufacturers to produce them in low-wage areas across the globe.
For ICE vehicles, the “build where you sell” strategy is based on the distribution of population across North America. Auto alley became the dominant region for vehicle production because it is within a one-day drive of a relatively large percentage of the North American population. In other words, the strategy—essentially, the underlying economic principle—behind the formation of auto alley recognizes that the geographic distribution of vehicle manufacturing sites should closely match the geographic distribution of the auto industry’s final markets.
In contrast, BEV sales to date have not been distributed evenly across North America. California, with 12 percent of the U.S. population, accounted for 39 percent of U.S. BEV registrations through 2021, as well as 29 percent of the nation’s total public charging stations and 30 percent of the nation’s total public charging ports as of August 2022.25
Consistent with the state-level data, a study of the 50 most populous U.S. metropolitan areas found that metropolitan areas in California have the highest rates of EV ownership (Bui, Slowik, and Lutsey, 2021, figure 3, p. 10). Furthermore, the California metropolitan areas offer some of the most generous consumer incentives to EV owners, especially access to high-occupancy vehicle (HOV) freeway lanes (Bui, Slowik, and Lutsey, 2021, p. 15). Bui, Slowik, and Lutsey (2021, pp. 14–15) note: “Financial and non-financial incentives support electric vehicle market growth by reducing costs and providing additional convenience. Alternately, policy actions such as fees specific to electric vehicles act as disincentives. ... Overall, … most high-uptake areas have substantial incentives, and low-uptake areas tend to impose fees and have few incentives.”
Given that California accounts for a very high share of the nation’s BEV registrations, the decision by Tesla—the company that currently dominates BEV production and sales in North America (see figure 6)—to open its first large-scale assembly plant in Fremont, California (2,000 miles west of auto alley), is consistent with the economic geography principle to “build where you sell.” Tesla’s second large-scale assembly plant in North America—which started production in 2021 in Austin, Texas—is much closer to auto alley.
Figure 6. Market share of U.S. sales of new battery electric vehicles (BEVs), 2021
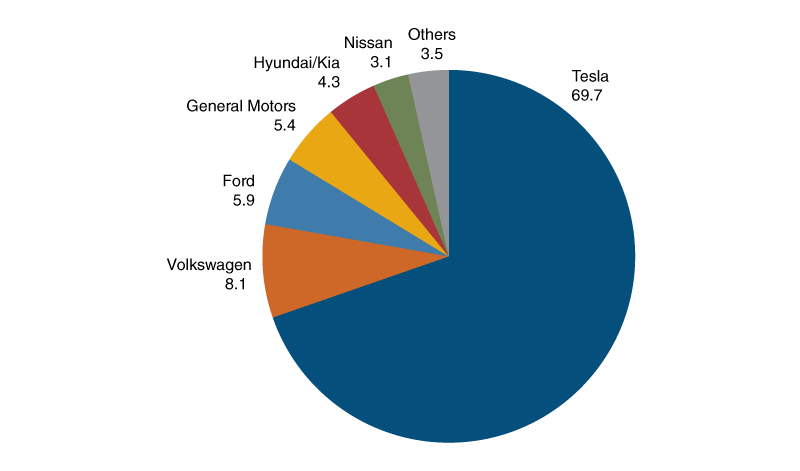
Source: Authors’ calculations based on data from Wards Intelligence.
Tesla also provides evidence that the scale of production of a BEV assembly plant is comparable to that of a traditional ICE vehicle assembly plant. Tesla took over a final assembly plant in Fremont, California, that had previously been operated until 2010 by New United Motor Manufacturing Inc. (NUMMI)—a joint venture owned by GM and Toyota (Hull, 2010). Tesla assembled 439,433 vehicles in the Fremont plant in 2021. By comparison, NUMMI assembled 428,633 vehicles in 2006 and 407,881 in 2007.26
Figure 7 illustrates 42 locations in North America where BEV assembly has commenced or will commence as announced by automakers as of early November 2022.27 Seventy-one percent of these 42 BEV assembly plants will be in the U.S. portion of auto alley, 10 percent in the Canadian portion of auto alley, 14 percent in the United States outside of auto alley, and 5 percent in Mexico. By comparison, 56 percent of the 68 ICE vehicle assembly plants in operation in 2022 are in the U.S. portion of auto alley, 10 percent in the Canadian portion of auto alley, 6 percent in the United States outside of auto alley, and 28 percent in Mexico. Thus, the U.S. and Canadian portions of auto alley are home to about the same shares of BEV assembly plants as their shares of ICE assembly plants; in contrast, Mexico has a smaller share of BEV assembly plants than its share of ICE vehicle assembly plants, while the United States outside of auto alley has a larger share of BEV assembly plants than its share of ICE vehicle assembly plants.28
Figure 7. Locations of battery electric vehicle (BEV) assembly plants and battery pack plants in North America, operating and announced as of November 2022
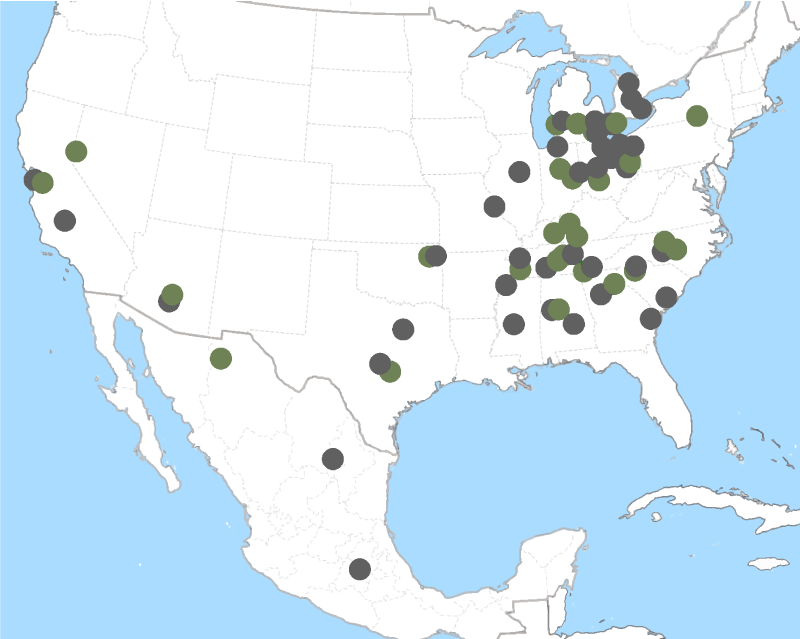
Sources: Authors’ adaptation of data from Wards Intelligence, auto company websites, Plante and Rindels (2022), and Maptitude.
As the battery electric propulsion technology represents a radical departure from ICE-based propulsion, the companies responsible for assembling and marketing the vehicles may change. A BEV-dominated industry footprint will be influenced by location decisions of both new and incumbent automakers.29
Locations chosen by BEV-only producers
The motor vehicle industry had not seen a large-scale ICE auto manufacturer starting from scratch since the 1940s, reflecting the high barriers to entry in this capital-intensive industry. The change in propulsion technology from the internal combustion engine to the electric motor opened the door for newcomers to try to compete in the auto sector. Tesla was the first newcomer, starting production of BEVs in California in 2008.30 Since 2007, 12 companies (including Tesla) have selected locations to produce BEVs in the United States.31 The number of start-ups during the past 15 years reflects a growing sense of the inevitability of shifting toward electrification, as well as the availability of funding for BEV production ventures (see table 1).
Table 1. Start-ups’ battery electric vehicle (BEV) assembly plants in North America, operating and announced as of November 2022
| Automaker | Location | Production start year |
| Tesla | Fremont, California | 2011 |
| Lucid Motors | Casa Grande, Arizona | 2021 |
| Rivian Automotive | Normal, Illinois | 2021 |
| Tesla | Austin, Texas | 2021 |
| Canoo | Bentonville, Arkansas | 2022 |
| Lordstown Motors | Lordstown, Ohio | 2022 |
| Canoo | Pryor, Oklahoma | 2023 |
| Faraday Future | Hanford, California | 2024 |
| Fisker Inc. | Lordstown, Ohio | 2024 |
| Rivian Automotive | Atlanta, Georgia | 2024 |
| VinFast | Sanford, North Carolina | 2024 |
| Workhorse Group | Union City, Indiana | 2024 |
| Bollinger Motors and Mullen Automotive | Oak Park, Michigan | 2025 |
| Mullen Automotive | Tunica, Mississippi | 2025 |
| Mullen Automotive (after acquiring Electric Last Mile Solutions, or ELMS) | Mishawaka, Indiana | TBD |
Sources: Auto company websites.
For a start-up in a very capital-intensive industry, raising sufficient capital is critical to achieve economies of scale in production, as well as to undertake necessary supporting operations such as retail and service. The large number of start-up BEV companies reflects the attraction of alternative fuel vehicles for investors. Most of the start-up companies have attracted significant investment through special purpose acquisition companies (SPACs)—which are companies without commercial operations formed to raise funds through an initial public offering or to buy another company (O’Kane and Welch, 2022).
The ability to develop a vehicle defined by innovative software and connectivity—without the constraints of entrenched ICE vehicle operational and organizational structures—represents a unique business opportunity in the motor vehicle industry (Juliussen, 2022). The process of product development is simplified because a BEV contains fewer parts than an ICE vehicle (Truett, Iliff, and Greimel, 2021).
Most of the start-up BEV producers other than Tesla have located assembly plants in auto alley. Of the 12 assembly plants in the United States where start-up companies other than Tesla have located their production, eight are in the U.S. portion of auto alley: Two are in Indiana, and one each is in Georgia, Illinois, Michigan, Mississippi, North Carolina, and Ohio. The four BEV assembly plants other than Tesla’s two plants outside of auto alley (in California and Texas) are in Arizona, Arkansas, California, and Oklahoma. Table 1 summarizes start-ups’ BEV assembly plants operating and announced as of November 2022.
Some of the start-up BEV automakers have faced obstacles. The Lordstown, Ohio, assembly plant was sold by Lordstown Motors to Foxconn (Rosevear, 2022). In early 2022, Bollinger Motors suspended plans to assemble electric SUVs and pickup trucks in Oak Park, Michigan (Miller, 2022). Electric Last Mile Solutions (ELMS), which planned to make commercial electric vehicles in Mishawaka, Indiana, filed for bankruptcy protection in mid-2022 (O’Kane, 2022). Subsequently, Mullen Automotive acquired a controlling interest (60 percent) in Bollinger Motors in September 2022 and outright acquired bankrupt ELMS, including its Mishawaka plant, the following month (Trop, 2022). Other BEV manufacturers have pushed back delivery dates.
Locations of BEV facilities chosen by ICE vehicle producers
In contrast with Tesla, the legacy automakers are locating BEV assembly operations in auto alley.32 Of the 28 assembly plants announced by incumbent automakers for BEV production as of November 2022, 21 are in the U.S. portion of auto alley, one is elsewhere in the United States, four are in the Canadian portion of auto alley, and two are in Mexico.33 Ten of the 28 are for assembly operations of foreign-headquartered automakers and 18 for the three automakers with a significant Detroit presence (Ford, GM, and Stellantis34).
All but two of the 28 BEV assembly plants announced by legacy automakers are conversions of existing ICE vehicle plants. The two new assembly plants are for Ford in Stanton, Tennessee, and for Hyundai in Ellabell, Georgia. It is therefore not surprising that the locational patterns for legacy manufacturers’ BEV production match the patterns for their existing ICE vehicle production. Accordingly, eight of the ten plants announced for BEV assembly operations by foreign-headquartered producers (excluding Stellantis) are located in the southern half of auto alley (Tennessee, South Carolina, Mississippi, Alabama, and Georgia). Moreover, the three automakers with a significant Detroit presence have selected six sites in Michigan and four sites in nearby Ontario, Canada, for ten of their first 18 BEV assembly operations.
Co-location of battery pack plants and final BEV assembly plants
The location of battery pack plants is important for understanding possible changes in the overall geography of BEV production. Similar to engines in the context of assembling ICE cars, batteries represent a substantial part of the cost of building a vehicle. In addition, because of their large weight, battery packs tend to be produced near where vehicles are assembled.
The battery pack of a BEV represents around 30 percent of the cost of a BEV (authors’ calculations based on data from Lutsey and Nicholas, 2019, table 3, p. 5).35 We discuss the costs involved in producing a battery pack for a BEV before delving more deeply into the economic geography of existing and planned battery pack plants in relation to the locations of final assembly plants for BEVs.
Battery production for BEVs involves three main stages of manufacturing: cell, module, and pack. An individual cell is a little larger than an AA battery (Horowitz, Coffin, and Taylor, 2021, pp. 5–6). A module contains several cells, with the number varying by individual manufacturer and automaker. Similarly, a pack contains a number of modules, which also vary by individual manufacturer and automaker.
Around 75 percent of the total cost of a finished lithium-ion battery pack comes from the cell stage of production, around 11 percent from the module stage, and 14 percent from the pack stage (Coffin and Horowitz, 2018, pp. 8–9). BloombergNEF (2021) does not include the module stage in its 2021 cost estimate of battery production, which states the cell stage accounts for 82 percent of the battery cost, implying the pack stage accounts for 18 percent.
A lithium-ion battery cell comprises four major parts: a cathode, an anode, an electrolyte, and a separator (Coffin and Horowitz, 2018, pp. 6–7). The cathode and anode are connected electrically by a liquid electrolyte and physically kept apart by a separator. A battery’s discharge results from the diffusion of a substance from the anode to the cathode through the liquid electrolyte. The cathode accounts for 51 percent of the cost of a battery cell, the anode 12 percent, the electrolyte 4 percent, the separator 7 percent, and the housing 3 percent; manufacturing (including assembly) and depreciation of manufacturing equipment account for the rest of the battery cell cost (Bhutada, 2022).
The anode is currently most frequently made of graphite. The electrolyte normally consists of organic carbonate solvents with dissolved lithium salts—often lithium hexafluorophosphate, or LiPF6. Hence, “lithium ion” has become the common name for the BEV battery. The separator is a thin permeable polymer membrane that physically separates the anode and cathode while allowing the transport of ions from the former to the latter via the electrolyte. In contrast to anodes and electrolytes, cathodes are currently being made from a variety of materials, depending on the company; cobalt, manganese, and nickel are especially important materials that make up cathodes (Coffin and Horowitz, 2018, pp. 6–7).
The three main stages in battery production can be located together or separately. The module is typically manufactured at either the cell plant or the pack plant. In order to reduce costs, automakers are developing a “cell-to-pack” design, which removes modules from the battery manufacturing process (Gibbs, 2021). Also in development are “cell-to-chassis” batteries, which are batteries that would be directly integrated into the vehicle frame (Kane, 2020).
In the early years of BEV production, most automakers obtained entire batteries from independent suppliers. However, noting that the relationship between automakers and cell suppliers is changing, Gibbs (2021) states that “rather than inking supply deals with Tier 1s such as LG Chem or Samsung, automakers are entering into partnerships.” As Jakob Fleischmann, associate partner at McKinsey & Co., remarked in an interview for Automotive News: “Cell production is further away from automakers’ traditional strategies, but that is where the value sits, so they want to get involved” (Gibbs, 2021).
Automakers consider gasoline engines to be a core competency, so they typically build their own in house, even if they outsource individual engine components to independent suppliers. Similarly, IHS Markit forecasts that around 70 percent of BEV motors will be made in house by 2030, compared with 33 percent in 2021; furthermore, increased vertical integration of the BEV supply chain, including batteries being produced by the automakers themselves, is expected (Gibbs, 2021).
Battery pack production is strongly co-located with final assembly plants (see figure 7). Packs are typically assembled near final assembly locations because they are very bulky, heavy, and fragile; and shipping them long distances is expensive. As Michael Robinet, executive director of IHS Markit, pointed out for an Automotive News story, a BEV assembly plant close by battery cell factories or EV systems suppliers might be prioritized over another one that’s farther away (Karkaria, 2021).
The annual output of a production line at a battery pack plant is roughly equivalent to the annual output of a production line at an internal combustion engine plant. The battery capacity of a typical BEV available in the U.S. market is currently around 79 kWh, and the mean annual output of the battery pack plants in North America is approximately 43 gigawatt hours (GWh); thus, the average line at a battery plant would in theory be able to supply around 540,000 BEVs per year.36
As of 2021, the United States had only three plants making battery packs for light vehicles: LG Chem’s plant, which opened in 2011 in Holland, Michigan, to supply GM; Envision AESC’s (Envision Automotive Energy Supply Corporation) plant, which opened in 2012 in Smyrna, Tennessee, to supply Nissan; and Panasonic’s plant, which opened in Sparks, Nevada, in 2016, to supply primarily Tesla (see table 2). For 2022, Tesla and its battery supplier Panasonic are projected to be responsible for producing about three-fourths of the battery packs in the United States, as measured by GWh (authors’ calculations based on data from Yu and Sumangil, 2021).
Table 2. Battery pack plants in North America, operating and announced as of November 2022
| Battery company | Location | Automaker customer | Production start year |
| CATL | Ciudad Juárez, Chihuahua, Mexico | Ford, Tesla | TBD |
| Envision AESC | Bowling Green, Kentucky | Mercedes | 2025 |
| Envision AESC | Smyrna, Tennessee | Nissan | 2012 |
| Envision AESC | Woodruff, South Carolina | BMW | TBD |
| iM3NY | Endicott, New York | TBD | 2022 |
| LG Chem | Queen Creek, Arizona | TBD | 2024 |
| LG Chem | New Castle, Indiana | GM | TBD |
| LG Chem | Lansing, Michigan | GM | 2024 |
| LG Chem | Holland, Michigan | GM | 2011 |
| LG Chem | Lordstown, Ohio | GM | 2022 |
| LG Chem | Jeffersonville, Ohio | Honda | 2025 |
| LG Chem | Windsor, Ontario, Canada | Stellantis | 2024 |
| LG Chem | Spring Hill, Tennessee | GM | 2023 |
| Mercedes | Woodstock, Alabama | Mercedes | TBD |
| Microvast | Clarksville, Tennessee | TBD | 2022 |
| ONE | Van Buren Township, Michigan | TBD | 2024 |
| Panasonic | De Soto, Kansas | Tesla | 2025 |
| Panasonic | Sparks, Nevada | Tesla, others | 2016 |
| Panasonic | TBD, Oklahoma | Tesla | TBD |
| Samsung | Kokomo, Indiana | Stellantis | 2025 |
| SKI | Commerce, Georgia | Ford, VW | 2022 |
| SKI | Glendale, Kentucky | Ford | 2025 |
| SKI | Glendale, Kentucky | Ford | 2026 |
| SKI | Stanton, Tennessee | Ford | 2025 |
| Tesla | Fremont, California | Tesla | 2022 |
| Tesla | Austin, Texas | Tesla | TBD |
| Tsusho | Liberty, North Carolina | Toyota | 2025 |
| VinFast | Sanford, North Carolina | VinFast | 2023 |
| VW | Chattanooga, Tennessee | VW | 2022 |
Sources: Battery company websites and Plante and Rindels (2022).
Panasonic’s battery plant in Sparks, Nevada, is located 260 miles (by driving distance) from Tesla’s BEV assembly plant in Fremont, California. The distance between the two plants is less than the median distance between internal combustion engine plants and ICE vehicle assembly plants in North America, which is 376 miles (Klier and Rubenstein, 2021a). The Panasonic and Tesla plants are well connected via Interstates 80 and 680.
By our count in November 2022, the number of U.S. battery pack plants is expected to increase from three in 2021 to 29 over the next few years. Of the 26 new plants, seven will be built by LG Chem; four by SK Innovation (SKI); two each by Envision AESC, Tesla, and Panasonic; and one each by CATL (Contemporary Amperex Technology Co., Limited), Samsung, Tsusho, Volkswagen (VW), Mercedes, ONE (Our Next Energy), Microvast, iM3NY, and VinFast. Of the 26 plants opening in 2022 and beyond, four will exclusively supply Tesla and another four, GM; three will exclusively supply Ford; two will exclusively supply Stellantis and another two, Mercedes; and one each will exclusively supply Toyota, VinFast, Honda, BMW, and VW; and the remaining six either will supply more than one automaker or have not announced specific supply relations yet. With most final assembly plants located in auto alley, the majority of battery pack plants are also being built in auto alley. After having started with final assembly and battery pack operations in the West, Tesla—the most prominent exception—has moved closer to auto alley by locating its second production complex (involving both battery production and final assembly at distinct but connected sites) in and near Texas (see figure 7, table 1, and table 2).
The United States currently has production facilities that provide some of the cell components. For example, at the Nevada battery plant, Panasonic manufactures and supplies battery cells to Tesla, which then produces its own battery packs there. Meanwhile, Panasonic also assembles battery packs at the Nevada plant for other automakers (Zhou et al., 2021, p. 7).
Discussion
The electrification of the motor vehicle industry represents a massive transformation that affects many aspects of the auto industry. A large degree of uncertainty is associated with how this transformation will unfold—including the growth of BEV sales, timing of BEV production facility openings and conversions (from ICE vehicle production), the development of specific technologies, and individual companies’ strategies, as well as the evolution of the regulatory framework. In this article, we ask the question of how one can conceptualize the forces shaping the geography of BEV production in North America.
One of the prevailing economic geography principles underlying the location decisions of automotive factories is to be closer to final customers. ICE vehicle final assembly plants in the United States have clustered in auto alley to minimize the aggregate cost of shipping finished vehicles to dealerships that ultimately sell them to consumers in markets across North America. Similarly, plants producing gasoline engines have been located in auto alley to be near their customers—namely, automakers’ final assembly plants for ICE vehicles.
Locating near customers is similarly important for final assembly plants for BEVs, as well as for battery pack plants. In the early years of BEV sales, consumers have been heavily concentrated in California, and the dominant BEV automaker—Tesla—located its first large-scale assembly plant in Northern California.
The extent to which BEV production in North America ultimately follows ICE vehicle production into auto alley or disperses to nontraditional locations depends principally on the distribution of the BEV market. For example, if California continues to account for a disproportionate share of U.S. sales of BEVs, locating production facilities in or near that state, rather than in auto alley, would be consistent with the auto industry’s prevailing economic geography principles of agglomeration economics and economies of scale.
While the ultimate distribution of final assembly plants for BEVs is unknown at this time, the early indications are that battery pack plants are highly likely to co-locate with these final assembly plants (see figure 7). The battery pack is bulky and challenging to ship long distances, and it accounts for around one-third of the vehicle cost. Thus, Tesla’s battery supplier Panasonic has located its first battery pack plant in Nevada, near Tesla’s first large-scale final assembly plant, while other automakers and suppliers are locating battery pack plants in auto alley near the final assembly plants.
We also showed that during the industry’s transition, the majority of incumbent producers’ plants assembling BEVs are facilities that have been converted from producing ICE vehicles. In contrast, battery pack plants typically are newly constructed greenfield plants. In conclusion, it seems that despite all the disruptions that accompany the automotive industry’s transition toward electrification, its production footprint across North America is expected to remain largely unaffected.
Notes
1 For a big picture discussion of the auto industry’s transformation toward electrification, see Klier and Rubenstein (2021b).
2 We discuss in greater detail PHEVs and other types of electric vehicles later in the article. Notably, some data sources combine BEVs and PHEVs into a single category called plug-in electric vehicles (PEVs).
3 Authors’ calculations based on 2017 cost data from Lutsey and Nicholas (2019, table 3, p. 5).
4 Some premium BEVs have more than one motor.
5 These and other details on BEVs—and other types of electric vehicles—from the U.S. Department of Energy’s Alternative Fuels Data Center (AFDC) are available online.
6 Note that horsepower = torque (measured in pound-feet) × RPM/5,252.
7 See the U.S. Department of Energy’s AFDC webpage on FCEVs.
8 The Biden administration’s 2030 EV goal comprises sales of new BEVs, PHEVs, and FCEVs. Notably, only 3,341 FCEVs were sold in the United States in 2021 (Kane, 2022).
9 By way of comparison, in 2021, the average share of BEVs among new car registrations in European Union (EU) countries was 10 percent (Mock et al., 2022, table 5, p. 3).
10 For a broader discussion on these and related policies and the economics of electric vehicles, see Rapson and Muehlegger (2022).
11 The average BEV’s kWh per mile value is from Eco Cost Savings, available online. The 98 MPGe value is from authors’ calculations based on data from this Eco Cost Savings webpage and Ganz (2022).
12 A brief history of CARB is available online.
13 Details on CARB’s ZEV program are available online.
14 For further details on the new $7,500 EV tax credit from the Inflation Reduction Act, see this AFDC webpage.
15 Further details on the previous $7,500 EV tax credit are available on this Internal Revenue Service (IRS) webpage.
16 As of September 2021, 24 countries had banned the sale of ICE vehicles by some future date (as noted in parentheses): Austria (2027), Belgium (2026), Canada (2035), Cape Verde (2035), China (2040), Costa Rica (2050), Denmark (2030), Egypt (2040), France (2040), Iceland (2030), India (2030), Ireland (2030), Israel (2030), Japan (2035), Netherlands (2030), Norway (2025), Singapore (2040), Slovenia (2030), South Korea (2025), Spain (2040), Sri Lanka (2040), Sweden (2030), Taiwan (2040), and the United Kingdom (2035, 2032 in Scotland) (Pressman, 2021).
17 Alternative fueling station and port counts, by state, are frequently updated and posted by the U.S. Department of Energy’s Alternative Fuels Data Center; these data, which we accessed on November 26, 2022, are available online.
18 The public charging port percentages by level are from authors’ calculations based on data from the U.S. Department of Energy’s Alternative Fuels Data Center, available online, accessed on November 26, 2022. The data on the driving range per given minutes of charge, as well as the volts at which the level of charging port operates, are from Brown, Schayowitz, and White (2022, p. 4). See Charluet and van Barlingen (2021) for an explanation of AC versus DC power in relation to charging EVs. For more details on EV charging infrastructure, see this AFDC webpage. In 2021, J.D. Power’s survey of 6,647 owners of BEVs and PHEVs measured satisfaction with charging stations; the survey found that 13 percent of respondents were unsuccessful when they tried to charge—and two of the most common reasons for lack of success were out-of-service chargers (for 58 percent of these respondents) and too long of a wait (for 14 percent) (Ulitskaya, 2021).
19 The 17 percent difference (which we calculated) represents the three hours of extra time needed to charge during the 18 hours total it took the Tesla Model Y and Model 3 to complete the 1,000-mile BEV race described in Tingwall (2021).
20 Moreover, Brown, Schayowitz, and White (2022) note the following: “The Joseph R. Biden administration has established a goal of building a national public charging network of 500,000 EVSE [electric vehicle supply equipment] ports by 2030. To meet this goal by 2030, approximately 12,048 public EVSE port installations will be required each quarter for the next 9 years, requiring a significant increase from the 5,077 public EVSE ports that have been installed each quarter, on average, since the start of 2020.”
21 The average costs for DC fast chargers in California range from $27,000 to $45,000 for the equipment and from $77,000 to $91,000 for the installation (and other project-related items), according to California Energy Commission analysis, accessed on October 27, 2022.
22 Adapters manufactured by numerous companies permit Tesla vehicles to be charged on other networks.
23 For example, average production in North America in 2016 was 281,000 in final assembly plants and 421,000 in engine plants (Klier and Rubenstein, 2022).
24 BEVs are heavier than comparable ICE vehicles (VanderWerp, 2021).
25 Authors’ calculations based on data from the U.S. Census Bureau, QuickFacts: California; United States, available online; and U.S. Department of Energy, Office of Energy Efficiency & Renewable Energy, Alternative Fuels Data Center, Electric Vehicle Registrations by State, available online, and Alternative Fueling Station Counts by State, available online—all accessed on August 7, 2022.
26 The production values cited in this paragraph are from Wards Intelligence.
27 Unlike figure 5, the dots in figure 7 are not scaled by output. Tesla’s California assembly plant is the only one that is assembling BEVs at or near planned capacity as of 2022.
28 All the shares of BEV and ICE vehicle assembly plants in the different regions noted in this paragraph are from authors’ calculations based on data from Wards Intelligence and auto company websites.
29 When it comes to a new vehicle assembly plant, location incentives can affect the specific community chosen to site the production facility, but they generally don’t alter the underlying rationale for choosing a region of the country, such as auto alley.
30 An incumbent automaker, General Motors, produced a BEV called the EV1 between 1996 and 1999 (Abuelsamid, 2021). Tesla started producing its first BEV, the Roadster, in Menlo Park, California, in 2008; it stopped making this model in late 2011 (Morris, 2021; and Oreizi, 2021).
31 Two start-ups—Bollinger Motors and Electric Last Mile Solutions—suspended production plans in 2022. See the final paragraph of this subsection on the final assembly locations chosen by BEV-only producers for further details.
32 The analysis of the BEV assembly plants of legacy automakers in this and the next paragraph are based on data from Wards Intelligence and auto company websites.
33 Note that as of the writing of this article, not all of the incumbent producers’ BEV assembly plants produce exclusively BEVs.
34 Stellantis is headquartered in the Netherlands, and is the result of multiple mergers, one of which involved Detroit automaker Chrysler. So, while foreign-headquartered, Stellantis still carries on Chrysler’s legacy in the Detroit area.
35 The entire electric powertrain—which comprises the battery pack and a number of other components—represents 39 percent of the BEV cost, as we noted earlier in this article.
36 Note that 1 GWh = 1,000,000 kWh. The battery capacity of a typical BEV (that is, the average BEV battery capacity) in the U.S. market is determined from authors’ calculations based on Electric Vehicle Database battery capacity data and fueleconomy.gov data on BEVs available in the U.S. market. The average annual output of battery pack plants is from authors’ calculations based on information from company announcements regarding currently operating as well as planned battery pack plants in North America. We derive the yearly battery supply per plant value (approximately 540,000 units) by dividing the average annual plant output (43 GWh) by the battery capacity of a typical BEV (79 kWh).
References
Abuelsamid, Sam, 2021, “GM rolls out new logo for electric vehicle push,” Forbes, January 8, available online.
Adams, Eric, 2019, “Why the Porsche Taycan’s two-speed gearbox is such a big deal,” Wired, September 5, available online.
Baldwin, Roberto, 2021, “Startup Ample is working on 10-minute battery swapping for electric vehicles,”Car and Driver, March 5, available online.
Beitsch, Rebecca, 2020, “Trump administration rolls back Obama-era fuel efficiency standards,” Hill, March 31, available online.
Bhutada, Govind, 2022, “Breaking down the cost of an EV battery cell,” VC Elements, February 22, available online.
BloombergNEF, 2021, “Battery pack prices fall to an average of $132/kWh, but rising commodity prices start to bite,” blog post, November 30, available online.
Brown, Abby, Alexis Schayowitz, and Emily White, 2022, “Electric vehicle charging infrastructure trends from the Alternative Fueling Station Locator: Fourth quarter 2021,” National Renewable Energy Laboratory, technical report, No. NREL/TP-5400-82298, May, available online.
Bui, Anh, Peter Slowik, and Nic Lutsey, 2021, “Evaluating electric vehicle market growth across U.S. cities,” International Council on Clean Transportation (ICCT), briefing, September, available online.
California Air Resources Board, 2022, “States that have adopted California’s vehicle standards under Section 177 of the federal Clean Air Act,” Sacramento, CA, May 13, available online, accessed on October 25, 2022.
Cedillo-Campos, Miguel Gaston, Juan Sanchez-Garza, and Cuauhtemoc Sanchez Ramirez, 2006, “The new relational schemas of inter-firms cooperation: The case of the Coahuila automobile cluster in Mexico,” International Journal of Automotive Technology and Management, Vol. 6, No. 4, pp. 406–418. Crossref
Charluet, Camille, and Wesley van Barlingen, 2021, “How long does it take to charge an electric car with Level 3 charging?,” EVBox Blog, September 6, available online.
Chokshi, Niraj, Matthew Goldstein, and Erin Woo, 2021, “Biden’s electric car plans hinge on having enough chargers,” New York Times, September 7, available online.
Coffin, David, and Jeff Horowitz, 2018, “The supply chain for electric vehicle batteries,” Journal of International Commerce and Economics, United States International Trade Commission, December, available online.
Cox Automotive, 2021, “As more Americans choose EVs, price and range continue to hold back the market, according to new Cox Automotive study,” press release, Atlanta, November 16, available online.
Diaz, Melissa N., 2020, “Electric vehicles: A primer on technology and selected policy issues,” CRS Report for Congress, Congressional Research Service, No. R46231, February 14, available online.
Dow, Jameson, 2021, “Washington State bans gas cars by 2030—The earliest in the US,” Electrek, April 15, available online.
Ellison, Glenn, and Edward L. Glaeser, 1997, “Geographic concentration in U.S. manufacturing industries: A dartboard approach,” Journal of Political Economy, Vol. 105, No. 5, October, pp. 889–927. Crossref
Ewing, Jack, 2022, “The Biden administration outlines a plan to build a network of electric vehicle chargers,” New York Times, February 10, available online.
Fernie, Michael, 2016, “How do electric vehicles produce instant torque?,” Car Throttle, available online.
Flink, James J., 1990, The Automobile Age, Cambridge, MA: MIT Press.
Ganz, Andrew, 2022, “What is MPGe? Everything you need to know,” Kelley Blue Book, October 11, available online.
Ghamami, Mehrnaz, Ali Zockaie, Steven Miller, Mohammadreza Kavianipour, Fatemeh Fakhrmoosavi, Harprinderjot Singh, Farish Jazlan, and MohammadHossein Shojaei, 2020, “Electric vehicle charger placement optimization in Michigan: Phase II—Urban,” report prepared for the Michigan Department of Environment, Great Lakes, and Energy (EGLE) by Michigan State University, March 7, available online.
Ghamami, Mehrnaz, Ali Zockaie, Joy Wang, Steven Miller, Mohammadreza Kavianipour, MohammadHossein (Sam) Shojaei, Fatemeh Fakhrmoosavi, Laura Hohnstadt, and Harprinderjot Singh, 2019, “Electric vehicle charger placement optimization in Michigan: Phase I—Highways,” report prepared for the Michigan Energy Office by Michigan State University, February 13, available online.
Gibbs, Nick, 2021, “VW, Stellantis, Renault enter new battlefields in EV race,” Automotive News, September 5, available online by subscription.
Gregory, Derek, Ron Johnston, Geraldine Pratt, Michael J. Watts, and Sarah Whatmore (eds.), 2009, The Dictionary of Human Geography, 5th ed., Chichester, UK: Wiley-Blackwell.
Horowitz, Jeff, David Coffin, and Brennan Taylor, 2021, “Supply chain for EV batteries: 2020 trade and value-added update,” United States International Trade Commission, Office of Industries, working paper, No. ID-072, January, available online.
Hull, Dana, 2010, “2010: Tesla gets ready to take over the former NUMMI auto plant in Fremont,” Mercury News, September 16, available online.
Igleheart, Austin, 2022, “Special fees on plug-in hybrid and electric vehicles,” National Conference of State Legislatures, brief, July 26, available online.
Iliff, Laurence, 2021, “Hyundai’s feat: Speedier battery charging,” Automotive News, July 31, available online by subscription.
International Council on Clean Transportation, 2022, “U.S. states with ZEV and clean car standards,” infographic, Washington, DC, February 2, available online.
Irle, Roland, 2022, “Global EV sales for 2021,” EV-volumes.com, available online, accessed on November 25, 2022.
Irwin, John, 2022, “In the big shift to EVs, supplier forecasts differ,” Automotive News, January 10, available online by subscription.
J.D. Power, 2021a, “Level up: Electric vehicle owners with permanently installed Level 2 chargers reap benefits from their investment, J.D. Power finds,” press release, Troy, MI, February 3, available online.
J.D. Power, 2021b, “Majority of electric vehicle owners are intent on purchasing another one in the future, J.D. Power finds,” press release, Troy, MI, January 21, available online.
Jones, Jonathan Spencer, 2021, “National electric highway coalition forms in US,” Smart Energy International, December 13, available online.
Jones, Peter, 2022, “What states are banning gas cars? (timeline & facts),” Motor and Wheels, August 15, available online.
Juliussen, Egil, 2022, “Entering the software-defined vehicle era,” EE Times, March 21, available online.
Kane, Mark, 2022, “US: Hydrogen fuel cell car sales rebounded in 2021,” InsideEVs, February 5, available online.
Kane, Mark, 2020, “CATL hints at cell-to-chassis EV batteries for 500+ miles of range,” InsideEVs, August 13, available online.
Karkaria, Urvaksh, 2021, “EVs change the rulebook on where to build product,” Automotive News, June 21, available online by subscription.
Keith, David R., Jeroen J. R. Struben, and Sergey Naumov, 2020, “The diffusion of alternative fuel vehicles: A generalised model and future research agenda,” Journal of Simulation, Vol. 14, No. 4, pp. 260–277. Crossref
Klier, Thomas H., and Joshua Linn, 2011, “Corporate average fuel economy standards and the market for new vehicles,” Annual Review of Resource Economics, Vol. 3, October, pp. 445–462. Crossref
Klier, Thomas H., and James M. Rubenstein, 2022, “Trade agreements and the geography of motor vehicle production in North America and Europe,” International Journal of Automotive Technology and Management, Vol. 22, No. 1, pp. 4–28. Crossref
Klier, Thomas H., and James M. Rubenstein, 2021a, “ICE age geography: Powertrain sourcing in Europe and North America,” International Journal of Automotive Technology and Management, Vol. 21, No. 4, pp. 322–342. Crossref
Klier, Thomas H., and James M. Rubenstein, 2021b, “Charging ahead—The electrification of the auto industry,” Chicago Fed Insights, Federal Reserve Bank of Chicago, blog, June 23, available online.
Klier, Thomas H., and James M. Rubenstein, 2017, “Mexico’s growing role in the auto industry under NAFTA: Who makes what and what goes where,” Economic Perspectives, Federal Reserve Bank of Chicago, Vol. 41, No. 6, available online.
Klier, Thomas H., and James M. Rubenstein, 2015, “Auto production footprints: Comparing Europe and North America,” Economic Perspectives, Federal Reserve Bank of Chicago, Vol. 39, Fourth Quarter, pp. 101–119, available online.
Lattanzio, Richard K., 2022, “Clean Air Act: A summary of the act and its major requirements,” CRS Report for Congress, Congressional Research Service, No. RL30853, updated September 13, available online.
Lienert, Paul, 2021, “Electric vehicle battery startup Ample raises $160 million,” Reuters, August 19, available online.
Lode, Sarah L., and Daniel J. Deeb, 2022, “Biden administration adopts new vehicle fuel economy standards,” ArentFox Schiff, April 6, available online.
Lung, Yannick, 2004, “The changing geography of the European automobile system,” International Journal of Automotive Technology and Management, Vol. 4, Nos. 2–3, pp. 137–165. Crossref
Lutsey, Nic, and Michael Nicholas, 2019, “Update on electric vehicle costs in the United States through 2030,” International Council on Clean Transportation (ICCT), working paper, No. 2019-06, April 2, available online.
McAllister, Levi, and Maggie E. Curran, 2022, “DOT proposes first-ever mandatory standards for publicly available EV infrastructure,” Power & Pipes, Morgan Lewis, blog, June 10, available online.
Miller, Caleb, 2022, “Bollinger suspends plans for electric B1 SUV and B2 pickup,” Car and Driver, January 14, available online.
Mock, Peter, Uwe Tietge, Sandra Wappelhorst, Georg Bieker, Jan Dornoff, Marie Rajon Bernard, and Michelle Monteforte, 2022, “Market monitor: European passenger car and light commercial vehicle registrations, January–March 2022,” International Council on Clean Transportation (ICCT), fact sheet, May 13, available online.
Morris, Charles, 2021, “Early Tesla Roadsters climbing in value,” EVANNEX, blog post, February 5, available online.
O’Kane, Sean, 2022, “EV-truck startup Electric Last Mile says it plans to liquidate,” Bloomberg, updated June 13, available online.
O’Kane, Sean, and David Welch, 2022, “After SPAC mania, electric-vehicle startups face a cash squeeze,” Bloomberg, May 15, available online.
Oreizi, Darya, 2021, “Tesla factory history: Where are they located,” Charged Future, blog post, January 18, available online.
Orvis, Robbie, 2022, “Most electric vehicles are cheaper to own off the lot than gas cars,” Energy Innovation Policy & Technology LLC, report, May, available online.
Plante, Michael D., and Jessica Rindels, 2022, “Automakers’ bold plans for electric vehicles spur U.S. battery boom,” Dallas Fed Economics, Federal Reserve Bank of Dallas, blog, October 11, available online.
Plumer, Brad, Nadja Popovich, and Blacki Migliozzi, 2021, “Electric cars are coming. How long until they rule the road?,” New York Times, March 10, available online.
Pournazeri, Sam, 2022, “How much does electric vehicle charging infrastructure actually cost?,” Insights/Transportation, ICF, article, January 25, available online.
Pressman, Matt, 2021, “Over 25 countries and US states are planning to ban gasoline powered cars,” EVANNEX, blog post, September 22, available online.
Rapson, David S., and Erich Muehlegger, 2022, “The economics of electric vehicles,” National Bureau of Economic Research, working paper, No. 29093, revised July 2022 (originally issued July 2021). Crossref
Robinet, Michael, 2022, presentation at the 28th Annual Automotive Insights Symposium, Federal Reserve Bank of Chicago, January 12, available online.
Rosevear, John, 2022, “Lordstown Motors closes $230 million deal to sell its Ohio factory to Foxconn, injecting needed cash days before deadline,” CNBC, May 11, available online.
Rubenstein, James M., 1992, The Changing US Auto Industry: A Geographical Analysis, London and New York: Routledge.
Shepardson, David, and Jeff Mason, 2021, “Biden seeks to make half of new U.S. auto fleet electric by 2030,” Reuters, August 5, available online.
Sherman, Don, 2016, “Horsepower vs. torque: What’s the difference?,” Car and Driver, April 15, available online.
Sissine, Fred, 2007, “Energy Independence and Security Act of 2007: A summary of major provisions,” CRS Report for Congress, Congressional Research Service, No. RL34294, December 21, available online.
Sorokanich, Bob, 2017, “Why don’t electric cars have multi-gear transmissions?,” Road & Track, August 16, available online.
Stock Dividend Screener, 2022, “Tesla regulatory credits revenue boosts profits and margins,” Stock Dividend Screener, updated August 26, available online.
Tingwall, Eric, 2021, “The EV 1000: 11 EVs face off in a long-distance race,” Car and Driver, July 7, available online.
Trop, Jaclyn, 2022, “Mullen Automotive acquires bankrupt ELMS for $240 million,” TechCrunch, October 19, available online.
Truett, Lila J., and Dale B. Truett, 2003, “The Italian automotive industry and economies of scale,” Contemporary Economic Policy, Vol. 21, No. 3, July, pp. 329–337. Crossref
Truett, Lila J., and Dale B. Truett, 2001, “The Spanish automotive industry: Scale economies and input relationships,” Applied Economics, Vol. 33, No. 12, pp. 1503–1513. Crossref
Truett, Lila J., and Dale B. Truett, 1996, “Economies of scale in the Mexican automotive sector,” Journal of Productivity Analysis, Vol. 7, No. 4, October, pp. 429–446. Crossref
Truett, Richard, Laurence Iliff, and Hans Greimel, 2021, “Big money is suddenly lifting startup hopes,” Automotive News, August 13, available online by subscription.
Ulitskaya, Jane, 2021, “EV owners frustrated by public charging, says J.D. Power study,” Cars.com, August 18, available online.
Union of Concerned Scientists, 2019, “What is ZEV?,” explainer, Cambridge, MA, updated September 12, 2019 (originally published on August 7, 2012), available online.
Union of Concerned Scientists, 2018, “How do battery electric cars work?,” explainer, Cambridge, MA, updated March 12, 2018 (originally published on February 25, 2015), available online.
U.S. Department of Transportation, Federal Highway Administration, 2022, “Biden-Harris administration announces all 50 states, DC and Puerto Rico have submitted plans for national electric vehicle charging network,” press release, Washington, DC, August 2, available online.
U.S. Department of Transportation, National Highway Traffic Safety Administration, 2014, “Summary of fuel economy performance (public version),” report, Washington, DC, December 15, available online.
U.S. Environmental Protection Agency, 2021, The 2021 EPA Automotive Trends Report: Greenhouse Gas Emissions, Fuel Economy, and Technology since 1975, No. EPA-420-R-21-023, Washington, DC, November, available online.
VanderWerp, Dave, 2021, “How EVs compare to gas-powered vehicles in seven performance metrics,” Car and Driver, May 15, available online.
Wardlaw, Christian, 2020, “What is range anxiety with electric vehicles?,” J.D. Power, November 3, available online.
Weber, Alfred, 1929, Alfred Weber’s Theory of the Location of Industries, Carl Joachim Friedrich (trans. and ed.), Chicago: University of Chicago Press.
White House, 2021, “FACT SHEET: President Biden announces steps to drive American leadership for- ward on clean cars and trucks,” press release, Washington, DC, August 5, available online.
White House, Office of the Press Secretary, 2012, “Obama administration finalizes historic 54.5 mpg fuel efficiency standards,” press release, Washington, DC, August 28, available online.
Wynn-Williams, Michael S., 2009, “Economies of scale in the automobile industry,” in Surfing the Global Tide: Automotive Giants and How to Survive Them, Basingstoke, UK, and New York: Palgrave Macmillan, pp. 41–71.
Yu, Alice, and Mitzi Sumangil, 2021, “Top electric vehicle markets dominate lithium-ion battery capacity growth,” Market Intelligence Blog, S&P Global Market Intelligence, February 16, available online.
Zhou, Yan, David Gohlke, Luke Rush, Jarod Kelly, and Qiang Dai, 2021, “Lithium-ion battery supply chain for E-drive vehicles in the United States: 2010–2020,” Argonne National Laboratory, Energy Systems Division, report, No. ANL/ESD-21/3, March, available online.
Zpryme, 2021, “U.S. electric vehicle sales and charging station trends,” report, Austin, TX, May 21, available online.


