Charging Ahead: The Role of Used BEVs in the Broader Shift to Zero-Emissions Vehicles
Electric vehicles are receiving lots of attention these days as public policy measures are increasingly encouraging their use. For instance, the White House recently announced a new target of half of all new vehicles sold in the U.S. being zero-emissions vehicles by 2030—which would be supported with fuel efficiency and emissions regulations and investments in charging infrastructure by the federal government. Automakers have been responding to such public policy measures by investing heavily in electric vehicle technology.
This blog post focuses on battery electric vehicles, or BEVs. As the focus on the transition to BEVs has sharpened of late in the U.S., there’s been increasing concern that owning a BEV may not be realistic for many Americans. It is possible that the overall accessibility of BEVs could depend a lot on the used vehicle market. What do we know about sales of new and used BEVs to date? And what role does the market for used BEVs play in the overall transition toward BEVs? We present and analyze some recent sales and registration data on new and used BEVs across the U.S. to address these two key questions.
Sales of new BEV models
Sales of new BEVs have been rising noticeably in recent years. However, the yearly increases come off a very low base. In 2021 so far (through July), BEVs represent only 2.4% of all new light vehicle sales; moreover, all electric vehicles (which include hybrids and plug-in hybrids) make up 8.4% of total new light vehicle sales, according to our calculations using data from WardsAuto InfoBank. There are now 21 different battery electric vehicle models sold in the U.S. (some of them are only available as BEVs, with no hybrid or internal combustion engine, or ICE, variants). Many more are on the way, including the first-ever electric full-size pickup trucks and vans. To date, sales of BEVs have been heavily skewed toward cars (especially luxury cars) and cross-utility vehicles. Table 1 shows the six top-selling BEV models in the U.S. new light vehicle market for the first seven months of 2021.
Table 1. Best-selling BEV models, 2021
| Brand | Series | Segment group | 2021 sales (through end of July) |
Percent of BEV sales |
|---|---|---|---|---|
| Tesla | Model Y | Cross utility | 86,108 | 37.6 |
| Tesla | Model 3 | Luxury car | 50,882 | 22.2 |
| Chevrolet | Bolt | Cross utility | 18,805 | 8.2 |
| Ford | Mustang Mach-E | Cross utility | 15,829 | 6.9 |
| Nissan | LEAF | Middle car | 8,880 | 3.9 |
| Audi | e-tron | Cross utility | 8,530 | 3.7 |
Source: Authors’ calculations based on data from WardsAuto InfoBank.
Used BEV registrations
To analyze the markets for new and used BEVs, we use data from the AutoCount vehicle registrations database. The database contains a record of each and every vehicle registered in the U.S. through May 2021. It includes geographic information about the owner of the vehicle and the dealer where it was purchased, as well as whether it was bought new or used and its odometer reading at the time of purchase. BEV registrations start appearing in the database in December 2010. We limit the sample to include only those vehicle models that are available exclusively as BEVs. There are currently 11 such BEV models. We exclude models that are also available as hybrids or ICE vehicles, as the registration data do not distinguish between those variants and the BEV variant for a given vehicle model. To identify which models are BEV only, we use sales data from WardsAuto InfoBank. Those data distinguish the way a vehicle is powered by vehicle model.
Figure 1 features a line graph of the annual volumes of new and used BEV registrations since 2010; it also features tables with shares of U.S. registrations of new and used BEVs for the top three states in select years (which we will discuss later on). It is evident that used BEV registrations lag new BEV registrations. This starkly contrasts with what we see in the overall used vehicle market, which typically represents more than twice the size of the overall new vehicle market, according to industry research. That said, there is one BEV model that stands apart from the general pattern for used versus new BEVs: the Nissan LEAF. Of all BEV models for sale today as new vehicles, the LEAF has been on the market the longest (the LEAF’s launch year was 2010). Used LEAF registrations make up 33.6% of total LEAF registrations—twice the average for all BEV models’ registrations (16.8%). Used LEAF registrations are also more evenly distributed across the country: In each of the eight U.S. Bureau of Economic Analysis (BEA) regions, at least 20% of LEAF registrations are used vehicles. These Nissan LEAF results, all of which are based on our calculations using AutoCount data, suggest that with enough time the used BEV market relative to the new BEV market will look more similar to the overall used vehicle market relative to the overall new vehicle market.
Figure 1. Volume of BEV registrations, 2010–20, and percentage of BEV registrations, by year and top states
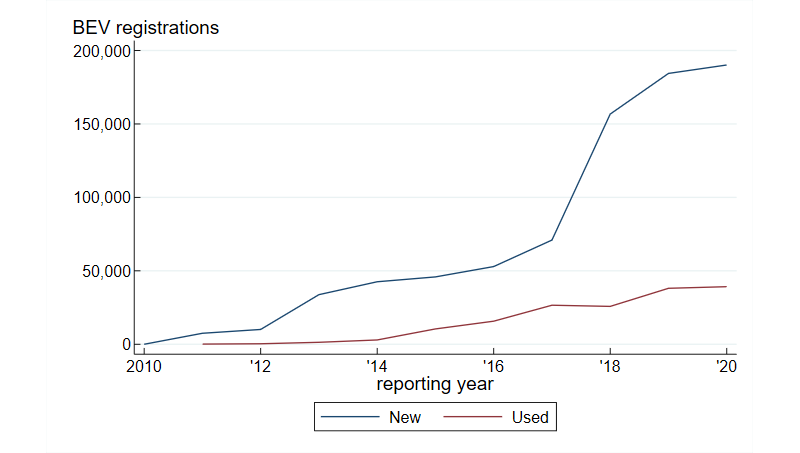
New |
|||||
| 2011 | 2015 | 2020 | |||
| State | Share | State | Share | State | Share |
| CA | 60.1 | CA | 58.1 | CA | 43.2 |
| WA | 12.2 | WA | 6.6 | FL | 7.2 |
| TN | 5.3 | FL | 4.6 | NY | 4.9 |
Used |
|||||
| 2011 | 2015 | 2020 | |||
| State | Share | State | Share | State | Share |
| OR | 49.6 | CA | 34.5 | CA | 34.6 |
| CA | 25.6 | WA | 10.8 | FL | 6.1 |
| AZ | 4.0 | GA | 6.0 | WA | 6.1 |
Source: Authors’ calculations based on data from AutoCount.
What is causing this lag in used BEV registrations? There are a couple of possibilities. First, the BEVs available in the market today have only been around for a relatively short period of time, especially when compared with the amount of time a typical ICE vehicle model has been available to consumers. The nature of the data set from AutoCount implies that while each vehicle can only be registered as new once, it can be registered as used several times. The brief history of the BEV means that there has been less time for individual vehicles to be sold and registered multiple times. The high frequency of used LEAF registrations relative to that of other used BEV models may provide insight into the future of used BEV adoption. The LEAF was released in 2010. Relative to owners of other BEV models, LEAF owners, therefore, have had more time to consider selling their cars on the used market; and consumers looking to buy used BEVs could have found the LEAF to be the most available option.1
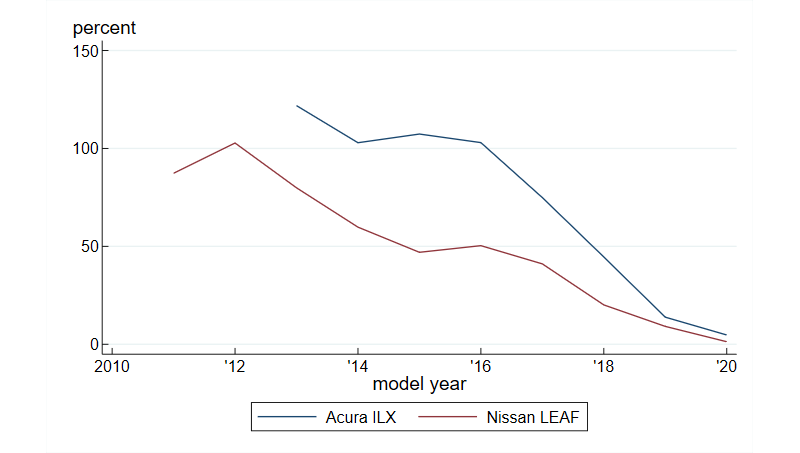
Another possibility is that consumers view BEVs as being quite different from ICE vehicles. There’s been recent evidence that used BEVs have not experienced price increases to the same extent as used cars in general since the onset of the Covid-19 pandemic. This may be related to concerns among consumers about the new BEV technology, such as the battery charge range and the ease of charging. Whether this factor persists as a feature of the demand for BEVs remains to be seen. Figure 2 shows a comparison between two compact car models—the Acura ILX and Nissan LEAF. Both have similar launch years and overall sales of new vehicles since their respective launches, according to data from WardsAuto InfoBank. The figure illustrates that for both vehicle models, new car registrations of more recent model years (or vintages) support fewer used car registrations than those of model years further past. However, across the observable years, the ICE car Acura ILX supports more used car registrations (relative to new car registrations) than the BEV Nissan LEAF. Though only two specific vehicle models are compared in figure 2, the results suggest a lower level of sales activity in the used BEV market than in the used ICE vehicle market.
Figure 2. Ratio of used vehicle to new vehicle registrations, by model year of new vehicle
Source: Authors’ calculations based on data from AutoCount.
Regional geography of BEV registrations
Using the geographic indicators in the AutoCount data, we sorted all BEV registrations into eight broad regions as defined by the BEA to analyze the distribution of these registrations across the country. Panel A of figure 3 shows this distribution based on the reported zip code of the vehicle’s owner. Most BEVs registered—57.9%—have been sold to consumers living in the Far West.
As shown in panels B and C of figure 3, owners in the Far West still account for the largest share of BEV registrations when we distinguish between new and used BEV registrations. Of note, however, is that the share of new BEVs registered by consumers in the Far West is somewhat lower than the share of used BEVs registered by them: 59.4% of all new BEV registrations have owners based in the Far West, while 50.4% of all used BEV registrations have owners from that same region. Consumers in the Southeast and the Southwest account for greater shares of used BEV registrations than they do of new BEV registrations. While the broad pattern is similar across all three panels of figure 3, the geography of used BEV owners is slightly different from that of new BEV owners.
Figure 3. Share of BEV registrations across the nation since December 2010, by region
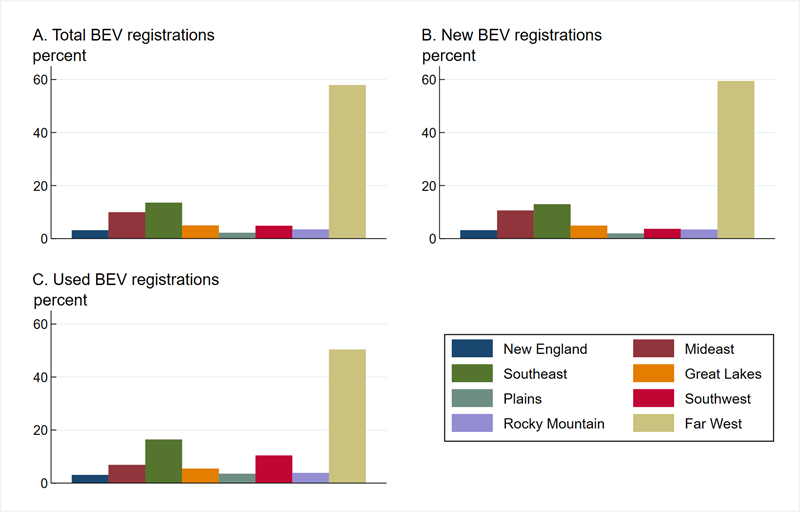
Source: Authors’ calculations based on data from AutoCount.
These nuanced differences in the regional geography of new and used BEV registrations are put into better context when referring to the tables embedded in figure 1. Between 2011 and 2020, California’s share of new BEV registrations fell from 60.1% to 43.2%. Between 2015 and 2020 that state’s share of used BEV registrations held steady at around 34.5%. These data are interesting for two reasons. First, California generally dominates both the new and used BEV markets (in 2011 it ranked second in the used BEV market). However, there is a noticeable difference in the overall geography of new and used BEV registrations. First, used BEV registrations are more geographically dispersed than new BEV ones in 2015 and 2020 (i.e., the top three states for used BEV registrations account for a smaller share of the total than the top three states for new BEV registrations do in those two years). Moreover, California accounts for a noticeably lower share of used BEV registrations than new BEV ones in 2015 and 2020. Second, while California continues to lead the country in the share of new BEV registrations, its share has been declining noticeably over time.
The dominance of California
Given its prominence in terms of BEV registration share, we further investigate the Far West BEA region (comprising Alaska, California, Hawaii, Nevada, Oregon, and Washington) by breaking down the region’s registrations by state for figure 4. California is indeed the outlier in that region. At over 80% of all BEV registrations in the Far West region, California is clearly the main driver of the Far West’s high shares of BEV registrations in all three panels of figure 3. Meanwhile, according to research from the National Automobile Dealers Association, in 2020, California accounted for only 11% of all new vehicle registrations nationwide—a stark difference from its strong lead among all states in the BEV market.
Figure 4. Share of BEV registrations within the Far West region since December 2010, by state
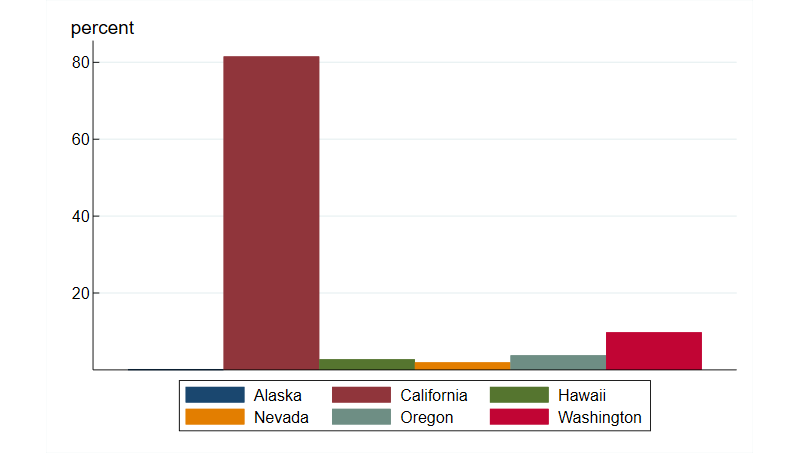
Source: Authors’ calculations based on data from AutoCount.
Why has California been so dominant in BEV registrations? The state started addressing environmental issues related to the use of automobiles many years ago—even before the establishment of the U.S. Environmental Protection Agency (EPA) in 1970; in fact, amendments to the Clean Air Act in 1970 allowed California to take a tougher line on air quality issues.2 More recently, in September 2020, California issued a directive for all new cars and passenger trucks sold in the state to be zero-emissions vehicles by 2035. It is not surprising that BEVs typically are first made available in California and that Tesla, the first BEV-only automaker in the country, started out in that state. In addition, California’s drivers face some of the highest gasoline prices in the country, impacting the economics of choosing between an ICE vehicle and a BEV.
Conclusion
We find some evidence that suggests new and used BEV sales behave differently. To date, new BEV registrations have been far more prevalent than used BEV ones. That is quite different from the general relationship between new and used vehicle registrations across the entirety of the auto market. BEV registrations are also more concentrated geographically—in the Far West. Yet, importantly, the data show that the geography of BEV ownership has been expanding since 2010, particularly through a rise in used BEV purchases.
Many questions remain about the used BEV market. The topic bears revisiting once a longer sample period of BEV sales and registrations is available. More comprehensive data—such as BEV pricing, the expected rate of depreciation, and the relationship between BEV popularity, gas prices, and availability of charging infrastructure—would be useful as well. Regardless, the used BEV market seems likely to play a growing role in the transition from ICE vehicles to BEVs in the coming years and needs to be watched closely.
Virtual Event
Charging Ahead with Electrification—A Conversation About the Auto Industry
Wednesday, October 6, 2021, from 10:00 am to 11:00 am CT
We are at the beginning of a dramatic shift in the auto industry—a transformation that will impact manufacturers, their workforce, and the Detroit region. Join us for our next virtual Project Hometown event, where we will discuss battery electric vehicles and their impact on the auto industry.
Notes
1 Note that among all BEV registrations observed since 2010 in the AutoCount database, the LEAF accounts for the second-highest number of them and has also the longest history of any of the top three models. (The Tesla Model 3 has the highest number of registrations in the database.)2 Smog in the Los Angeles basin played a huge role in the State of California beginning to address environmental issues related to the use of vehicles in the 1960s. See, for example, John D. Graham, 2021, The Global Rise of the Modern Plug-In Electric Vehicle: Public Policy, Innovation and Strategy, Northampton, MA: Edward Elgar.


