

Introduction and summary
Since the start of the Covid-19 pandemic, the U.S. labor market has been characterized as being plagued by missing jobs, i.e., payroll employment has fallen more than five million jobs short of its pre-pandemic trend, and missing workers, i.e., the labor market participation rate has declined by 0.7 percentage points. A pandemic-induced shortage of workers has restrained job creation and, as a result, been a substantial drag on post-pandemic job growth. We show that this is a misinterpretation of the data for two reasons.1 The first is that the number of missing jobs is inflated, because it is based on the unrealistic assumption that the pre-pandemic tailwinds for job growth from the decline in the unemployment rate and cyclical upward pressures on participation would have continued in 2020 and beyond if the pandemic had not occurred. Second, the number of workers missing due to Covid is overstated, because the decline in the labor market participation rate since the start of the pandemic reflects a continuation of its long-run downward trend, which was already part of projections before the pandemic broke out. Instead, our payroll jobs accounting yields a 1.4 million cyclical surplus in payroll jobs in April 2023 compared with right before the pandemic. A continued deceleration of payroll growth in the months after April 2023 is to be expected.
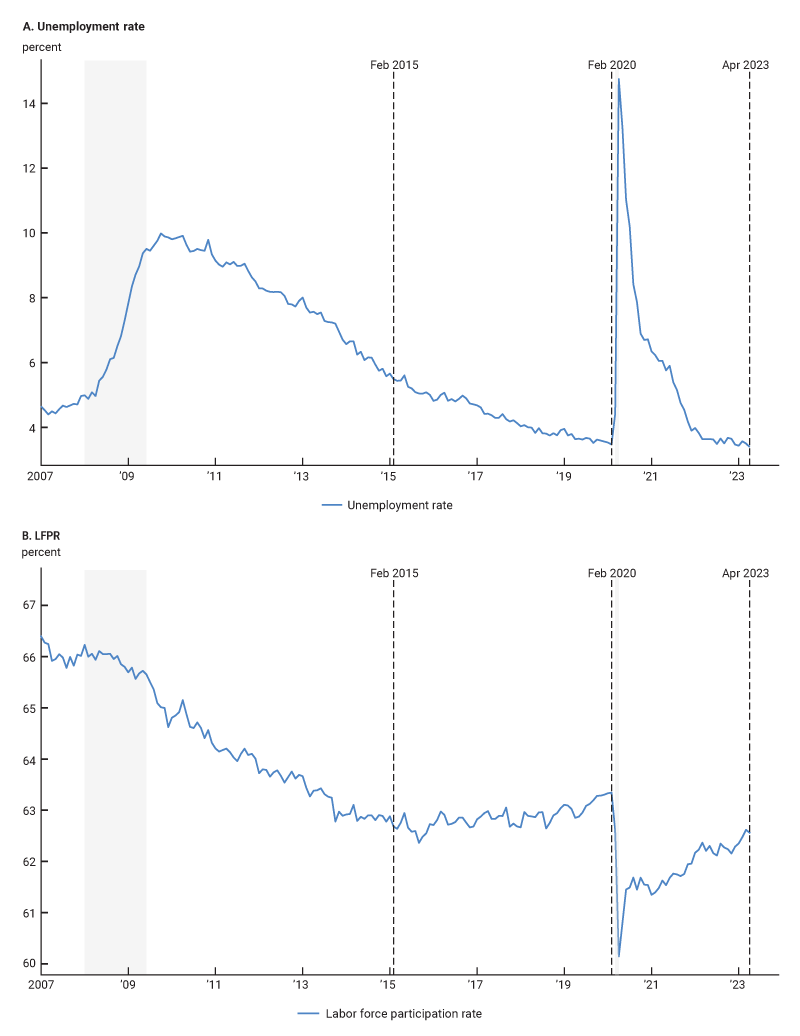
The onset of the Covid-19 pandemic in early 2020 resulted in a deep but brief recession, with real GDP decreasing at an annual rate of 32.9% in the second quarter of 2020 and the unemployment rate rising from 3.5% to 14.7% in a matter of weeks. After the drastic drop in economic activity, the economy rebounded briskly. The unemployment rate had dropped back to 6% by the end of 2020 and reached its pre-pandemic low of 3.5% within two years (figure 1, panel A). Many closely watched indicators of labor market activity, such as the job openings rate, wage growth, and quits rate, reached historically high levels. Despite these signs of strength in the labor market, two important indicators have been pointed to as showing a muted recovery.
The first is the labor force participation rate (LFPR). It has only partially recovered and, as of April 2023, was still 0.7 percentage points below its pre-pandemic level (figure 1, panel B). This apparent shortfall in persons participating in the labor market is often referred to as the missing workers after the pandemic. The second is the level of nonfarm payroll employment. As of April 2023, it was 4.5 million jobs short of its pre-pandemic trend (figure 2). This job deficit reflects the presumed missing jobs due to the Covid-19 pandemic.
1. Unemployment and labor force participation rates
Looking at the shortfalls in these two indicators, which took place at the same time that the job openings and quits rates reached historically high levels, one might infer that Covid has induced a permanent decline in the U.S. labor supply, resulting in a shortage of workers that has hampered job creation and as a result, dampened nonfarm payroll job growth. In fact, there are several reports that highlight the potential effect of Covid on the size of the U.S. workforce.2 A simple back-of-the-envelope calculation already reveals a disconnect between the number of missing workers and missing jobs. The U.S. population in April 2023 was 266 million people.3 So the “missing” workers, reflected in the 0.7 percentage point decline of the participation rate, amount to about 1.9 million persons. That is less than half of the number of “missing” jobs.
A more formal quantitative assessment of the number of missing workers and jobs requires a mapping between nonfarm payroll employment and the labor force participation rate. In this article, we introduce such a mapping, based on a simple accounting identity, and use it to provide an alternative to the missing jobs and missing workers narrative. The results we obtain using our accounting method reveal that the numbers of both missing workers and missing jobs are severely overstated.
The bulk of the 4.5 million missing jobs figure is due to the implausible counterfactual assumption that the labor market recovery that occurred in the five years before the pandemic would have continued at the same pace from 2020 through 2023. If that were the case, and if Covid did not break out, the unemployment rate would have declined to 2.1% in April 2023—a historically unprecedented low level and well below the 2019 projections of the 2023 unemployment rate by private sector forecasters and policymakers. These assumed continued cyclical improvements from 2020 through 2023 would have not only pushed up payroll growth through declines in the unemployment rate, but also through continued cyclical upward pressures on the participation rate.
Most of the missing workers, who supposedly dropped out of the labor force because of the pandemic, are part of a continuation of the downward long-run trend in participation that was present before 2020.4 In fact, relative to that long-run trend, we have seen a marked cyclical rebound in labor market participation since the depth of the pandemic. Our measure of the participation cycle, based on Hobijn and Şahin (2021), indicates that the cyclical component of the LFPR in April 2023 was 0.5 percentage points below where it was right before the pandemic.
The accounting identity that we introduce is useful because it allows us to directly link the number of missing jobs, based on the establishment survey (Current Employment Statistics [CES]), to the number of missing workers, taken from the household survey (Current Population Survey [CPS]). It splits the level of payroll employment into five distinct parts. The first captures the difference between the establishment survey (CES), the source of the payroll employment data, and the household survey (CPS), the source of the unemployment and labor force participation rates. The second captures the difference in scope between payroll employment and household employment. The third term is the employment rate, i.e., one minus the unemployment rate. The fourth is the LFPR. The final one is the size of the population. We use this mapping to link payroll employment growth to changes in the unemployment rate, to changes in the participation rate, and to population growth. The first two terms are related to measurement issues and turn out to be relatively unimportant for the number of missing jobs. So, our main focus is on the last three terms.
Extrapolating the pre-Covid cyclical upward pressures on payroll employment from changes in the unemployment and participation rates reveals that about 3.5 million of the 4.5 million missing jobs in April 2023 are due to the unrealistic assumption that these cyclical pressures would have continued from 2020 through 2023 if the pandemic had not happened. The term “missing” is, of course, a misnomer here.
Population growth has been roughly in line with its pre-pandemic level. The result is that the current level of the civilian noninstitutional population (CNP) is only slightly higher than expected based on its pre-pandemic trend. This amounts to about 270,000 more payroll jobs now than based on the pre-pandemic population trend and contributes negatively to the number of missing jobs.
The remaining, about 1.4 million, missing jobs are accounted for by a sharper trend decline in the labor force participation rate since the beginning of 2020 than in the five years before. It is this slightly accelerated trend decline in participation that one could interpret as the source of the “missing” workers. It drives the 0.7 percentage point decline in the participation rate since the start of the pandemic—although most of the decline is due to the continuation of the long-run trend in participation that was already present before the pandemic.
When we abstract from the implausible counterfactual trend as our baseline, we find that in April 2023 payroll employment was 1.4 million jobs above its trend right before the pandemic, in February 2020. About 100,000 of these jobs are because the unemployment rate in April 2023 was slightly lower than in February 2020. The remaining 1.3 million jobs are because of the upward cyclical pressure from the strong labor market on the participation rate. The labor market in 2019 and early 2020 was considered “hot” (Aaronson et al., 2019), and our results suggest that the labor market in the spring of 2023 had reached a similar, or slightly higher, temperature.5
Our analysis suggests that, after the pandemic, the U.S. labor market has rebounded remarkably quickly back to its long-run trend. There is little evidence of a structural break in this trend due to Covid. In this sense, there is an important parallel between the discussion about the labor market after Covid and about financial markets and the economy after the Great Recession. Large shocks, such as pandemics and financial crises, naturally lead to claims that “this time is different” (Reinhart and Rogoff, 2009), but things tend to be less different in hindsight than they may appear while they are happening.
The quick rebound of the labor market back to its long-run trend is a testament to the resilience of the U.S. economy. However, it also means that what is restraining growth in the labor market now is the long-run trend in labor supply, already known before the pandemic, and that is not expected to reverse in the coming decade. Combining our accounting identity with the most recent labor-force projections by the U.S. Bureau of Labor Statistics (BLS), we find that trend payroll job growth is about 65,000 jobs a month.
This trend estimate implies that even in the absence of contractionary policy or negative shocks, a maturing recovery in the labor market implies a slower underlying pace of monthly payroll job creation. This observation is important, because it cautions against attributing the slowdown in payroll job growth in 2023 solely to the impact of policy.
Next, we introduce a simple but comprehensive framework to account for how missing jobs and missing workers are related. First, we focus on the levels of payroll employment and the participation rate. Then, we compare actual and counterfactual (log) changes in these variables to quantify the number of missing jobs and how this relates to missing workers. Finally, we consider the roles of population growth and the unemployment rate in the number of missing jobs.
The link between participation and payroll employment
Our goal is to analyze both missing workers, reflected in the 0.7 percentage point shortfall of the LFPR relative to the start of the pandemic, and missing jobs, seen in the shortfall of payroll employment relative to its pre-pandemic trend, in one consistent framework. Comparing these two time series is not trivial because the statistics on payroll employment are from the establishment survey (CES) while those on the participation rate are from the household survey (CPS). These two measures are linked through an accounting identity that we rely on in the rest of this article to quantify the number of missing workers and jobs in the wake of the pandemic.
To understand the accounting identity that we use, it is important to realize that the BLS publishes two measures of employment. The first one, Et, is the number of persons who report themselves as employed and is based on data from the household survey. The second, Jt, is the number of nonfarm payroll jobs, measured as part of the establishment survey. These two employment concepts differ not only because they are constructed from different surveys, but also because each has a different scope. In particular, Jt measures the number of wage or salary jobs in the nonfarm sector. Et covers the number of persons employed, on payroll, self-employed, or working unpaid in their family’s business, in the whole economy. Moreover, in Et multiple jobholders are counted as one person, while in Jt they are counted as several jobs.
We relate Jt, in terms of which we measure missing jobs, to Et through an identity that isolates the impact of the difference in the survey and the difference in scope. In particular, we write
$1)\;{{J}_{t}}=\underbrace{\left( \frac{{{J}_{t}}}{J_{t}^{H}} \right)}_{\begin{matrix} \text{Survey } \\ \text{difference} \end{matrix}}\underbrace{\left( \frac{J_{t}^{H}}{{{E}_{t}}} \right)}_{\begin{matrix} \text{Scope } \\ \text{difference} \end{matrix}}\underbrace{{{E}_{t}}}_{\begin{matrix} \text{Household } \\ \text{employment} \end{matrix}}.$
The above identity separates the survey and scope differences through the use of $J_{t}^{H}.$ It is a measure of nonfarm payroll employment constructed using data from the household survey, i.e., the CPS, rather than from the CES.6 Figure 3 plots the three employment measures from equation 1. Because of the broader scope, the employment level in the CPS, Et, is higher than the measures of payroll employment, Jt and $J_{t}^{H}.$ The payroll employment measures from the CES and CPS are closely aligned since 2015, except for during the pandemic when the household-survey-based measure showed more job losses than the establishment survey.
Our goal is to map payroll employment into the participation rate. This requires the additional step of expressing household employment, Et, in terms of the unemployment rate, ut, the LFPR, LFPRt, and CNP, POPt, i.e.,
$2)\;{{E}_{t}}=\text{ }\left( 1-{{u}_{t}} \right)LFP{{R}_{t}}PO{{P}_{t}},$
where (1 − ut) is the fraction of the labor force that is employed, LFPRt is the fraction of the population that is part of the labor force, and POPt is the size of the population. Combining equations 2 and 1 provides the link between payroll employment and the participation rate that we use in the rest of our analysis:
$3)\;{{J}_{t}}=\underbrace{\left( \frac{{{J}_{t}}}{J_{t}^{H}} \right)}_{\begin{matrix} \text{Survey } \\ \text{difference} \end{matrix}}\underbrace{\left( \frac{J_{t}^{H}}{{{E}_{t}}} \right)}_{\begin{matrix} \text{Survey } \\ \text{difference} \end{matrix}}\underbrace{\left( 1-{{u}_{t}} \right)}_{\begin{matrix} \text{Unemployment } \\ \text{rate} \end{matrix}}\underbrace{LFP{{R}_{t}}}_{\begin{matrix} \text{Participation } \\ \text{rate} \end{matrix}}\underbrace{PO{{P}_{t}}}_{\text{Population}}.$
It is useful to write the above equation as additive in terms of log changes, i.e.,
$4)\;\underbrace{\Delta \ln {{J}_{t}}}_{\begin{matrix} \text{Payroll } \\ \text{growth} \end{matrix}}=\underbrace{\Delta \ln \left( \frac{{{J}_{t}}}{J_{t}^{H}} \right)}_{\begin{matrix} \text{Change in } \\ \text{survey difference} \end{matrix}}+\underbrace{\Delta \ln \left( \frac{J_{t}^{H}}{{{E}_{t}}} \right)}_{\begin{matrix} \text{Change in } \\ \text{scope difference} \end{matrix}}+\underbrace{\Delta \ln \left( 1-{{u}_{t}} \right)}_{\begin{matrix} \text{Unemployment } \\ \text{change} \end{matrix}}+\underbrace{\Delta \ln LFP{{R}_{t}}}_{\begin{matrix} \text{Participation} \\ \text{change} \end{matrix}}+\underbrace{\Delta \ln PO{{P}_{t}}}_{\begin{matrix} \text{Population } \\ \text{growth} \end{matrix}},$
which implies that payroll employment growth is faster when 1) the unemployment rate declines at a faster rate, 2) LFPR increases rapidly, and 3) the population growth rate is higher. There is also room for the scope and survey differences to matter, but as we show later, these terms turn out to be quantitatively unimportant in the data.
From missing jobs to missing workers
The number of missing jobs in figure 2 is imputed by assuming that average payroll growth from February 2015 through February 2020 would have continued throughout the pandemic and afterward. In particular, we impute the counterfactual level of payroll employment in month t after the start of the pandemic ${{\hat{J}}_{t}},$ as follows:
$5)\;\ln {{\hat{J}}_{t}}=\ln {{J}_{t^*}}+g(J)(t-t^*).$
2. Post-Covid payroll gap
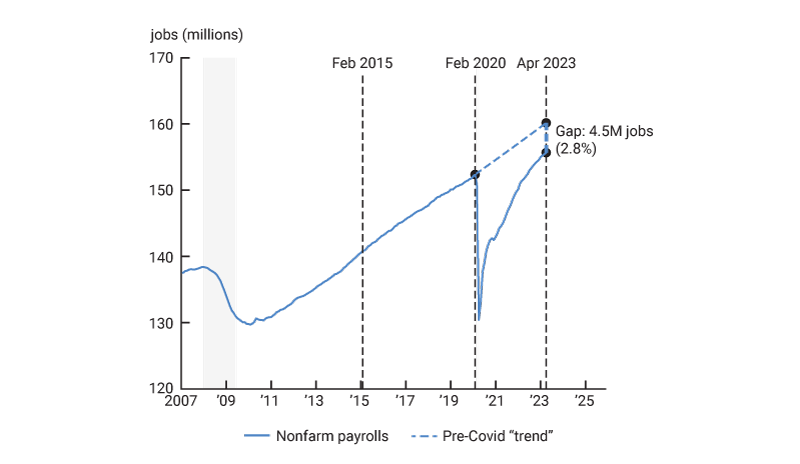
Sources: U.S. Bureau of Labor Statistics and authors’ calculations.
Here t* is February 2020, i.e., the month before the pandemic, (t − t*) is the number of months since the start of the pandemic, and g(Xt) is the average growth rate of Xt, in this case payroll jobs, during the five years preceding the pandemic. That is,
$6)\;g(X)=\frac{1}{t^*-\text{ }{{t}_{0}}}(\ln {{X}_{t^*}}-\ln {{X}_{{{t}_{0}}}}),$
where t0 is February 2015. Note that, from equation 4 it follows that
$7)\;g\left( J \right)=g\left( \frac{J}{{{J}^{H}}} \right)+g\left( \frac{{{J}^{H}}}{E} \right)+g\left( 1-u \right)+g\left( LFPR \right)+g\left( POP \right).$
That is, the extrapolated counterfactual trend in payroll growth, which we use to calculate the number of missing workers, is additively separable into parts due to the five drivers of payroll growth. Each of these parts is its extrapolated average growth rate (log change) from the five years before the pandemic.
The number of missing workers is the difference between this counterfactual level of payroll employment in April 2023, which we denote by t1, and the actual level of payroll employment.
For our analysis, we focus on the log difference:7
$8)\;\ln {{\hat{J}}_{{{t}_{1}}}}-\ln {{J}_{{{t}_{1}}}}=\left( \ln {{{\hat{J}}}_{{{t}_{1}}}}-\ln {{J}_{t^*}} \right)-\left( \ln {{J}_{{{t}_{1}}}}-\ln {{J}_{t^*}} \right).$
Above, we have shown that each of the two components on the right-hand side of this equation is the sum of parts due to the five components underlying payroll employment growth. Taking the differences between these respective parts, we obtain that the number of missing workers is the sum of the shortfalls in each of the five components since the start of Covid from their pre-Covid trends. Mathematically, this yields:
$9)\;\ln {{\hat{J}}_{{{t}_{1}}}}-\ln {{J}_{{{t}_{1}}}}=\sum\limits_{X\in \chi }{\left\{ g\left( X \right)\left( {{t}_{1}}-{{t}^{*}} \right)-\left[ \ln \left( {{X}_{{{t}_{1}}}} \right)-\ln \left( {{X}_{t^*}} \right) \right] \right\},}$
where
$10)\;\chi =\left\{ \frac{J}{{{J}^{H}}},\frac{{{J}^{H}}}{E},1-u,\text{ }LFPR,\text{ }POP \right\}.$
Thus, the percentage shortfall in payroll employment from its pre-Covid trend is the sum of the percentage shortfalls of 1) the survey difference, 2) the difference in scope, 3) the employment rate, 4) the participation rate, and 5) the population level, from their respective pre-Covid trends.
It turns out that the first two terms are relatively unimportant.8 Next, we focus on the population and unemployment terms. We then take on the participation term.
Population growth in the wake of Covid
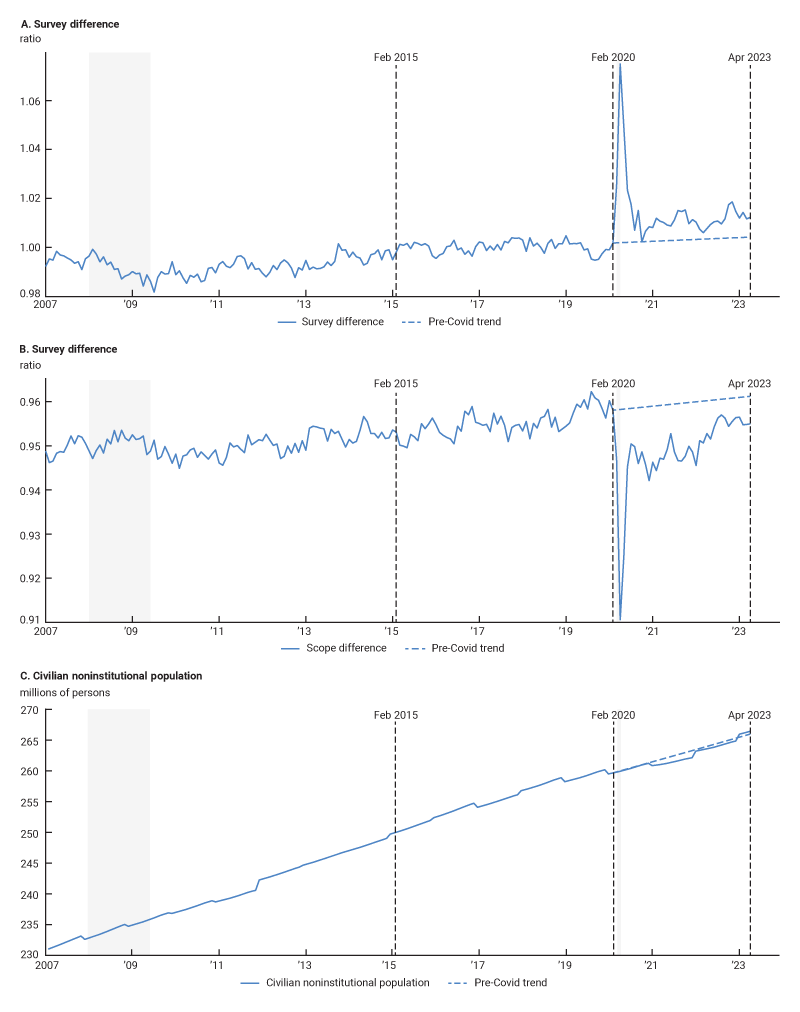
One aspect that might result in a shortfall in the number of jobs is a decline in population growth. This would be captured by post-Covid growth in the CNP coming in below its pre-pandemic trend. The population term in equation 8 quantifies this. However, it does not imply such a shortfall. Instead, it suggests that the April 2023 level of the CNP was 0.2 percentage points, i.e., about half a million persons, higher than the pre-Covid trend.
This result is surprising for two reasons. The first is that projections of longer-run demographic trends, related to declining fertility rates and immigration, that predate the pandemic included a decline in the growth rate of the CNP (Dubina et al., 2019). The second is that it implies that the pandemic had a relatively small impact on the size of the U.S. population. The National Center for Health Statistics (2022) estimates the number of excess deaths in the U.S. from the start of the pandemic through April 2023 to be 1.3 million. Since Covid disproportionately affects older persons, these excess deaths are mostly in the civilian noninstitutional population.9 These two negative factors affecting the size of the CNP have been offset by revisions in its level, due to measurement error.
This raises the concern that the published statistics overstate the actual size of the CNP. However, if this were the case then the household-survey-based (CPS) proxy for payroll employment would exceed that based on the establishment survey (CES), which is not the case. This can be seen from figure 3. Based on that observation, we report the estimate based on the BLS measure of the CNP with the caveat that it is subject to issues above.
3. Three employment measures from household and establishment surveys
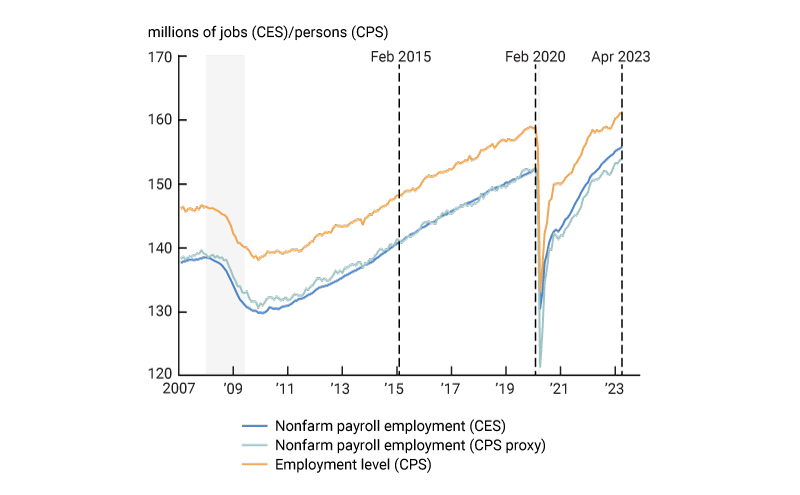
Source: U.S. Bureau of Labor Statistics.
It is important to note that the half-a-million-person gap in the CNP between the pre-Covid trend and the current level of the population does not, one for one, translate into half a million jobs. This is because the whole population is not on nonfarm payrolls. Instead, equation 9 reveals that the one-for-one translation is in percentage-point gaps not in the number of persons. It is the equivalent of 271,000 more payroll jobs and adds to the missing jobs puzzle rather than explaining it.
The unemployment rate and cyclical payroll growth
Equation 4 implies that the contribution of the changes in the unemployment rate, ut, to the growth in payroll employment is
$11)\;\Delta \ln \left( 1-{{u}_{t}} \right)\approx -{{\Delta }_{{{u}_{t}}}}.$
A 1 point decrease in the unemployment rate contributes 1 percentage point, or about 1.5 million jobs, to payroll growth. This observation is important, because for the contribution of the unemployment rate to the number of missing jobs, we assume that the pre-pandemic trend from 2015 through 2019 would have continued if the pandemic had not broken out. As can be seen from figure 1, panel A, the pre-pandemic trend period was one in which the unemployment rate declined by 2.2 percentage points from 5.7% to 3.5%. During the five years before the pandemic broke out, the decline in the unemployment rate pushed up average annual payroll growth by 0.44 percentage points. The rule of thumb yields that this is the equivalent of approximately 55,000 jobs per month.
If this trend had continued in the absence of the pandemic, that would imply that the unemployment rate would have had to decline by a further 1.4 percentage points between February 2020 and April 2023, from 3.5% to 2.1%. This 2.1% would have been an improbably low unemployment rate. The 1.4 percentage point decline in the unemployment rate implied by this counterfactual would have boosted the level of payroll jobs by 2.1 million. These jobs are counted as missing but were actually never expected to be created in the first place.
A further decline in the unemployment rate from 2020 through 2023 was not expected by forecasters and policymakers before the pandemic. The mean forecast in the Survey of Professional Forecasters in 2020:Q1, right before the pandemic broke out, was for the unemployment rate in 2020 and 2021 to hover between 3.5% and 3.6%. The December 2019 Summary of Economic Projections (SEP) shows that the forecasts of members of the Federal Reserve’s policymaking body, the Federal Open Market Committee (FOMC), were very similar to those of forecasters in the private sector. Ironically, though we experienced the pandemic and the highest unemployment rate in the postwar period in the meantime, the 2019 forecasts of the 2022 unemployment rate were remarkably accurate. This highlights how the period from February 2020 through April 2023 covers a full, condensed (labor-market) business cycle.
The result is that from February 2020 through April 2023, the contribution of the change in the unemployment rate to payroll job growth is negligible. The slightly lower unemployment rate in April 2023 compared with February 2020 is the equivalent of about 100,000 payroll jobs. Again, these only add to the missing jobs puzzle.
Missing workers and the participation cycle
In this section we focus on the term in equation 9 related to the LFPR. That term assumes that the average annual percentage change in the participation rate in the five years preceding the pandemic would have continued from 2020 through April 2023 if Covid had not hit. During the pre-pandemic period, the LFPR increased from 62.7% in February 2015 to 63.4% in February 2020, i.e., by 1.1% over five years. From equation 4 we know that percentage changes in the LFPR translate one-for-one into percentage changes in nonfarm payrolls. This means that the change in participation before the pandemic contributed 0.2 percentage points annually to payroll job growth, or about 25,000 jobs per month.
However, this number conflates two very different forces that drive participation. The first is the long-run trend in the LFPR that is driven by demographic trends, particularly in recent years by the aging of the baby boomer generation, as well as changing participation decisions across cohorts. The second is the cyclical adjustment of the LFPR during the extended labor market recovery period after the Great Recession. To better understand the part of the missing jobs accounted for by the participation rate, it is important to disentangle these two forces. This is because it is reasonable to assume that the long-run trend in participation would have continued after the pandemic broke out, as it was forecasted to do. However, just like for the unemployment rate, given the tightness of the labor market right before the pandemic, it would be unrealistic to assume that the cyclical upward pressures on participation would have continued from 2020 through the spring of 2023 to the same extent they were present in the pre-pandemic period. A clear distinction of the trends and cycle in the participation rate is also useful to understand to what extent the post-Covid period 0.7 percentage point drop in the LFPR is due to cyclical economic pressures or driven by a longer-run trend.
In the rest of this section, we split changes in the LFPR up into cycle and trend. We show that the cyclical upward pressures on payroll growth from participation in the pre-pandemic period were of the same order of magnitude as those from the decline in the unemployment rate that we discussed in the previous section. Moreover, the cyclical pressures on payroll growth when we compare February 2020 with April 2023 are very small. And if anything, the cyclical upward pressures on participation are higher in April 2023 than before the pandemic. Our separation of the participation cycle from its trend is based on our earlier work in Hobijn and Şahin (2021) and Elsby et al. (2019).10
Uncertainty about trend participation
Cyclical movements in the labor force participation rate are hard to assess due to the nonlinear long-run trend in participation. Most studies that try to distinguish between the trend and cyclical components of the participation rate proceed by estimating a trend rate and then treating the deviation of the actual from this trend as the cyclical component (e.g., Aaronson et al., 2006, 2012; Van Zandweghe, 2012; Aaronson et al., 2014; and Hornstein, Kudlyak, and Schweinert, 2018). These studies tend to agree on two stylized facts: 1) the aging of the workforce has been reducing the trend participation rate, and 2) the labor force participation rate is procyclical. Yet, there is considerable disagreement about the level of the trend and cyclical components of the LFPR.
This can be seen in figure 4. It plots the path of the actual LFPR, as well as the estimates of the trend participation rates from the aforementioned studies, the Congressional Budget Office (CBO), and two of the Federal Reserve’s Tealbooks. There is a large amount of disagreement about the level of trend participation. For example, the 2015 estimate of trend participation in 2022 by the CBO was 61.4%, while the 2022 estimate was 62.6%. This 1.4 percentage point difference is the equivalent of about 1.8 million payroll jobs. These differences in trend estimates mainly reflect upward and downward revisions of the whole trend path. There is a broad consensus about the approximate slope of the trend. Almost all the trend estimates in figure 4 put the slope of the downward long-run participation trend at around 0.25 percentage points per year between 2015 and 2022. This implies a 0.4% annual decline in trend participation. Equation 4 yields that this is a 0.4 percentage point drag on payroll growth, which amounts to about 50,000 payroll jobs per month.
4. Actual LFPR and various trend estimates
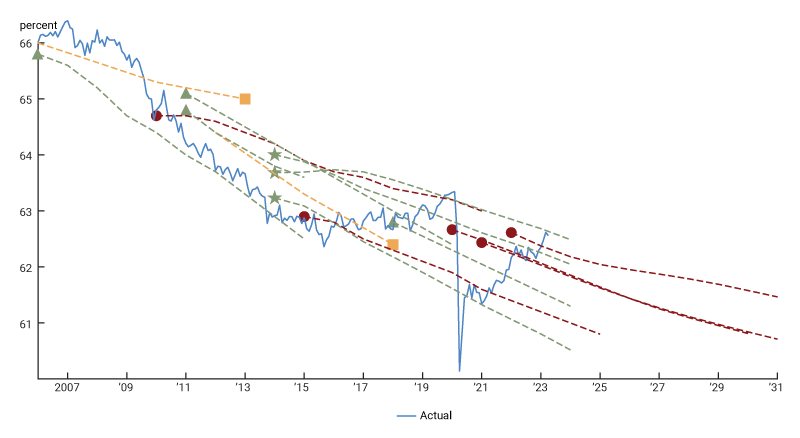
Sources: U.S. Bureau of Labor Statistics and authors’ calculations.
The sudden, more than 3 percentage point, drop in the LFPR at the onset of the pandemic raised the concern that there was a discontinuity in trend participation. In particular, there is evidence that some workers retired early in the face of the age-biased health risk posed by the pandemic (Faria e Castro, 2021). However, recent evidence suggests that these accelerated retirements were later offset by a slowdown in retirements (Thompson, 2022). To what extent these accelerated retirements caused a temporary acceleration in the downward long-run trend participation rate and in how far this acceleration is offset by a subsequent slowdown in retirements is hard to assess.11
An analysis of flows between retirement and participation reveals that this is especially true because a large part of the increase in retirements is not because the retirement rate went up, but because a smaller share of retirees unretired to take (temporary) jobs (Nie and Yang, 2021). This phenomenon is not well understood, since most analyses are based on the assumption that retirement is a permanent state for most retirees. The analysis of flows is useful not only for studying the stock of retired persons, but it also turns out to be very informative about the dynamics of the labor market as a whole and, in particular, can be used to quantify the main driving forces of the procyclical component of the LFPR.
Flow-based decomposition of changes in the LFPR
As an alternative to calculating the cyclical component of labor force participation as the difference between the actual LFPR and an estimated trend, we proposed a measure called the “participation cycle.” This measure is the part of the movements of the LFPR driven by the flows that also account for the bulk of the fluctuations in the unemployment rate, namely the job-finding and job-separation rates (Elsby et al., 2019; Hobijn and Şahin, 2021).12 This measure of the participation cycle has a clear interpretation and can be used to construct a monthly time series of changes in the participation cycle in real time.
Our measure exploits that the joint dynamics of the labor force participation and unemployment rates are driven by the six flows between the labor force states of employment (E), unemployment (U), and nonparticipation (N). It decomposes the evolution of shares of the population in each labor force state, {E, U, N}, into parts due to changes in each of the six different labor market flow rates between these three states. Of particular interest for our assessment of the number of missing workers is the sum of the shares of the population that is in E and N, which is equal to the LFPR. We provide the details of the derivation of the decomposition in appendix 1. Here we focus on the main intuition behind it and on the resulting measure of the participation cycle.
The parts of our decomposition are interpretable only in the case of relatively small changes in the labor market flow rates. However, during the pandemic the rates at which people exited the labor force spiked, and after that, the entry rates were elevated (figure 5). This makes our monthly decomposition hard to interpret in the midst of the pandemic. For this reason, we instead decompose the change in the flow steady state between February 2020 and May 2021 and skip the months in between.13
5. Labor force entry and exit rates as a fraction of the population
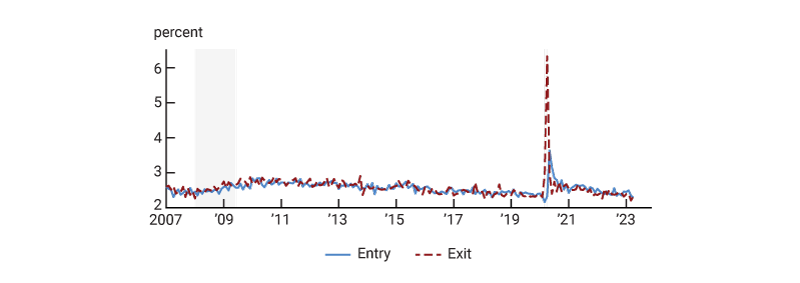
Sources: U.S. Bureau of Labor Statistics and authors’ calculations.
Entry, exit, and the participation cycle
Though our decomposition tracks the impact of each of the six flows on the LFPR separately, it is clearer to group them into three categories: entry, exit, and the cycle. Entry and exit capture the direct effect of labor force entry and exit, while the cycle captures how past and present changes in job-finding and job loss—shifts within the labor force—affect the participation rate. The entry component sums the effects of changes in the rates at which individuals flow into the labor force (either to employment or unemployment) on the LFPR. Everything else being equal, an increase in these rates puts upward pressure on the (flow steady-state) LFPR. The exit component captures the effects of changes in the rates at which people leave the labor force, both from employment as well as unemployment. Increases in those rates are a drag on participation.
The participation cycle measures how changes in the rates of job loss, i.e, flows from employment to unemployment, and job finding, i.e., those that flow from unemployment to employment, affect movements in the participation rate. We denote these rates by ${P}_{E,U}$ and ${P}_{U,E}$, respectively. These rates capture the flows within the labor force that most studies of participation ignore since they have no contemporaneous effect on the LFPR.
It might sound puzzling that these flows, which do not involve crossing the participation margin, affect the dynamics of the participation rate. The reason they do is because the unemployed are much less attached to the labor force than the employed. Specifically, the average share of unemployed workers that leave the labor force in a month, ${P}_{U,N}$, is around 25%. That is many times the share of employed workers that drop out of the labor force, ${P}_{E,N}$, which averages 2.8%. The difference between these two rates is the attachment wedge. Because of this large positive attachment wedge, the higher the fraction of the labor force that is unemployed, i.e., the higher the unemployment rate, the more likely participants are to drop out of the labor force in the future. This mechanism, which works through the labor force attachment channel, puts downward pressure on the participation rate going forward when the unemployment rate increases.14
Figure 6 plots the cumulative contribution of the entry, exit, and cycle components for each business cycle starting at the trough in the unemployment rate, indicated by the vertical dashed lines. The figure reveals that the cycle component is the only one of the three that puts procyclical pressures on the participation rate.
6. Change in LFPR decomposed, January 2007 to April 2023

Sources: U.S. Bureau of Labor Statistics and authors’ calculations.
The exit component is mildly countercyclical. This is because both the average unemployed and employed workers are more attached to the labor force during recessions than during expansions. This decline in the exit rate from participation conditional on (un)employment in downturns puts upward pressure on the participation rate during recessions and in the earlier parts of expansions. The entry component is only mildly cyclical and is most important in driving the long-run nonlinear trend in the participation rate.
Note that these components contradict a common explanation of the source of procyclicality of the participation rate, namely that marginal workers exit the labor force during recessions and then rejoin during the tail end of business cycle expansions (e.g., Summers, 1986; Aaronson et al., 2019). This would mean that the entry and exit margins would put procyclical pressures on participation, but our decomposition shows that they do not. Instead, the main source of procyclical pressures on participation is the composition of the labor force in terms of the employed and unemployed, which is mainly driven by the job-finding and job-separation rates. This is what is captured by the participation cycle.
During recessions, the unemployment rate increases and, as a result, the composition of participants shifts toward being more likely to subsequently drop out of the labor force. This puts downward pressure on the participation rate. Figure 6 shows that at their maximum, these pressures push the participation rate down by more than a percentage point for all recessions in our sample (except for the one that started in 1980). The largest drag on the LFPR from the participation cycle was during the Great Recession, when it depressed the participation rate by more than 3 percentage points.
Note that over the pre-pandemic period from February 2015 through February 2020, the participation cycle provided a 2 percentage point boost to the LFPR. This amounts to a 3% cyclical increase in the participation rate due to the improvement in labor market conditions between the beginning and the end of the period. Applying equation 4, we obtain that this 3% increase contributed 0.6 percentage points to annual payroll growth over the pre-pandemic period. That is the equivalent of about 75,000 payroll jobs a month created over that period. Thus, over the five years before the pandemic, the cyclical recovery in the participation rate was an important factor underlying the growth in payrolls. These positive cyclical pressures from participation are driven by the same two flow rates that drive improvements in the unemployment rate. The unemployment rate was forecasted to flatten out from 2020 to 2023 before the pandemic. If these forecasts were correct, then cyclical upward pressures on participation would also have dissipated from 2020 through 2023 if the pandemic did not happen.
These upward cyclical pressures on participation during the five years before the pandemic stand in stark contrast to those after the start of the pandemic. Figure 6 reveals that the participation cycle in April 2023 is 0.5 percentage points above its level in February 2020. This amounts to a 0.8% increase in the participation rate. Thus, stronger cyclical upward pressures on participation in April 2023 compared to before the pandemic add 0.8% to nonfarm payroll employment. That is 1.3 million jobs. Thus, the cyclical pressures on participation do not explain the missing jobs: Instead, they add to the puzzle.
As a consequence, our results imply that trend participation has declined by 1.2 percentage points, or by 2.1% of the LFPR. This decline is steeper than the 1.2% implied by the pre-Covid long-run trend. The pre-Covid long-run trend implied by our participation cycle estimate is of the same order of magnitude as the 0.25 percentage point annual decline in the LFPR from the trend estimates in figure 4.15 In terms of payroll jobs, the pre-Covid long-run trend in the LFPR implied a reduction of 1.9 million payroll jobs. Our estimate of the trend since the onset of the pandemic implies that trend participation has reduced payrolls by 3.3 million jobs. The difference of 1.4 million workers can be interpreted as an estimate of the number of missing workers.
Based on our analysis of the participation cycle, we find that the 0.7 percentage point decline in the participation rate since the start of the pandemic is driven by the long-run downward trend in participation and that a large part of this downward trend has been offset by a strong cyclical rebound in the participation rate, as captured by the participation cycle. Adjusting for this cyclical rebound, we find evidence of a slightly faster trend decline in participation since the onset of Covid than was implied by the pre-Covid trend. But this decline can by no means account for the number of missing jobs.
The number of missing jobs dissected
What is driving the shortfall of payroll jobs relative to their pre-pandemic trend? We now have all the parts of equation 9 to answer this question. The answer is provided in figure 7.
7. Number of missing jobs dissected
| Percentage points | Jobs | |||||
| Counterfactual | Actual | Difference | Counterfactual | Actual | Difference | |
| Unemployment rate | 1.3 | 0.1 | 1.3 | 2,110 | 126 | 1,985 |
| LFPR–cycle | 1.9 | 0.8 | 1.0 | 2,984 | 1,335 | 1,649 |
| LFPR–trend | –1.2 | –2.1 | 0.9 | –1,937 | –3,297 | 1,359 |
| Population growth | 2.4 | 2.6 | –0.2 | 3,814 | 4,085 | –271 |
| Survey difference | 0.2 | 1.0 | –0.8 | 378 | 1,639 | –1,261 |
| Scope difference | 0.3 | –0.3 | 0.7 | 517 | –509 | 1,026 |
| Total | 5.0 | 2.1 | 2.8 | 7,866 | 3,379 | 4,487 |
The first column of the figure shows the percentage point contribution of each of the parts to the percentage point change in payroll employment since the onset of the pandemic that would have occurred if the pre-pandemic trend had continued. For example, if the upward pressures of the participation cycle on payroll growth from February 2015 through February 2020 had continued for another three years and two months, that would have contributed 1.9 percentage points to the 5.0% total counterfactual increase in payrolls. Of course, as we have argued, the assumption that the tailwinds from the cyclical participation pressures would have continued if Covid had not happened contradicts the 2019 projections of professional forecasters and members of the FOMC, and it would have required the unemployment rate to decline to historically unprecedented low levels. In fact, more than half of the 5.0% counterfactual growth in payrolls since February 2020, 3.2 percentage points to be precise, is driven by the unrealistic assumption of the continuation of the pre-pandemic cyclical upward pressures on payroll employment from the unemployment and participation rates.
The second column of figure 7 lists the actual percentage point contribution to payroll growth over the post-pandemic period. For example, the long-run negative trend in the participation rate was a 2.1 percentage point drag on payroll growth from February 2020 through April 2023. Population growth contributed 2.6 percentage points to payroll growth. The two cyclical components, i.e., the unemployment rate and the participation cycle, together reduced payroll growth by 0.8 percentage points.
The third column takes the difference between the first two columns and measures the percentage point contribution to the 2.8% shortfall in payroll jobs in April 2023 versus their pre-pandemic trend. Notice that the bulk of the 2.8% is due to the unemployment rate and the participation cycle. However, this is not because there is a large cyclical shortfall in the unemployment and participation rates in April 2023 compared with February 2020. Instead, it is because of the implausible assumption that the pre-pandemic cyclical recovery would have continued after 2020 if Covid had not happened. Also note that the survey and scope differences together account for only –0.1 percentage points of the 2.8% shortfall. Changes in the long-run trend in the participation rate and the rate of population growth since the onset of Covid only account for the rest.
The last three columns of figure 7 translate the first three columns to payroll jobs in April 2023. So, if the unemployment rate had continued to decline after the pandemic broke out at the same pace it had declined in the five years before, that would have generated 2.1 million payroll jobs. Similarly, under this assumption, a continued recovery in the participation cycle would have generated another 3.0 million payroll jobs.
Thus, the majority of the missing jobs number is attributable to the misguided comparison of different stages of the business cycle. We do not consider these jobs as missing. Instead, they are the result of an unreasonably constructed counterfactual.
In reality, the unemployment rate in April 2023 was 0.1 percentage points lower than in February 2020. That is the equivalent of 126,000 payroll jobs. Our assessment that the participation cycle in April 2023 had more than fully recovered to its February 2020 level accounts for 1.3 million. Thus, instead of explaining part of the missing jobs, the cyclical components driving payroll job growth effectively add to them.
The last column of figure 7 calculates the net contribution of each of the six components of payroll growth to the 4.5 million missing jobs number. The entry for the LFPR trend in this column, which is 1.4 million jobs, can be interpreted as an estimate of the impact of the number of missing workers due to a change in the trend labor supply after the pandemic.16 The most recent estimates of the size of the CNP suggest that population growth has not substantially restrained trend labor supply since the onset of the pandemic. Together, the labor supply impact of changes in trend LFPR and population growth since the onset of the pandemic amounted to about 1.1 million payroll jobs in April 2023.
Implications for payroll job growth going forward
In figure 7, we show that the difference in the labor market cycle between February 2020 and April 2023, in terms of the unemployment and participation rates, is the equivalent of about 1.4 million payroll jobs. This is mainly due to the participation cycle in April 2023 pushing the LFPR up by 0.5 percentage points compared with February 2020. These 0.5 percentage points in the participation rate translate to 0.8 percentage points on nonfarm payrolls, or about 1.3 million jobs. One way to think about these 1.3 million jobs is to express them in a number of months of trend payroll growth.
Equation 4 provides a very intuitive way to think about trend payroll growth. If we assume that, when on trend, the changes in the survey and scope differences, as well as in the unemployment rate and participation cycle, are negligible, then trend payroll growth is equal to the long-run trend growth rate of the participation rate plus the population growth rate. This is the growth rate of the size of the labor force.17
The most recent projections by the BLS estimate the labor force to grow at 0.5% per year from 2021 through 2031; this is the rounded difference of 0.7% population growth minus 0.3% growth of the LFPR.18 If correct, this would imply a level of trend nonfarm job growth of 65,000 jobs a month. There is some downside risk to this estimate, because the BLS estimate of the trend decline in participation is lower than the estimates we plotted in figure 4. An increase in immigration could potentially push up this trend job growth.19
The main point here is that trend payroll growth is low and that the bulk of strong payroll job growth in early 2023 reflects a continued cyclical improvement in the labor market. Even in the absence of any policy measures, such as increases in the fed funds rate by the Federal Reserve, the labor market cycle should reach a stage of maturity in 2023 that leaves little room for payroll growth to exceed its trend level. Thus, without negative shocks or contractionary policy, we should expect a substantial slowdown in payroll growth. This observation is important because it cautions against attributing the slowdown in payroll growth solely to the impact of policy. Of course, our calculation of trend payroll growth assumes the unemployment rate will stabilize at around 3.4%. So, a better gauge of the impact of policy and shocks than the pace of payroll job growth would be changes in the unemployment rate and related movements in the participation cycle.
Conclusion
Two observations about the macroeconomic performance of the U.S. labor market might seem to suggest that there has been an abrupt change in the long-run dynamics since the onset of the pandemic in March 2020. The first is that there are missing workers—workers who dropped out of the labor force when Covid broke out and have not returned since—resulting in a 1.2 percentage point drop in the LFPR since the start of the pandemic. The second is that there are millions of missing jobs. Payroll employment in April 2023 is more than 4.4 million jobs below its pre-pandemic trend. The combination of these two observations might lead one to conclude that a drop in the U.S. labor supply related to Covid has been a restraining force on job creation that has resulted in millions of jobs not being created because of a lack of workers. In this article, we dispelled this narrative by using a simple accounting identity to relate the millions of missing jobs to the pre- and post-pandemic changes in the unemployment and participation rates, as well as to population growth. This accounting identity allows us to combine published macroeconomic time series on labor market aggregates with our estimate of the cyclical pressures on labor force participation (Hobijn and Şahin, 2021) to split up the missing payroll jobs into several clearly interpretable parts.
The bulk of the more than four million missing jobs number is due to the unrealistic counterfactual assumption that the labor market recovery that occurred in the five years before the pandemic would have continued at the same pace from 2020 through early 2023. If that had been the case, and then if Covid had not broken out, the unemployment rate would have declined to 2.1% in the spring of 2023. This is an implausibly low level and well below the 2019 projections of the 2023 unemployment rate by private sector forecasters and policymakers. These assumed continued cyclical improvements from 2020 through 2023 would have not only pushed up payroll growth through declines in the unemployment rate, but also because of continued upward cyclical pressures on the participation rate.
Surprisingly, the most recent population estimates from the BLS imply that population growth does not explain any of the missing jobs. The level of the civilian non-institutional population in April 2023 was above its pre-Covid trend.
About 1.4 million of the missing jobs are accounted for by a sharper trend decline in the labor force participation rate since the beginning of 2020 than in the five years before. It is this accelerated trend decline in participation that one could interpret as the source of the missing workers. Much of the decline in the participation rate is a continuation of the downward long-run trend in participation that was already present before 2020 (Cooper et al., 2021) and part of the acceleration of the trend was already forecasted before the pandemic.
The unemployment rate and the cyclical part of the participation rate only add to the missing workers puzzle. This is because cyclical pressures in payroll employment were higher in April 2023 than in February 2020, raising the level of payroll jobs by 1.4 million jobs.
Our accounting exercise in this article is essentially an analysis of labor market aggregates from 30,000 feet. Because of that, it misses many underlying effects of the pandemic. Covid has had a major impact on our physical and mental health and many of us have suffered the loss of family members and friends. Our work in this article is by no means intended to brush off the considerable emotional and economic pain the pandemic has caused.
What our results show is that, after the introduction of the vaccines in early 2021, the U.S. labor market has recovered very quickly to above where it was—relative to its long-run trend—at the beginning of 2020. This is a good sign for the resilience of the U.S. labor market. However, with little further room left for a cyclical adjustment, it also means that what is restraining growth in the labor market now is the long-run trend in labor supply, already known before the pandemic, and that is not expected to reverse in the coming decade.
Notes
1 We would like to thank Taegan Mullane for her research assistance. This paper is an updated version of a paper prepared for the 2022 Federal Reserve Bank of Boston Conference on Labor Markets During and After the Pandemic (NBER-WP 30717 and FRBC-WP 2022-54).
2 See, for example, Bach (2022), Goda and Soltas (2022), and Abraham and Rendell (2023).
3 This is the civilian noninstitutional population aged 16 and older, which is used as the basis for labor market statistics by the U.S. Bureau of Labor Statistics (BLS).
4 This echoes the point made by Cooper et al. (2021).
5 Several indicators of labor demand and turnover, such as job openings and quits, suggest the labor market in the spring of 2023 was even hotter than right before the pandemic. However, it is important to take into account the pace of the recovery that preceded these two comparison periods. Quits rates and turnover tend to be higher during fast recoveries than slow ones (Hobijn, 2022).
6 The CPS-based proxy of nonfarm payroll employment we use is Research series, employment adjusted to CES concepts, seasonally adjusted (LNS16000000), published by the BLS.
7 We will convert it back to a number of payroll jobs later.
8 See appendix 2, figure A1, panels A and B. They contain the extrapolated trends for the survey and scope differences respectively.
9 CNP includes those aged 16 and over, but those living in nursing homes are not part of the CNP.
10 We explain the intuition of our method in the main text and derive the details in appendix 1.
11 In addition, the interpretation of the recovery in the LFPR in early 2022 is complicated by a change in the estimated age-composition of the population resulting from the 2020 U.S. Census (Robertson and Willis, 2022).
12 This builds on the earlier literature that argued for dynamic decompositions to evaluate the role of different margins for unemployment fluctuations. Flow decompositions of the evolution of the unemployment rate, rather than the participation rate, have been used extensively in both the academic literature as well as for real-time analysis of the labor market for policy purposes. Most of these analyses decompose the fluctuations in unemployment into parts due to inflows (separations/job loss) and outflows (job finding). See, for example, Shimer (2005), Fujita and Ramey (2006), Elsby, Michaels, and Solon (2009), Daly, Hobijn, and Kwok (2009), and Şahin, Tasci, and Yan (2021). A smaller number of papers take into account all six labor force status flows, as we do here, for the analysis of the dynamics of unemployment. See Barnichon and Nekarda (2012) and Elsby, Hobijn, and Şahin (2015).
13 See Hobijn and Şahin (2021) for a more extensive discussion of this issue.
14 See appendix 1 for a formal discussion of the attachment wedge.
15 Two and a half years of 0.25 percentage point annual declines adds up to 0.625 percentage points.
16 Note that part of this break was already incorporated in labor force projections before 2020, and thus this is an overestimate of the impact of Covid.
17 Note that this differs from the calculation of the Federal Reserve Bank of Atlanta’s Job Calculator, which considers a target LFPR rather than a long-run negative trend in participation.
18 Employment Projections — 2021-2031, released on September 8, 2022.
19 This is in line with the January 2023 trend payroll growth estimate for 2023–33 from the Congressional Budget Office.
Appendix 1: Mathematical details
Six-flow decomposition of the participation rate
The state of the labor market can be summarized by two shares, the share of the population that is employed in month t, which we denote by Et, and the share that is unemployed, Ut. The share of nonparticipants, Nt, is simply implied by the constraint that the three shares add up to one. The transition probabilities determine the evolution of these shares according to the following two equations:i
$\text{A1})\;{{E}_{t}}=\left( 1-{{P}_{E,\text{ }U,\text{ }t}}-{{P}_{E,\text{ }N,\text{ }t}} \right){{E}_{t-1}}+{{P}_{U,\text{ }E,\text{ }t}}{{U}_{t-1}}+{{P}_{N,\text{ }E,\text{ }t}}\left( 1-{{E}_{t-1}}-{{U}_{t-1}} \right),$
and
$\text{A2})\;{{U}_{t}}=\left( 1-{{P}_{U,\text{ }E,\text{ }t}}-{{P}_{U,\text{ }N,\text{ }t}} \right){{U}_{t-1}}+{{P}_{E,\text{ }U,\text{ }t}}{{E}_{t-1}}+{{P}_{N,\text{ }U,\text{ }t}}\left( 1-{{E}_{t-1}}-{{U}_{t-1}} \right).$
For the purpose of our decomposition it is easier to write these equations in matrix form. The state of the labor market is represented by the vector
$\text{A3})\;{{s}_{t}}={{\left[ {{E}_{t}}{{U}_{t}} \right]}^{\prime }}.$
Given this definition, equations A1 and A2 can be written as$\text{A4})\;\Delta {{s}_{t}}={{s}_{t}}-{{s}_{t-1}}={{d}_{t}}+{{P}_{t}}{{s}_{t-1}},$
where
$\text{A5})\;{{d}_{t}}=\left[ _{{{P}_{N,\text{ }U,\text{ }t}}}^{{{P}_{N,\text{ }E,\text{ }t}}} \right],\text{ and }{{P}_{t}}=\left[ _{\text{ }{{P}_{E,\text{ }U,\text{ }t}}-{{P}_{N,\text{ }U,\text{ }t}}\text{ }-{{P}_{U,\text{ }E,\text{ }t}}-{{P}_{U,\text{ }N,\text{ }t}}-{{P}_{N,\text{ }U,\text{ }t}}}^{-{{P}_{E,\text{ }N,\text{ }t}}-{{P}_{E,\text{ }U,\text{ }t}}-{{P}_{N,\text{ }E,\text{ }t}}{{P}_{U,\text{ }E,\text{ }t}}-{{P}_{N,\text{ }E,\text{ }t}}} \right].$
For our decomposition we split the movements of the stocks into two parts. The first part is the changes in the long-run value of the state vector if the current flow probabilities remain unchanged. This is often referred to as the flow steady state and it is the value ${{\bar{s}}_{t}}$, for which $\Delta st=0.$ For given matrices dt and Pt, it is equal to
$\text{A6})\;{{\bar{s}}_{t}}=-P_{t}^{-1}{{d}_{t}}.$
The second part is the changes in deviations from the steady state, $\left( {{s}_{t-1}}-{{{\bar{s}}}_{t-1}} \right).$ The change in the state vector is related to these two parts as follows:
$\text{A7})\;\Delta {{s}_{t}}={{P}_{t}}\left( {{s}_{t-1}}-{{{\bar{s}}}_{t}} \right)={{P}_{t}}\left( {{s}_{t-1}}-{{{\bar{s}}}_{t-1}} \right)-{{P}_{t}}\left( {{{\bar{s}}}_{t}}-{{{\bar{s}}}_{t-1}} \right).$
Rearranging terms in equation A7, we can write the current deviation from the steady state as a function of the current change in the state vector. That is,
$\begin{align} \text{A8})\;\left( {{s}_{t}}-{{{\bar{s}}}_{t}} \right)& =\left( I+{{P}_{t}} \right)\left( {{s}_{t-1}}-{{{\bar{s}}}_{t-1}} \right)-\left( I+{{P}_{t}} \right)\left( {{{\bar{s}}}_{t}}-{{{\bar{s}}}_{t-1}} \right) \\ & =\left( I+{{P}_{t}} \right)P_{t}^{-1}\Delta {{s}_{t}}. \\ \end{align}$
This allows us to write the current change in the state as the sum of the transitional dynamics through the past change in the state and the changes in the steady state.
$\text{A9})\;\Delta {{s}_{t}}={{P}_{t}}\left( I+{{P}_{t-1}} \right)P_{t-1}^{-1}\Delta {{s}_{t-1}}-{{P}_{t}}\Delta {{\bar{s}}_{t}}.$
The final step is to attribute the changes in the steady state, i.e., $\Delta {{\bar{s}}_{t}}$ to changes in the different matrices made up of transition probabilities. For this, we use that
$\text{A1}0)\;\Delta {{d}_{t}}=-\frac{1}{2}\Delta {{P}_{t}}\left( {{{\bar{s}}}_{t}}+{{{\bar{s}}}_{t-1}} \right)-\frac{1}{2}\left( {{P}_{t}}+{{P}_{t-1}} \right)\Delta {{\bar{s}}_{t}},$
where
$\text{A1}1)\;\Delta {{d}_{t}}=\sum\limits_{s\in \left\{ E,\,U,\,N \right\}}{\,\,\sum\limits_{{s}'\in \left\{ E,\,U,\,N \right\}}{\,\frac{\partial {{d}_{t}}}{\partial {{P}_{s,\,{s}',\,t}}}\Delta Ps,\,{s}',\,t,}}\,\text{and }\Delta {{P}_{t}}=\sum\limits_{s\in \left\{ E,\,U,\,N \right\}}{\,\,\sum\limits_{{s}'\in \left\{ E,\,U,\,N \right\}}{\,\frac{\partial {{P}_{t}}}{\partial {{P}_{s,\,{s}',\,t}}}\Delta {{P}_{s,\,{s}',\,t}}}}.$
Using this we can trace the change in the steady state back to changes in the flow transitions that drive $\Delta {{d}_{t}}$ and $\Delta {{P}_{t}},$ which yields
$\text{A1}2)\;\Delta {{\bar{s}}_{t}}={{\left[ \frac{1}{2}\left( {{P}_{t}}+{{P}_{t-1}} \right) \right]}^{-1}}\left[ -\Delta {{d}_{t}}-\frac{1}{2}\Delta {{P}_{t}}\left( {{{\bar{s}}}_{t}}+{{{\bar{s}}}_{t-1}} \right) \right].$
Combining equations A9 and A12, we write the change in the state vector as the sum of transitional dynamics plus the changes in the steady state attributable to the six different flow transition probabilities,
$\text{A1}3)\;\Delta {{s}_{t}}={{P}_{t}}\left( I+{{P}_{t-1}} \right)P_{t-1}^{-1}\Delta {{s}_{t-1}}+{{P}_{t}}{{\left( {{P}_{t}}+{{P}_{t-1}} \right)}^{-1}}\left[ 2\Delta {{d}_{t}}+\Delta {{P}_{t}}\left( {{{\bar{s}}}_{t}}+{{{\bar{s}}}_{t-1}} \right) \right].$
This is a decomposition of changes in the state vector st. The labor force participation rate is
$\text{A1}4)\;LFP{{R}_{t}}={{E}_{t}}+{{U}_{t}}={{{\iota }'}_{2}}{{s}_{t}},$
where ${{\iota }_{2}}$ is the two-dimensional summation operator, i.e., a column vector with ones. The decomposition we use for the LFPRt is
$\text{A1}5)\;\Delta LFP{{R}_{t}}={{{\iota }'}_{2}}{{P}_{t}}\left( I+{{P}_{t-1}} \right)P_{t-1}^{-1}\Delta {{s}_{t-1}}+{{{\iota }'}_{2}}{{P}_{t}}{{\left( {{P}_{t}}+{{P}_{t-1}} \right)}^{-1}}\left[ 2\Delta {{d}_{t}}+\Delta {{P}_{t}}\left( {{{\bar{s}}}_{t}}+{{{\bar{s}}}_{t-1}} \right) \right].$
Attachment wedge
If those who are unemployed were as attached to the labor force as the employed, then the cyclical component would have no effect on participation. To understand this, it is important to realize that the current change in the LFPR is a distributed lag of current and past changes in the flow steady-state. Because this lag structure is complicated, we focus on the change in the flow steady-state due to changes in the job-loss and job-finding rates, which we denote by $\Delta \overline{LFPR}_{t}^{c},$ to explain the intuition for what drives the cycle component in our decomposition. We show that this equals
$\text{A1}6)\;\Delta \overline{LFPR}_{t}^{c}=-\frac{1}{{{D}_{t}}}{{\overline{LFPR}}_{t}}\left( {{{\bar{P}}}_{U,\text{ }N,\text{ }t}}-{{{\bar{P}}}_{E,\text{ }N,\text{ }t}} \right)\left( \left( 1-\bar{u}t \right)\Delta {{P}_{E,\text{ }U,\text{ }t}}-{{{\bar{u}}}_{t}}\Delta {{P}_{U,\text{ }E,\text{ }t}} \right),$
where ${{\overline{LFPR}}_{t}}$ is the flow steady-state labor force participation rate and ${{\bar{u}}_{t}}$ is the flow steady-state unemployment rate, both averaged across periods t and t − 1. Dt is the determinant of ${{\bar{P}}_{t}}={}^{1}/{}_{2}\left( {{P}_{t}}+{{P}_{t-1}} \right){{\bar{P}}_{E,\text{ }N,\text{ }t}}={}^{1}/{}_{2}\left( {{P}_{E,\text{ }N,\text{ }t}}+{{P}_{E,\text{ }N,\text{ }t-1}} \right),$ and ${{\bar{P}}_{U,\text{ }N,\text{ }t}}={}^{1}/{}_{2}\left( {{P}_{U,\text{ }N,\text{ }t}}+{{P}_{U,\text{ }N,\text{ }t-1}} \right).$ii The third and fourth terms of this expression are the ones that matter the most for the intuition of what drives the participation cycle.
The third term is the difference between the rate that unemployed and employed workers leave the labor force: $\left( {{{\bar{P}}}_{U,\text{ }N,\text{ }t}}-{{{\bar{P}}}_{E,\text{ }N,\text{ }t}} \right).$ We refer to this term as the attachment wedge. It captures the difference in the attachment to the labor force of those unemployed versus those employed. It is positive because the employed are more attached to the labor force than the unemployed, i.e., ${{\bar{P}}_{U,\text{ }N,\text{ }t}}>{{\bar{P}}_{E,\text{ }N,\text{ }t}}.$ A positive attachment wedge is necessary for a procyclical participation cycle.
The fourth term, $\left( \left( 1-{{{\bar{u}}}_{t}} \right)\Delta {{P}_{E,\text{ }U,\text{ }t}}-{{{\bar{u}}}_{t}}\Delta {{P}_{U,\text{ }E,\text{ }t}} \right),$ is the change in the flow steady-state unemployment rate due to changes in the job-loss and job-finding rates. It captures the shift in the composition of the labor force between unemployed and employed that is solely due to movements of persons between these two states and not due to movements across the participation margin.
Equation A16 is important because it shows that to understand the procyclicality of the participation rate, it is essential to study the likelihood of workers exiting the labor force rather than workers entering the labor force. This likelihood is affected by the labor force status of individuals within the labor force since there is a quantitatively important attachment wedge between the unemployed and employed.
Notes
i The estimated transition probabilities are margin adjusted, using the method in Elsby, Hobijn, and Şahin (2015) to satisfy these equations.
ii The determinant Dt is positive in all periods for the observed transition probabilities in the data.
Appendix 2: Additional Empirical Results
A1. Survey difference, scope difference, and population growth (with pre-Covid trend)
References
Aaronson, Daniel, Jonathan Davis, and Luojia Hu, 2012, “Explaining the decline in the U.S. labor force participation rate,” Chicago Fed Letter, Federal Reserve Bank of Chicago, No. 296, March, available online.
Aaronson, Stephanie, Tomaz Cajner, Bruce Fallick, Felix Galbis-Reig, Christopher Smith, and William Wascher, 2014, “Labor force participation: Recent developments and future prospects,” Brookings Papers on Economic Activity, Vol. 45, No. 2, Fall, pp. 197–255, available online.
Aaronson, Stephanie R., Mary C. Daly, William L. Wascher, and David W. Wilcox, 2019, “Okun revisited: Who benefits most from a strong economy?,” Brookings Papers on Economic Activity, Vol. 50, No. 1, Spring, pp. 333–375, available online.
Aaronson, Stephanie, Bruce Fallick, Andrew Figura, Jonathan Pingle, and William Wascher, 2006, “The recent decline in the labor force participation rate and its implications for potential labor supply,” Brookings Papers on Economic Activity, Vol. 37, No. 1, Spring, pp. 69–134, 150–154, available online.
Abraham, Katharine, and Lea Rendell, 2023, “Where are the missing workers?,” Brookings Papers on Economic Activity, Spring, forthcoming, available online.
Bach, Katie, 2022, “Is ‘long Covid’ worsening the labor shortage?,” Brookings Institution, report, January 11, available online.
Barnichon, Regis, and Christopher J. Nekarda, 2012, “The ins and outs of forecasting unemployment: Using labor force flows to forecast the labor market,” Brookings Papers on Economic Activity, Vol. 43, No. 2, Fall, pp. 83–117, available online.
Cooper, Daniel H., Christopher L. Foote, María J. Luengo-Prado, and Giovanni P. Olivei, 2021, “Population aging and the US labor force participation rate,” Current Policy Perspectives, Federal Reserve Bank of Boston, December 20, available online.
Daly, Mary, Bart Hobijn, and Joyce Kwok, 2009, “Jobless recovery redux?,” FRBSF Economic Letter, Federal Reserve Bank of San Francisco, No. 2009-18, June 5, available online.
Dubina, Kevin S., Teresa L. Morisi, Michael Rieley, and Andrea B. Wagoner, 2019, “Projections overview and highlights, 2018–28,” Monthly Labor Review, October, pp. 1–29. Crossref
Elsby, Michael, Bart Hobijn, Fatih Karahan, Gizem Koşar, and Ayşegül Şahin, 2019, “Flow origins of labor force participation fluctuations,” AEA Papers and Proceedings, Vol. 109, May, pp. 461–464. Crossref
Elsby, Michael W. L., Bart Hobijn, and Ayşegül Şahin, 2015, “On the importance of the participation margin for labor market fluctuations,” Journal of Monetary Economics, Vol. 72, May, pp. 64–82. Crossref
Elsby, Michael W. L., Ryan Michaels, and Gary Solon, 2009, “The ins and outs of cyclical unemployment,” American Economic Journal: Macroeconomics, Vol. 1, No. 1, January, pp. 84–110. Crossref
Faria e Castro, Miguel, 2021, “The COVID retirement boom,” Economic Synopses, Federal Reserve Bank of St. Louis, No. 25, October 15. Crossref
Fujita, Shigeru, and Garey Ramey, 2006, “The cyclicality of job loss and hiring,” Federal Reserve Bank of Philadelphia, working paper, No. 06-17, revised November 26, 2006, available online.
Goda, Gopi Shah, and Evan J. Soltas, 2022, “The impacts of Covid-19 illnesses on workers,” National Bureau of Economic Research, working paper, No. 30435, September. Crossref
Hobijn, Bart, 2022, “‘Great Resignations’ are common during fast recoveries,” FRBSF Economic Letter, Federal Reserve Bank of San Francisco, No. 2022-08, April 4, available onlineHobijn, Bart, and Ayşegül Şahin, 2021, “Maximum employment and the participation cycle,” paper prepared for the 2021 Economic Policy Symposium, hosted by the Federal Reserve Bank of Kansas City, Jackson Hole, WY, August 3, available online.
Hornstein, Andreas, Marianna Kudlyak, and Annemarie Schweinert, 2018, “The labor force participation rate trend and its projections,” FRBSF Economic Letter, Federal Reserve Bank of San Francisco, No. 2018-25, November 19, available online.
Nie, Jun, and Shu-Kuei X. Yang, 2021, “What has driven the recent increase in retirements?,” Economic Bulletin, Federal Reserve Bank of Kansas City, August 11, available online.
Reinhart, Carmen M., and Kenneth S. Rogoff, 2009, This Time Is Different: Eight Centuries of Financial Folly, Princeton, NJ: Princeton University Press. Crossref
Robertson, John, and Jonathan Willis, 2022, “Assessing recent labor market improvement,” Policy Hub: Macroblog, Federal Reserve Bank of Atlanta, March 1, available online.
Şahin, Ayşegül, Murat Tasci, and Jin Yan, 2021, “Unemployment in the time of COVID-19: A flow-based approach to real-time unemployment projections,” National Bureau of Economic Research, working paper, No. 28445, February. Crossref
Shimer, Robert, 2005, “The cyclical behavior of equilibrium unemployment and vacancies,” American Economic Review, Vol. 95, No. 1, March, pp. 25–49. Crossref
Summers, Lawrence H., 1986, “Why is the unemployment rate so very high near full employment?,” Brookings Papers on Economic Activity, Vol. 17, No. 2, Fall, pp. 339–383, available online.
Thompson, Daniel, 2022, “Did COVID-19 change retirement timing? Pandemic disrupted labor markets but had modest impact on retirement timing,” America Counts: Stories Behind the Numbers, U.S. Census Bureau, September 19, available online.
Van Zandweghe, Willem, 2012, “Interpreting the recent decline in labor force participation,” Economic Review, Federal Reserve Bank of Kansas City, Vol. 97, First Quarter, pp. 5–34, available online.


