

Introduction and summary
Productivity growth is central to macroeconomics: It is an essential measure of technological progress, drives increases in living standards, and is an important factor for inflationary pressures. Unfortunately, productivity growth is not easy to measure, especially in a timely manner. As a result, only two data releases provide prompt information about productivity growth in the United States. The Bureau of Labor Statistics (BLS) publishes quarterly estimates of labor productivity for six major industries, most notably the nonfarm business sector, as part of its Productivity and Costs release, and the Federal Reserve Bank of San Francisco provides quarterly estimates of total factor productivity (TFP) for the business sector.1
Neither of these releases contains information at a high level of industry detail. Instead, industry-level productivity data are published with a substantial delay and at an annual frequency. For example, the annual data on Productivity and Costs by Industry are published by the BLS more than three months after the end of the reference year. Yet, having timely high-frequency data on productivity growth at the relevant level of industry detail is crucial to gauge cyclical movements and long-run trends of the economy in real time.
In this article, we introduce a data set to fill this gap: the Quarterly Industry Labor Productivity data (QILP), which is available on the Federal Reserve Bank of Chicago’s website. It contains timely quarterly measures of growth in output per hour, often referred to as average labor productivity (ALP), for 87 industries, starting from 2006. The industry detail conforms to that provided in the Bureau of Economic Analysis’ (BEA) GDP by industry data. The ALP measure that we construct is consistent with that used in the BLS’s Productivity and Costs release. The data is timely in that it can be compiled using information available less than three months after the end of the reference quarter, when the final GDP release for that quarter is published.
We use these data to uncover three new facts on U.S. nonfarm private ALP growth since the start of the Covid-19 pandemic (in the first quarter of 2020), compared with the 12 years before the pandemic (2008–19). The first fact relates to average labor productivity growth in the nonfarm private sector. After moving well above the pre-Covid trend during the pandemic and then slightly dropping in 2022 and 2023, average labor productivity was running above its pre-Covid trend by the end of 2023 and beginning of 2024. This is illustrated in figure 1, which shows ALP in the U.S. nonfarm private sector from our data set, as well as its pre-Covid trend, from 2008 to 2019 and extended through 2024:Q2.
1. Average labor productivity (ALP) in the U.S. nonfarm private sector
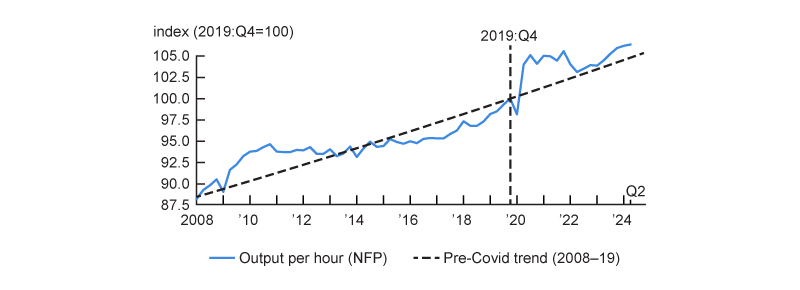
Sources: U.S. Bureau of Labor Statistics, U.S. Bureau of Economic Analysis, and authors’ calculations.
Our disaggregated industry-level data reveal the second fact. Since the fourth quarter of 2019, labor productivity growth has been driven by a markedly different group of industries than before the pandemic. In addition, it has been much more unevenly distributed across industries. In particular, the engine of productivity growth has shifted toward computer systems design, other (online) retail, data processing, management of companies, and professional, scientific, and technical services, as well as housing.
The third and final fact is that most of the movements in ALP since the onset of the pandemic are due to variations in productivity growth at the industry level. In contrast, the shift in economic activity away from in-person services during the pandemic has had a limited impact on aggregate productivity. However, this shift has slightly alleviated the long-run drag on overall productivity due to structural change in the economy.
Before we cover these facts in more detail, we discuss how we construct our timely, quarterly industry-level ALP measures in the next section. We then provide evidence on the post-pandemic shift in the main industry drivers of productivity growth. Finally, we quantify the impact of changes in the industry-level decomposition of economic activity on the aggregate level of labor productivity growth.
Output and hours measures and aggregation across industries
In this section, we briefly describe how we construct our data set. Our methodology builds on Eldridge and Price (2006) and Gordon and Sayed (2022). The concept of ALP that we construct is as close as possible to that of the Productivity and Costs release, given the data availability constraints. The resulting data are quarterly measures of ALP growth for all industries in the U.S. nonfarm private sector (NFP) from 2006:Q1 onward.
Starting in 2006:Q1, we compute hourly output growth for each quarter in the industries for which quarterly data on output, measured as value added, are available in the BEA’s GDP by Industry release. Since this release is consistent with the aggregate statistics underlying U.S. GDP, the measures of value added we use cover all economic activity in the United States. We exclude the agricultural sector from our data because productivity in this sector is hard to interpret due to fluctuations in weather and inaccurate measures of hours worked. We also exclude the government sector because its output is imputed as the sum of the inputs, so that the measured total productivity growth is equal to zero by construction. What we are left with are measures for all industries that are part of the nonfarm private sector.2
Value added and hours by industry
We directly use quarterly industry-level measures of seasonally adjusted, real value added and the corresponding price indexes from the BEA’s GDP by Industry release. By combining these two measures, we can also calculate the nominal value added. To align our hours measure closely with the BLS’s Productivity and Costs release, we construct hours worked by both payroll employees and the self-employed in each industry each quarter. We begin by aggregating non-seasonally-adjusted payroll employment data from the Current Employment Statistics (CES, also known as the Payroll Survey) and the number of self-employed workers from the Current Population Survey (also known as the Household Survey). This gives an estimate of total employment in the industry. We then convert this employment estimate into a non-seasonally-adjusted hours estimate by multiplying it by the average weekly hours of all employees.3 Finally, we seasonally adjust this total hours measure for use in our analysis.
We approximate growth rates by log changes—a common practice in the literature, e.g., the quarterly total factor productivity measure from the Federal Reserve Bank of San Francisco. That is, we calculate the quarterly growth rate of ALP in industry in quarter as
\[{\unicode{x0394}} \ln {ALP_{it}} = {\unicode{x0394}} \ln {V_{i,t}} − {\unicode{x0394}} \ln {H_{it,}}\]
where and denote real value added and total hours of industry in quarter , respectively. We calculate ALP growth rates for all industries in the data at the lowest available level of aggregation.4
Aggregation
For sectors that group industries, we construct high-level growth measures by aggregating the growth rates for the corresponding industries. We calculate real value-added growth at higher levels of aggregation, ${\unicode{x0394}}\; \text{ln} \;V_{t,}$ using a Törnqvist index,5
$1) {\quad}{\unicode{x0394}} \ln \,{{V}_{t}}=\sum\limits_{i=1}^{I}{s_{it}^{V}}{\unicode{x0394} \ln \,\,{{V}_{it}}},$
where the weights are the average nominal value-added shares $s_{it}^{V}$ of each industry over quarters and . Analogously, we also use a Törnqvist index to calculate hours growth at higher levels of aggregation, ${\unicode{x0394}}\; \text{ln} \;H_{t,}$. The weights in this case, $s_{it}^{H},$ are the average total hours shares over quarters t − 1 and t for each industry,
$2) {\quad}{\unicode{x0394}} \ln \,{{H}_{t}}=\sum\limits_{i=1}^{I}{s_{it}^{H}\unicode{x0394} \ln \,\,{{H}_{it}}.}$Finally, we combine equations 1 and 2 to obtain aggregate ALP growth,
$3) {\quad} {\unicode{x0394}} \ln \,{ALP_t} ≡ {\unicode{x0394}}\, \ln {V_t} − {\unicode{x0394}}\, \ln\, {H_t}.$The resulting estimate of aggregate ALP growth in the U.S. nonfarm private sector in equation 3 is plotted in figure 2. The figure also includes the headline measure of ALP growth in the nonfarm business sector, published as part of the BLS’s Productivity and Costs release. As can be seen in the figure, our measure of ALP growth closely aligns with the headline number from that release. Thus, at the aggregate level, our data are largely comparable with the most commonly analyzed headline statistic on ALP growth.
2. Average labor productivity (ALP) growth, nonfarm business and nonfarm private sectors
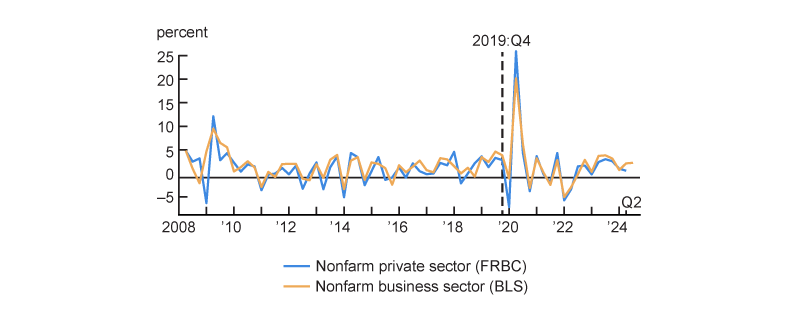
Sources: U.S. Bureau of Labor Statistics, U.S. Bureau of Economic Analysis, and authors’ calculations.
Industry drivers of aggregate productivity growth
One of the main benefits of our data set is that it allows us to consider which industries contribute the most to aggregate labor productivity growth. In particular, we compare industry contributions to labor productivity growth during the pre-pandemic period, 2008:Q1–2019:Q4, and the post-pandemic period, 2020:Q1–2024:Q2.6 We use the start of the pandemic as a cut-off point for two main reasons. The first is that the spread of Covid-19 in the spring of 2020 required many businesses to reevaluate their production processes, supply chains, and modes of operation. Many in-person services had to close, and businesses had to consider different ways of delivering their services to their customers. In the restaurant sector, for example, this has led to a greater reliance on take-out food deliveries rather than in-restaurant dining. During the pandemic, the productivity of in-person service industries was abysmal (Fernald and Li, 2022). As the pandemic faded, the new practices and technologies adopted may have boosted productivity growth, similar to war-induced productivity surges (Comin and Hobijn, 2011). The second reason is that in recent years, new AI (artificial intelligence) technologies have emerged with the potential to have a substantial and prolonged impact on aggregate productivity growth, similar to several general purpose technologies (GPT) in the past (Jovanovic and Rousseau, 2005). Both of these narratives have direct implications for industry-level productivity growth.
Figure 3 shows the average annual percentage point contribution to aggregate productivity growth by industry before and after the start of the pandemic.7 The industries are ordered from those that contributed the most to aggregate productivity growth before the pandemic to those that contributed the least. From 2008 through 2019, broadcasting and telecommunications; oil and gas extraction; computer and electronics products; credit intermediation and related activities; data processing, internet publishing, and other information services; and other retail were the biggest contributors to aggregate labor productivity growth, together contributing more than half a percentage point to ALP growth. The most negative contributions came from chemical products; food and beverage and tobacco products; and construction (Goolsbee and Syverson, 2022).
3. Contributions to ALP growth by industry before and after 2020
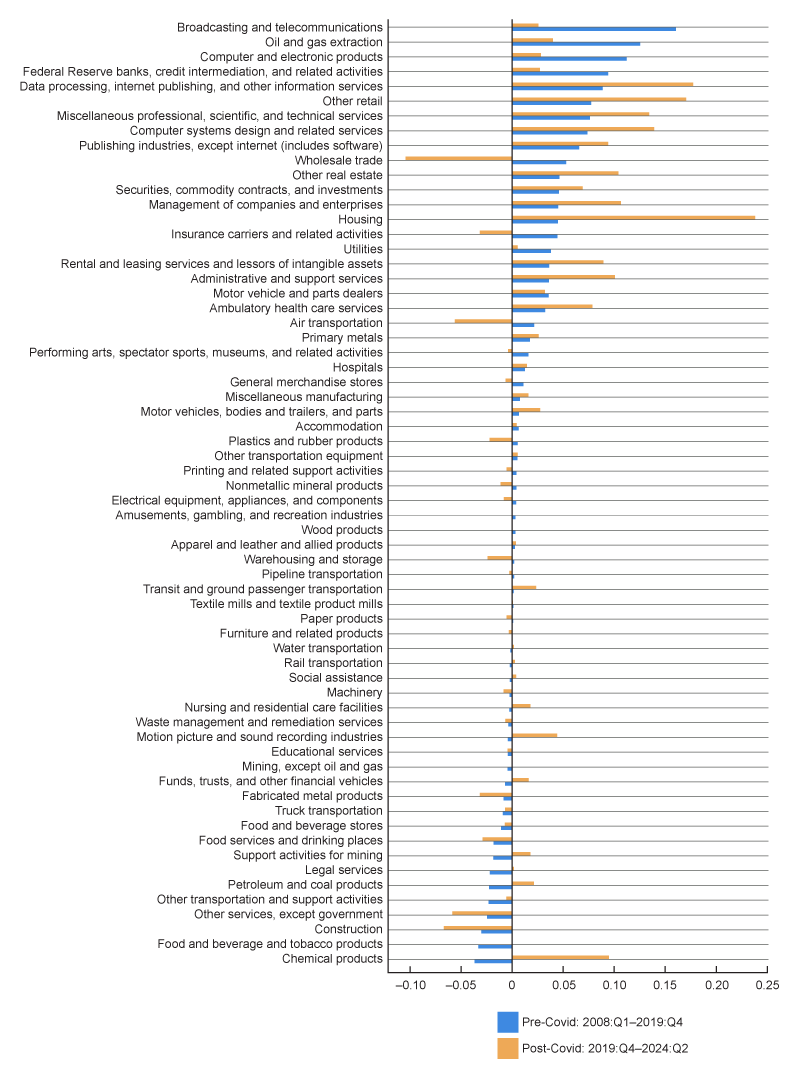
Sources: U.S. Bureau of Economic Analysis, U.S. Bureau of Labor Statistics, and authors’ calculations.
When comparing the industry contributions to aggregate ALP growth since the pandemic (represented by orange bars in figure 3) with those in the pre-pandemic period (shown in blue), we find that the set of industries driving this labor productivity growth since 2019 has changed a lot from before 2020. The primary contributors to aggregate ALP growth post-2020 are housing; data processing, internet publishing, and other information services; computer systems design and related services; other retail (including online retailers); and miscellaneous professional, scientific, and technical services. Many of these industries are central to the adoption of AI technologies and the transition to online retail. For instance, AI in "other retail" (mostly online) has been mostly applied to make product suggestions based on a consumer’s history of clicks and time spent on webpages. While the rise of AI adoption may help explain this change in sectoral productivity growth, and is consistent with the evidence presented in Babina et al. (2024), a detailed exploration of the factors driving productivity at the sector level is outside the scope of this article.8
A notable feature of figure 3 is that U.S. labor productivity growth since the pandemic is much more unequally distributed across industries. Figure 4 illustrates this fact. For each period, we order industries from the lowest to highest in terms of their contributions to aggregate productivity growth per share of value added. We then plot their cumulative contributions to ALP growth against their cumulative shares in value added. The blue line in the figure corresponds to the pre-Covid period, and the orange line corresponds to the post-Covid period.
4. Cumulative contribution to ALP annual growth as share of economic activity
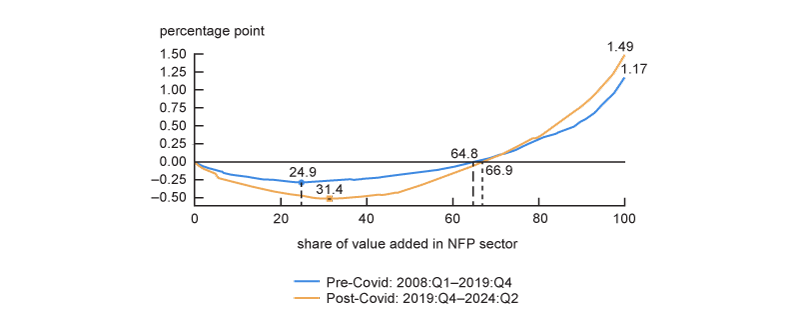
Sources: U.S. Bureau of Economic Analysis, U.S. Bureau of Labor Statistics, and authors’ calculations.
What sets productivity growth since 2019:Q4 apart from the pre-Covid period is not just the change in the industries driving it, as shown in figure 3, but also how much more unequal productivity growth is across industries. The blue line reveals that from 2008 to 2019, one quarter (24.9%) of total value added came from industries with negative average productivity growth.9 In contrast, the orange line in figure 4 shows that, since 2019:Q4, 31.4% of value added has come from industries with declining productivity, primarily in wholesale trade, insurance, and transportation. This shift highlights that U.S. productivity gains have become less widespread in the past four years compared to the 14 years before the pandemic. Moreover, the orange line in the figure also bottoms out lower than the blue line. This reflects larger disparities in labor productivity growth rates across industries post-2020 than before.
Despite this higher degree of cross-sectoral inequality, the total contributions of industry-level improvements in labor productivity have been larger during the post-pandemic period than they had been prior to the pandemic. This is evident when we compare the endpoints of the lines in figure 4. They show that industry-level labor productivity growth contributed 1.17 percentage points to aggregate labor productivity growth before the pandemic and 1.49 percentage points in the post-Covid period.
One remaining question is to identify the sources of ALP growth of industries that are central to the development, adoption, and implementation of AI and online retail, which have been driving labor productivity growth since 2020. Are these sectors increasing labor productivity because they invest relatively more than other sectors or because they are the most productive using the resources they have in place? Unfortunately, answering this question would require quarterly investment and capital data at the industry level that are not available.10 The quarterly total factor productivity (TFP) data published by the Federal Reserve Bank of San Francisco allow us to shine some light on this question, but only for the U.S. business sector as a whole.
These data allow us to decompose ALP growth in the business sector into three parts: total factor productivity (TFP) growth, capital deepening, and changes in labor quality,
$4) {\quad}\ln AL{{P}_{t}}=\underbrace{\unicode{x0394} \ln {{Z}_{t}}}_{\text{TFP}\,\text{growth}}+\unicode{x03B1} \,\,\,\underbrace{\unicode{x0394} \ln \left( \frac{{{K}_{t}}}{{{H}_{t}}} \right)}_{\text{Capital deepening}}+\left( 1-\unicode{x03B1} \right)\underbrace{\unicode{x0394} \ln {{Q}_{t}}}_{\text{Labor quality growth}}.$ Here α is the capital elasticity of output, estimated as one minus the revenue share of labor, assuming that there are no markups. Figure 5 shows the results from this decomposition. These results indicate that the acceleration of labor productivity growth in 2023 is mostly attributable to an increase in TFP growth. The contribution of TFP growth to aggregate ALP growth has increased from −2.8 annualized percentage points in 2022:Q2 and 2022:Q3 to 1.3 annualized percentage points in 2024:Q2—an unusually large swing in TFP growth over our sample period. But the figure also reveals that TFP growth fluctuates a lot on a quarter-to-quarter basis. Thus, it remains uncertain whether this last rebound in TFP growth is the start of a lasting acceleration in productivity growth or just a temporary boost to TFP.
5. Sources of ALP growth in the business sector
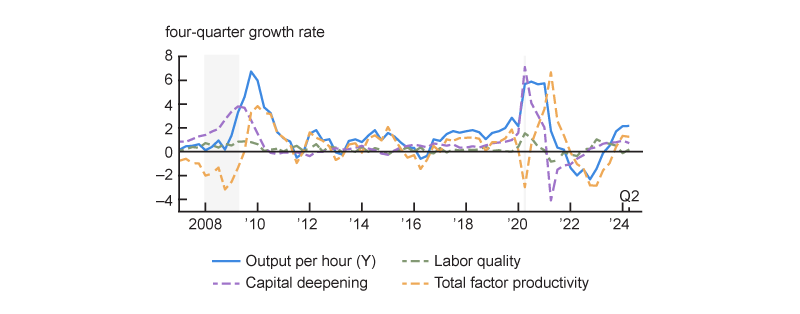
Sources: Federal Reserve Bank of San Francisco and authors’ calculations.
Impact of shifts in industry composition of economic activity
The industry-level contributions to productivity growth on which we focused in the previous section are by far the most important for aggregate productivity growth. Changes in the industry composition of value added and hours have played only a minor role. To make this statement precise, we follow Nordhaus (2002) and decompose ALP growth into pure productivity growth and industry composition shifts.
ALP growth decomposition: Pure productivity growth, Baumol and Denison effects
We use equations 1 and 2 to decompose aggregate ALP growth into three components:
$5){\quad}\Delta \ln AL{{P}_{t}}\equiv \Delta \ln {{V}_{t}}-\Delta \ln {{H}_{t}} \\ \hspace{53 pt} =\underbrace{\sum\limits_{i=1}^{I}{s_{i0}^{V}\Delta \ln AL{{P}_{it}}}}_{\text{Pure Productivity Growth}}+\underbrace{\sum\limits_{i=1}^{I}{\left( s_{it}^{V}-s_{i0}^{V} \right)\Delta \ln AL{{P}_{it}}}}_{\text{Baumol's }\text{ Effect}}+\underbrace{\sum\limits_{i=1}^{I}{\left( s_{it}^{V}-s_{it}^{H} \right)\left( \Delta \ln {{H}_{it}}-\Delta \ln {{H}_{t}} \right)}}_{\text{Denison's }\text{ Effect}}. \\$Nordhaus (2002) calls the first term on the right-hand side of equation 5 pure productivity growth, because it quantifies the part of aggregate ALP growth that is due to the growth in ALP at the industry level, keeping the composition of economic activity—the distribution of value added—constant at its base period (t = 0).
The other two terms capture the impact on aggregate ALP growth of changes in the composition of value added and ALP across industries. Because these changes are most often discussed in terms of their long-run trends, we interpret the difference between the actual ALP growth rate and the pure productivity growth effect as a measure of the impact of structural change. It is worth mentioning, however, that this difference also has a notable cyclical component. Our data set is especially suitable to quantify this cyclical component because it is the only one available with quarterly data on ALP growth at a detailed industry level.
The second term in equation 5 quantifies the part of aggregate ALP growth that is due to the change in the composition of economic activity between the base period and quarter t. This term accounts for the reallocation of production over time toward sectors with different labor productivity growth rates. It is negative if value added shifts over time toward sectors that have relatively low productivity growth. This term is often referred to as the Baumol effect, after a classic paper by Baumol and Bowen (1965) that argues that economic development is accompanied by a long-run drag on productivity growth by a shift in activity from high-productivity growth sectors (e.g., manufacturing) to low-productivity growth sectors (e.g., the performing arts).
The final term in equation 5 accounts for the reallocation of working hours toward sectors with different labor productivity levels. It is negative if hours grow disproportionately in industries with low value-added per hour. This term is often referred to as the Denison effect, after Denison (1967), who first argued that the input shift from low-productivity sectors (e.g., agriculture) to high-productivity sectors (e.g., industry) would raise aggregate productivity even if the productivity growth rates in both sectors were the same.
Decomposing U.S. ALP Growth, 2006–24
We implement Nordhaus (2002)’s decomposition from equation 5 to our sectoral data to show that pure productivity growth is the main driver of U.S. ALP growth in this period. Figure 6 depicts the index of the level of ALP in the NFP sector already shown in figure 1, together with two additional indexes. The orange line takes out the Denison effect, and the green line also takes out the Baumol effect.
6. Importance of reallocation for nonfarm private sector ALP growth
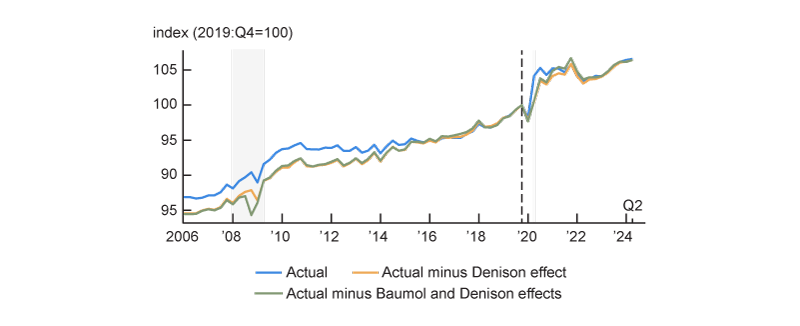
Sources: U.S. Bureau of Economic Analysis, U.S. Bureau of Labor Statistics, and authors’ calculations.
The difference between the orange and green lines thus reflects the Baumol effect, highlighting the impact of shifts in the composition of value added toward industries with lower ALP growth on aggregate productivity growth. This impact has been minimal both before and after 2020, because there is no discernible correlation between a sector’s productivity growth and the change in its value-added share. Panel A of figure 7 illustrates this pattern for the pre-Covid period. It plots the shift in value added, as measured by the average minus the initial value-added share of a sector, as a function of the sector’s average ALP growth. Clearly, economic activity, as measured in terms of the value of production, has not significantly shifted toward sectors with lower productivity growth.
7. Structural change contribution to ALP growth slowdown
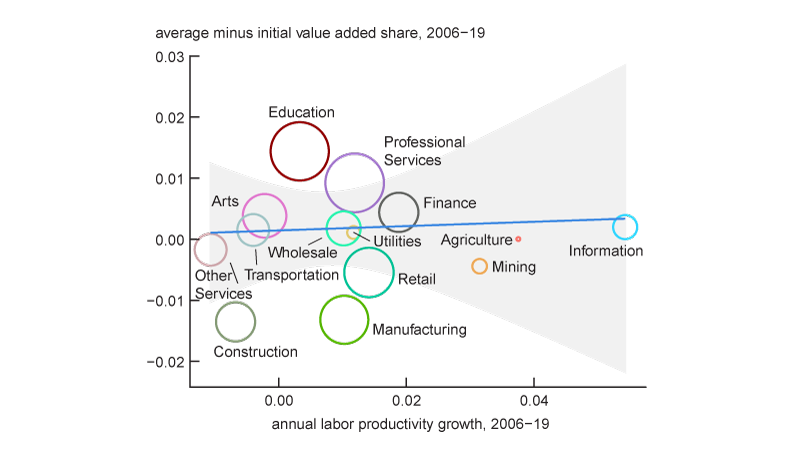
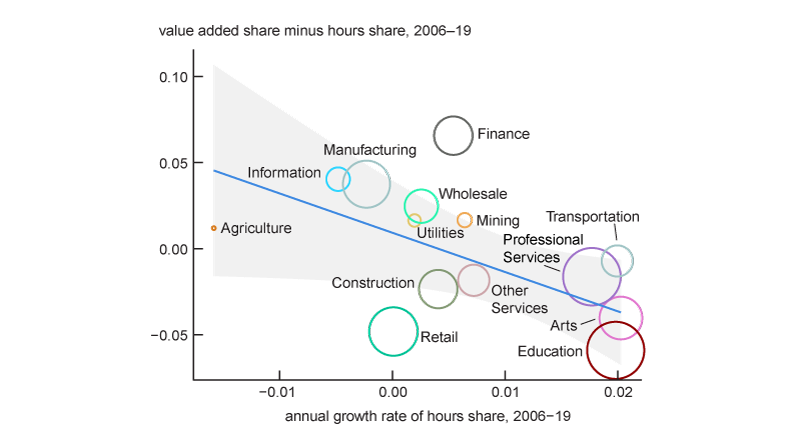
Sources: U.S. Bureau of Economic Analysis, U.S. Bureau of Labor Statistics, and authors’ calculations.
What has happened instead is that hours have shifted toward sectors with lower nominal value-added per hour. As we explained in our discussion of equation 5, this is captured by the Denison effect. Before 2020, the Denison effect was on average a 0.2 percentage point drag on U.S. labor productivity growth. Panel B of figure 7 illustrates that this was largely driven by disproportionate growth of hours in education and arts and leisure, which have relatively low value-added per hour worked, and by lower than average hours growth in the high-productivity sectors of information and manufacturing. Since 2020, the shift in composition of hours has had only a very small impact on average productivity growth. This reduced drag from the Denison effect since 2020 explains why average aggregate productivity growth before and after 2020 is the same, despite the industry-specific contributions being smaller since the pandemic, as illustrated in figure 4.
The other fact that stands out from figure 6 is that the shift in economic activity and reallocation of labor during the Covid pandemic only accounted for a small part of the increase and subsequent decline in aggregate productivity. That is, the reallocation-adjusted green line, which excludes the Baumol and Denison effects, shows only a slightly smaller runup and decline than the actual blue line. This suggests that the cyclical response of ALP growth around Covid, which has been emphasized in several studies (e.g., Fernald and Li, 2023) was not driven by disproportionate job losses in sectors with low value-added per hour. This is consistent with the evidence that, except for the restaurant sector, the degree of reallocation during the pandemic was not much higher than in other downturns (David, 2021).
Overall, we find that the reallocation of economic activity and hours across industries plays a relatively minor role in both the trend and the cyclical fluctuations of aggregate labor productivity in the nonfarm private sector.
Conclusion
We introduce a new data set that provides timely quarterly estimates of labor productivity growth at a high level of industry detail, compatible with that published as part of the BEA’s GDP by Industry release. These data are useful because they allow us to gauge industry-level sources of aggregate labor productivity growth and the importance of labor reallocation across sectors for productivity growth in both the long run and over the business cycle.
We uncover three important facts when comparing U.S. average labor productivity growth in the period 2008–19 with that in the period 2020–24. The first fact is that ALP is running above its trend from the earlier period. Second, productivity growth has been more unequal across industries since 2020 than before. Third, prior to 2020, shifts in employment and hours toward sectors with lower value-added per hour negatively impacted aggregate productivity growth. Since 2020, however, these shifts have not significantly affected average productivity growth.
We thank Spencer Krane, Gustavo de Souza, and research and policy participants at the Federal Reserve Bank of Chicago for their comments and Craig Epstein and Kavitya Sarma for their excellent research assistance.
Notes
1 Our data set is most closely related to the data used in Fernald et al. (2024).
2 The headline quarterly ALP measure from the Bureau of Labor Statistics covers the nonfarm business sector (NFB) instead. The difference between NFP and NFB is government enterprises, which are included in the latter, and nonprofit institutions serving households, which are included in the former.
3 Unlike the hours data in the Productivity and Costs release, our hours estimate is not corrected for the difference between hours worked and hours paid, as the relevant adjustment factors are not published by the BLS.
4 Our data splices two versions of the BEA data. The seam quarter is 2018:Q1. Because of changes in industry definitions, we exclude that quarter from all our calculations.
5 The Törnqvist index, also called the Törnqvist-Theil index, is used to calculate the relative change in the aggregate volume of multiple goods or services between two time periods.
6 Though our data starts in 2006, we use 2008–19 as the comparison period to cover similar stages of the business cycle as from 2020–24, namely from the onset of a recession to the latter stages of the following expansion.
7 The contribution for industry i is calculated as the average of $s_{i,t}^{V}d\ln AL{{P}_{i,t}}$ over the periods 2008:Q1–2019:Q4 and 2020:Q1–2024:Q2. The figure contains the 66 industries in our data at the lowest level of aggregation.
8 These industries also facilitate working from home for many employees. However, our analysis indicates that changes in industry-level productivity growth and their contributions to aggregate productivity growth are not significantly correlated with the share of workers in occupations conducive to remote work. We do not provide the specifics of these findings here, as they were derived using the same methodology at a finer level of industry aggregation as reported in Fernald et al. (2024), which reached similar conclusions.
9 The x-axis in figure 4 is the cumulative value-added share, and the y-axis is the cumulative annual average contribution to ALP growth, as industries are ranked from the lowest to highest contributors to ALP growth. For instance, in the pre-Covid period, plotted as the blue line, we find the industry with the smallest positive contribution to ALP growth at the 25th percentile of value added. This is why the cumulative ALP growth starts to increase from this point onward.
10 Capital stock data and total factor productivity growth estimates for the industries in our data are available annually but are released with a substantial delay in the Integrated BEA GDP-BLS Productivity Account. As of July 2024, these data are only available through 2022 and do not cover the productivity rebound back to trend.
References
Aaronson, Daniel, and Daniel Sullivan, 2001, “Growth in worker quality,” Economic Perspectives, Federal Reserve Bank of Chicago, Vol. 25, Fourth Quarter, pp. 53–74, available online.
Babina, Tonia, Anastassia Fedyk, Alex He, and James Hodson, 2024, “Artificial intelligence, firm growth, and product innovation,” Journal of Financial Economics, Vol. 151, article 103745, January. Crossref
Baumol, W. J., and W. G. Bowen, 1965, “On the performing arts: The anatomy of their economic problems,” American Economic Review, Vol. 55, No. 1/2, March, pp. 495–502, available online.
Comin, Diego, and Bart Hobijn, 2011, “Technology diffusion and postwar growth,” in NBER Macroeconomics Annual 2010, Daron Acemoglu and Michael Woodford (eds.), Vol. 25, Chicago: University of Chicago Press, pp. 209–246. Crossref
David, Joel M., 2021, “Has Covid-19 been a ‘reallocation recession’?” Chicago Fed Letter, Federal Reserve Bank of Chicago, No. 452, March. Crossref
Denison, Edward F., 1967, “Sources of postwar growth in nine western countries,” American Economic Review, Vol. 57, No. 2, May, pp. 325–332, available online.
Eldridge, Lucy P., and Jennifer Price, 2006, “Measuring quarterly labor productivity by industry,” Monthly Labor Review, June, available online.
Fernald, John, 2014, “A quarterly, utilization-adjusted series on total factor productivity,” Federal Reserve Bank of San Francisco, working paper, No. 2012-19, revised April 1, 2014. Crossref
Fernald, John, Ethan Goode, Huiyu Li, and Brigid Meisenbacher, 2024, “Does working from home boost productivity growth?,” FRBSF Economic Letter, Federal Reserve Bank of San Francisco, No. 2024-02, January 16, available online.
Fernald, John, and Huiyu Li, 2023, “Productivity in the world economy during and after the pandemic, “Federal Reserve Bank of San Francisco, working paper, No. 2023-29, September. Crossref
Fernald, John, and Huiyu Li, 2022, “The impact of COVID on productivity and potential output,” Federal Reserve Bank of San Francisco, working paper, No. 2022-19, September. Crossref
Goolsbee, Austan, and Chad Syverson, 2022, “The strange and awful path of productivity in the US construction sector,” in Technology, Productivity, and Economic Growth, Susanto Basu, Lucy Eldridge, John Haltiwanger, and Erich Strassner (eds.), National Bureau of Economic Research Studies in Income and Wealth, Vol. 83, Chicago: University of Chicago Press, chapter 4, available online.
Gordon, Robert J., and Hassan Sayed, 2022, “A new interpretation of productivity growth dynamics in the pre-pandemic and pandemic era U.S. economy, 1950–2022,” National Bureau of Economic Research, working paper, No. 30267, July. Crossref
Jovanovic, Boyan, and Peter L. Rousseau, 2005, “General purpose technologies,” in Handbook of Economic Growth, Philippe Aghion and Steven N. Durlauf (eds.), Vol. 1B, pp. 1181–1224. Amsterdam: Elsevier / North Holland. Crossref
Nordhaus, William D., 2002, “Productivity growth and the new economy,” Brookings Papers on Economic Activity, Vol. 33, No. 2, pp. 211–265, available online.


