Introduction and summary
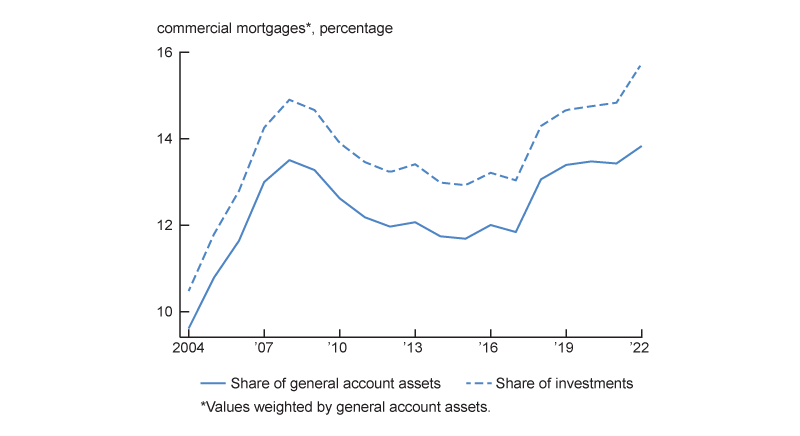
Life insurers have significant exposure to commercial real estate (CRE) primarily through direct mortgage lending and commercial mortgage-backed securities (CMBS). These investments help life insurers match their long-duration liabilities with long-duration assets. As of 2022:Q4, commercial mortgages in life insurers’ portfolios stood at $600 billion, and hence, were their third-largest asset class, accounting for about 16% of the insurers’ total investments and about 14% of general account assets (figure 1).1 Life insurers are also indirectly exposed to CRE through their investments in CMBS, which stood at about $170 billion in 2022:Q4. Recent developments in the CRE market, such as the shift to more people working from home following the Covid-19 pandemic resulting in lower demand for office space, as well as higher interest rates, have put pressure on commercial property values. Given their significant CRE exposures, life insurers could potentially experience significant losses if CRE prices deteriorate.
1. Life insurers’ commercial mortgage exposure
In this article, we provide a comprehensive and detailed analysis of life insurers’ CRE exposures and their implications for financial stability.2 For this purpose, we analyze the geographic concentration of CRE mortgage lending by life insurers. We then provide a scenario analysis, in which we estimate losses based on property price forecasts from the commercial real estate industry. Lastly, we assess insurers’ stock responses around two events in the banking sector that raised concerns about CRE exposures.
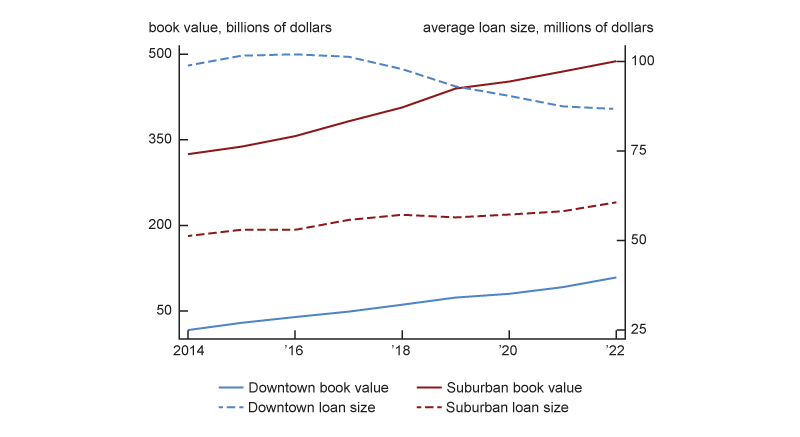
We start with documenting that life insurers extend commercial mortgages primarily to suburban locations ($488 billion) rather than for commercial buildings in central business districts (about $109 billion).3 The exposure is also not overly concentrated in large metropolitan areas. For instance, life insurers’ exposure to New York/ Manhattan is $40 billion. More generally, we show that life insurers’ CRE mortgage portfolios exhibit a high degree of geographical diversification. We also document that current and at origination loan-to-value (LTV) ratios are low for CRE mortgages compared to those for residential mortgages.
Life insurers are also exposed to CRE through their $170 billion CMBS holdings. About 80% of life insurers’ CMBS holdings are senior (AAA-rated) tranches; life insurers rarely invest in below investment-grade CMBS tranches. Next, we document that the CRE exposure life insurers gain through CMBS is systematically different from their own commercial mortgage underwriting. Specifically, while mortgages in CMBS are also mostly in suburban locations, the downtown exposure of CMBS is strongly tilted toward office buildings. In addition, the LTV of the mortgages in CMBS is on average higher than that of the commercial mortgages underwritten by insurers. These differences suggest that despite investing in highly rated CMBS tranches, life insurers could potentially incur losses from their CMBS holdings.
Next, we conduct a scenario analysis in which we use projected declines in CRE prices as a “shock” and consider widespread strategic default of borrowers.4 Specifically, we use projections of changes in prices by geography and property type between 2020 and 2025 from Global Commercial Real Estate Services (CBRE). We then assume that all loans default, capturing the fact that recently borrowers walked away from properties with negative cash flow or equity well before maturity, and calculate life insurer losses as the amount of mortgage balances in excess of the shocked property price.5
In this scenario analysis, we estimate that life insurers would suffer a $10 billion loss from their commercial mortgage portfolios. The average loss is about 1.1% of capital, with more than one quarter of life insurers experiencing no losses. With few exceptions, insurers’ losses are less than 10% of their capital.
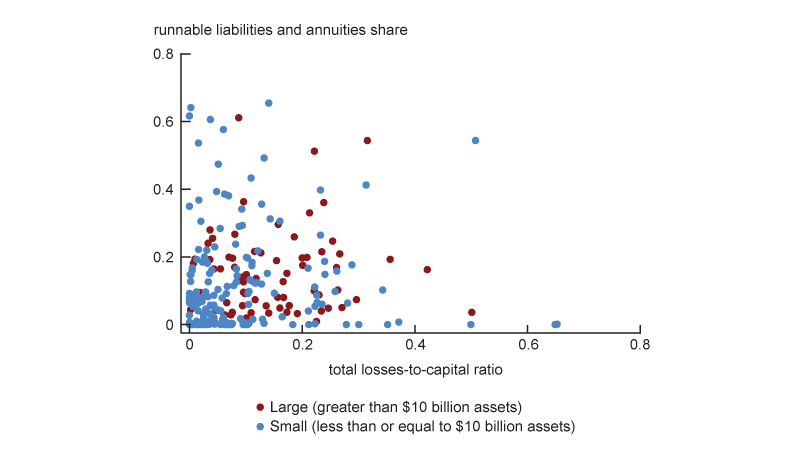
To shed light on whether losses stemming from life insurers’ commercial loan portfolio could result in significant funding disruptions for life insurers, we also consider run risk. Specifically, we assess whether life insurers with large estimated losses in the scenario analysis also have a large share of runnable liabilities, defined as annuities that can be surrendered without penalty and nontraditional liabilities.6 We find that only two large (greater than $10 billion in assets) life insurers have losses over 5% of their capital and a share of runnable liabilities of over 50%.
Next, we consider losses from life insurers’ CMBS holdings. We obtain CUSIP-level price data from the Financial Industry Regulatory Authority’s Trade Reporting and Compliance Engine (TRACE).7 To estimate CMBS-related losses, we take the lowest quarterly average price for each CUSIP (a code that identifies individual financial securities) between 2021:Q1 and 2024:Q1 to account for the possibility of runs and fire sales. The main reason for this assumption is that the lowest price over this period likely captures the price floor of these securities and hence, will provide an upper bound for losses. With this assumption, we estimate that life insurers would suffer about $26.3 billion in losses from their CMBS holdings, mostly driven by the interest rate environment rather than credit losses. We find that CMBS-related losses would exceed 15% of capital for several large insurers.
Combining estimated commercial mortgage and CMBS holding losses amount to about $36.3 billion in total losses. We find that under our price scenario five large insurers—insurers with $10 billion assets or more—would experience losses of more than 20% of their adjusted capital, and several insurers may face heightened regulatory scrutiny and have to raise capital. However, most insurers with large estimated losses have only a small share of runnable liabilities, mitigating concerns about potential runs triggered by CRE-related losses.
To further investigate concerns about life insurers’ solvency stemming from CRE-related concerns, we assess whether financial market participants expected life insurers to suffer large losses due to their CRE exposure. We analyze two specific episodes that highlighted problems in the CRE space: the failure of Silicon Valley Bank (SVB) and the earnings announcement of New York Community Bancorp (NYCB), in which the parties reported large losses from commercial real estate loans. Life insurers with larger CRE exposure or large losses in the scenario analysis did not have more negative stock returns, suggesting that market participants did not consider life insurers’ CRE exposures a salient risk.
This article contributes to the literature on life insurance portfolios. Most of the literature has focused on bond investments.8 Koijen and Yogo (2023b) show that life insurers’ bond investments can be rationalized with insurers’ cheap access to leverage. Becker, Opp, and Saidi (2022) show how capital requirements affect life insurers’ bond investments. Kirti and Sarin (2024) document that life insurers that were taken over by private equity firms shifted their investments toward private-label asset-backed securities (ABS). Foley-Fisher, Heinrich, and Verani (2023) show that over the past decade, insurers have also significantly increased their securitization activity and issued collateralized loan securities (CLO). We complement this literature by providing a comprehensive analysis of the insurers’ exposure to CRE, which accounts for about 16% of the portfolio.
We also contribute to the literature on financial system vulnerabilities and systemic risk in the life insurance market. Chiang and Niehaus (2020) show that correlated trading of life insurers affects bond prices. Girardi et al. (2021) extend this theme and document that life insurers have similar portfolios. These similarities also predict common sales, which in extreme events result in significant price impacts. Ellul et al. (2022) show that life insurers’ rate guarantees can lead to insurance industry-wide fire sales. Jiang et al. (2023a) provide estimates for CRE-related losses in the banking sector after the Covid-19 pandemic based on CMBS price declines. We provide an estimate of insurers’ CRE-related losses based on loan-level data and detailed price forecasts and gauge the risks to financial stability by assessing whether insurers with significant estimated losses rely on runnable liabilities to fund themselves.
Our study also relates to the literature on differences across underwriters in the commercial mortgage market. Black, Krainer, and Nichols (2017) focus on differences between banks and CMBS and document that banks hold commercial mortgages with less-standard terms. Glancy, Kurtzman, and Loewenstein (2022) also document significant differences across underwriters, showing that banks and insurers generally have lower-at-origination LTVs than commercial mortgages in CMBS. Black, Krainer, and Nichols (2020) contrast commercial mortgage outcomes during the 2008 financial crisis, depending on whether the mortgage was originated by banks and CMBS.9 We contribute to this literature by documenting that life insurers’ underwriting terms and geographical concentration differ significantly from CMBS. We show that life insurers’ CRE mortgage portfolios are broadly diversified and do not exhibit a high degree of home bias. Moreover, we document that the portfolios are not overly skewed to large metropolitan statistical areas or downtown locations.
Data
We obtained detailed data on insurers’ commercial mortgage holdings, CUSIPs of CMBS holdings, and other insurer balance-sheet information from the National Association of Insurance Commissioners’ (NAIC) statutory filings provided by S&P Global Market Intelligence. For commercial mortgages, we use the reported zip codes for location and value assessments for prices when constructing LTVs.
We use city property-type commercial real estate price forecasts from CBRE to calculate stressed commercial real estate prices by location and property type. The data include prices for lodging, industrial, office, multifamily, and retail for 91 markets. We match these price forecasts to the aforementioned commercial mortgages using a market-zip code crosswalk.
We use zip code submarket descriptions obtained from CBRE to distinguish between suburban and downtown markets. We aggregate downtown and suburban designations at the submarket level to the zip code level, such that if any of the submarkets for a given zip code are labeled “downtown,” then the entire zip code is labeled as downtown. A zip code is treated as “suburban” if and only if the zip code has no submarkets considered downtown.
We obtain CMBS prices from reported trades from TRACE, location of properties backing mortgages in CMBS from Trepp, CMBS price indexes from Bloomberg, and stock returns from the Center for Research in Security Prices (CRSP).
Life insurers’ exposure to commercial real estate
In this section, we provide a detailed overview of life insurers’ direct and indirect exposures to commercial real estate. We start with direct lending (commercial mortgage) and analyze the loan terms and geographic diversification. We then review the life insurers’ holdings of CMBS.
Commercial mortgages
As of 2022:Q4, life insurers held $596.6 billion commercial mortgages in their portfolio. Figure 2 shows that the majority of commercial mortgages in life insurers’ portfolios finance properties in suburban locations. While life insurers have significantly increased their overall CRE lending over the last decade, much of this increased lending activity focused on suburban locations rather than office-dominated downtown locations.
2. Commercial mortgages by location
Sources: Authors’ calculations and National Association of Insurance Commissioners’ statutory filings provided by S&P Global Market Intelligence.
Figure 3 provides more details on the loan terms of the 60,337 commercial mortgages that life insurers held in 2022:Q4 to better understand the potential risks stemming from the commercial mortgage portfolios. The current and at-origination loan-to-value ratios are on average 0.53 and 0.54, respectively, much lower than for residential mortgages, suggesting more conservative underwriting practices. Moreover, these loans had, on average, a remaining maturity of about seven years. In other words, a significant share of commercial loans in life insurers’ portfolios will not have to be repaid in the near future. The low LTVs imply that insurers will only face significant losses in the case of large price declines.
3. Summary statistics of commercial mortgages in life insurers’ portfolios in 2022
| Number of loans | Total mortgage balances (billions of dollars) | Average remaining maturity (years) | Average interest rate (percent) | Average current loan-to-value ratio | Average at-origination loan-to-value ratio | |
|---|---|---|---|---|---|---|
| All | 60,337 | 596.6 | 7.3 | 4.26 | 0.53 | 0.54 |
| Downtown | 5,152 | 108.6 | 6.9 | 4.42 | 0.56 | 0.52 |
| Suburban | 55,185 | 488.0 | 7.4 | 4.22 | 0.52 | 0.55 |
Sources: Authors’ calculations and National Association of Insurance Commissioners’ statutory filings provided by S&P Global Market Intelligence.
We also split the commercial mortgage sample into central business district (downtown) and suburban locations as downtown locations are expected to have more significant price declines. Downtown mortgages account for about 18% of the commercial mortgage portfolios. These mortgages have a somewhat shorter remaining maturity (6.9 years on average) and have slightly higher LTV ratios (0.56) than mortgages backed by buildings in suburban locations, which have an average remaining maturity of 7.4 years and an LTV of 0.52.10
One concern is that the average LTV masks a sizable share of commercial mortgages with high LTVs. We therefore show the current LTV distribution in more detail in figure 4. We find that even for the higher percentiles of the distribution, the LTVs are comparatively low for the suburban locations—0.59 for the 75th percentile and 0.67 for the 90th percentile. For mortgages backed by downtown properties, the LTVs are slightly higher, especially on the high end of the LTV distribution, although even there LTVs barely breach 0.70.
4. Loan-to-value ratio distribution in 2022
| Average | 10th percentile | 25th percentile | Median | 75th percentile | 90th percentile | |
| All | 0.53 | 0.18 | 0.34 | 0.48 | 0.59 | 0.67 |
| Downtown | 0.56 | 0.18 | 0.37 | 0.51 | 0.61 | 0.70 |
| Suburban | 0.52 | 0.18 | 0.34 | 0.48 | 0.59 | 0.67 |
Sources: Authors’ calculations and National Association of Insurance Commissioners’ statutory filings provided by S&P Global Market Intelligence.
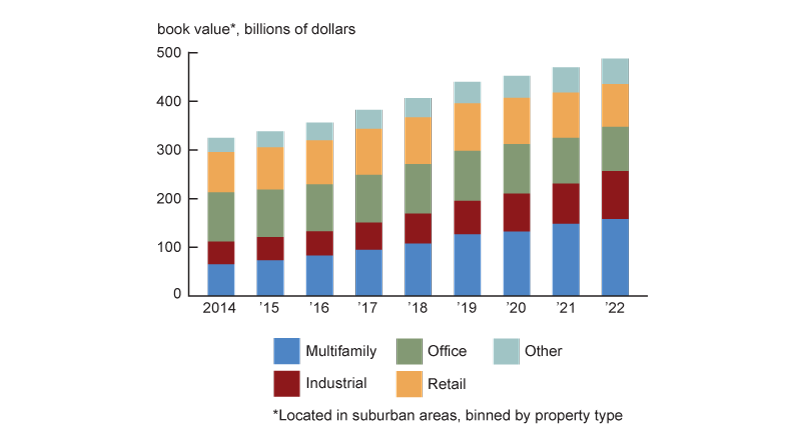
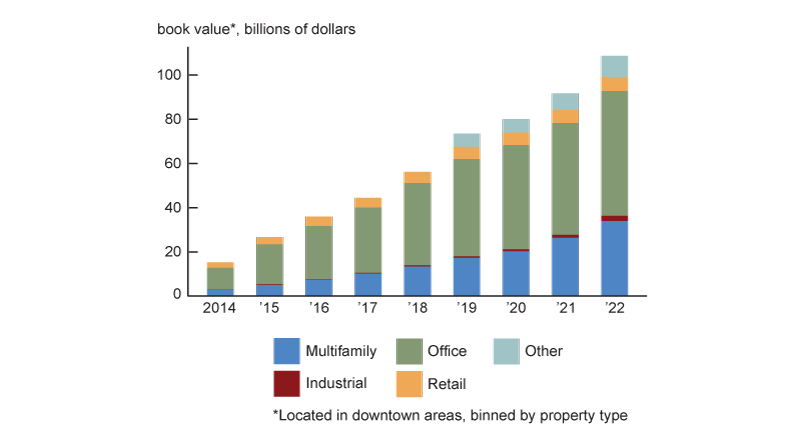
Next, we assess whether life insurers’ CRE direct exposure is concentrated in specific property types to gauge whether life insurers are vulnerable to the large declines in office building prices anticipated by market observers.11 Figure 5, panel A, shows that life insurers’ exposure to office building prices in suburban locations is limited, as a large share of these loans is backed by multifamily, industrial, and retail buildings. The downtown exposure, however, is concentrated in the office and multifamily segments (figure 5, panel B).
5. Commercial mortgages by property type
A. Suburban locations
B. Downtown locations
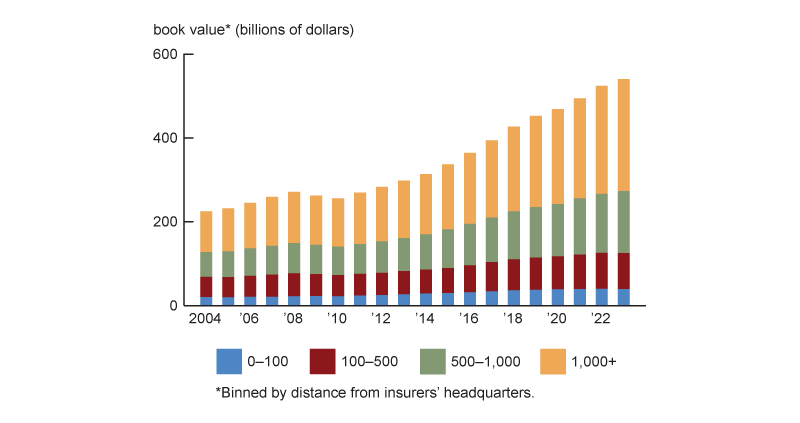
Last, we consider the geographical diversification to assess whether life insurers’ portfolios are highly concentrated near their headquarters’ locations. Figure 5, panel A shows that insurers’ commercial mortgage portfolios exhibit significant geographical diversification. Specifically, there is little evidence of a home bias in commercial mortgages. Most commercial mortgages are extended to locations far away from the insurance companies’ headquarters.12
Figure 6, panel B, shows the life insurance sector’s exposure to commercial mortgages by selected geographies. While insurance companies have significant exposures to the Manhattan and Los Angeles markets (about $40 billion and $32 billion, respectively), they have less exposures to other large CRE markets with potentially significant price declines (Chicago, San Francisco). In sum, life insurers’ direct exposure to CRE appears to be geographically well diversified.
6. Geographical diversification of commercial mortgages
A. Distance from headquarters
B. Exposure to largest metropolitan statistical areas

Sources: Authors’ calculations and National Association of Insurance Commissioners’ statutory filings provided by S&P Global Market Intelligence.
Taken together, life insurers’ commercial mortgage portfolios exhibit modest LTVs and appear to be well diversified geographically and by property type, although downtown locations exhibit a significant exposure to the office segment.
CMBS holdings
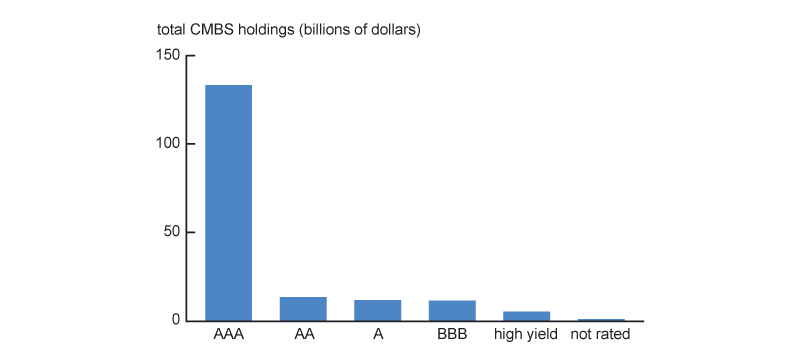
Life insurers have additional exposure to CRE through their $170 billion holdings of private-label CMBS. Within CMBS, life insurers tend to invest in the senior tranches. About 80% of insurers’ CMBS holdings are AAA-rated, and insurers hold little non-investment-grade (below BBB-rated) securities (figure 7, panel A).
7. Characteristics of life insurers’ commercial mortgage-backed securities (CMBS)
A. Rating
B. Property type by location
Sources: Authors’ calculations and National Association of Insurance Commissioners’ statutory filings provided by S&P Global Market Intelligence and Trepp.
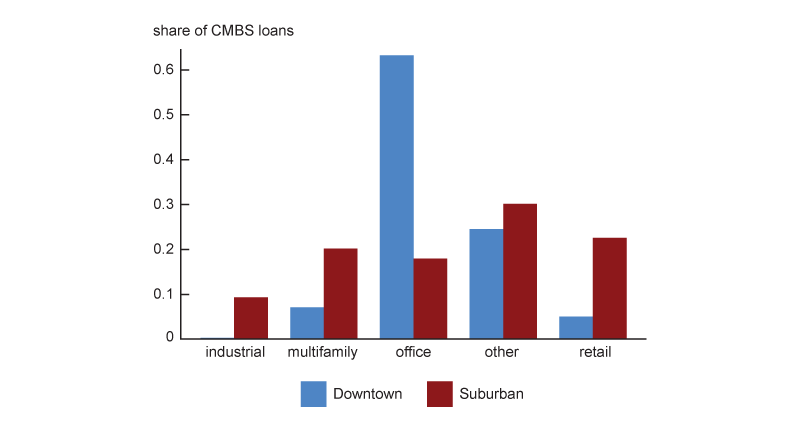
The indirect exposure to CRE that life insurers have through CMBS holdings differs significantly from their directly held commercial mortgages. First, directly held commercial mortgages tend to be amortizing, while CMBS mortgages typically have balloon payments.13 Second, directly held mortgages have on average lower LTVs at origination. The mortgages in CMBS held by life insurers have an average LTV over 0.6. For reference, commercial mortgages originated between 2012 and 2017 exhibited significant differences in average at-origination LTVs across the lender types. Specifically, commercial mortgages originated by banks and life insurers had LTVs of 0.56 and 0.57, respectively, while commercial mortgages in CMBS had an average at-origination LTV of 0.65 (Glancy, Kurtzman, and Loewenstein, 2022). Third, as figure 7, panel B, shows, CMBS downtown mortgages have considerably more concentration in the office sector. The concentration in the downtown office segment is particularly pronounced in single-asset, single-borrower (SASB) CMBS.14 Here, 83% of the downtown mortgages are to office properties, while for conduit CMBS the respective share is 51%. Single-asset, single-borrower CMBS account for 18% of life insurers’ CMBS holdings. Market-wide commercial mortgages backed by office buildings account for about 30% of loan amounts in both SASB and conduit CMBS.
Scenario analysis
In this section, we present a scenario in which we shock the commercial mortgage loans held by life insurers by taking the CBRE price forecast by location and property type and estimate losses under the assumption of widespread strategic default. We then also calculate the mark-to-market losses on the CMBS holdings. We report how much capital each insurer would lose in this scenario and assess potential run risks by analyzing whether insurers with large losses also have a significant amount of runnable liabilities.
Analysis assumptions
We stress life insurers’ commercial mortgage portfolios based on the CBRE price projections. We use the change in property prices by location and property type from 2020 to 2025. For the commercial mortgage portfolios that life insurers hold, across all geographies CBRE projects an average price decline for multifamily, office, and retail of 13%, 40%, and 23%, respectively.15
We use the underlying estimated price declines by geography and property type to estimate losses for insurers.16 Taking the regional heterogeneity by property type into account is crucial since some markets are projected to experience slumping prices, especially for office properties, while other markets are projected to experience no, or only mild, price declines.17 We take a conservative approach and consider a full drop in property prices, even if the life insurers have reported updated property value assessments in 2021 or 2022. While life insurers regularly update property value assessments, most of the assessments are not as recent as 2022.18
To estimate direct CRE loan losses, we make two assumptions. First, we consider widespread strategic default, for instance, due to negative net cash flow from a property. Specifically, we put all loans into default.19 Second, we assume that the price scenarios already incorporate potential fire-sale discounts and calculate the loss-given default (LGD) for each loan as the difference between the mortgage balance and the stressed price if the mortgage balance exceeds the stressed price and zero otherwise:
1) LGD = max[0, Mortgage Balance – Stressed Price].
Together, the two assumptions are equivalent to assuming that all mortgages with the stressed price have negative equity default. We then calculate the total losses for each insurer. While the assumption that all loans default is arguably extreme, the impact is potentially mitigated by the fact that many CRE loans in life insurers’ portfolios have loan-to-value ratios of about 0.53.20
We also calculate potential losses from CMBS holdings by using current market prices—that is, we use the current mark-to-market losses as a proxy for losses on the CMBS holdings in the future.
Results of the analysis
We start our scenario analysis with the commercial mortgage portfolio of insurers. Given our assumptions of widespread default and losses being the difference between the outstanding loan balance and the stressed price, we estimate that the U.S. life insurance sector would experience losses of about $10 billion on its $545 billion commercial mortgage holdings. The main reason for the relatively small losses relative to the size of the commercial mortgage portfolio is low current LTVs (figure 12 on p. 12). For the approximately 16,000 commercial mortgages for which the scenario predicts a price decline of at least 20%, the median stressed LTV is 0.78 and the 75th percentile is 0.95, limiting losses.
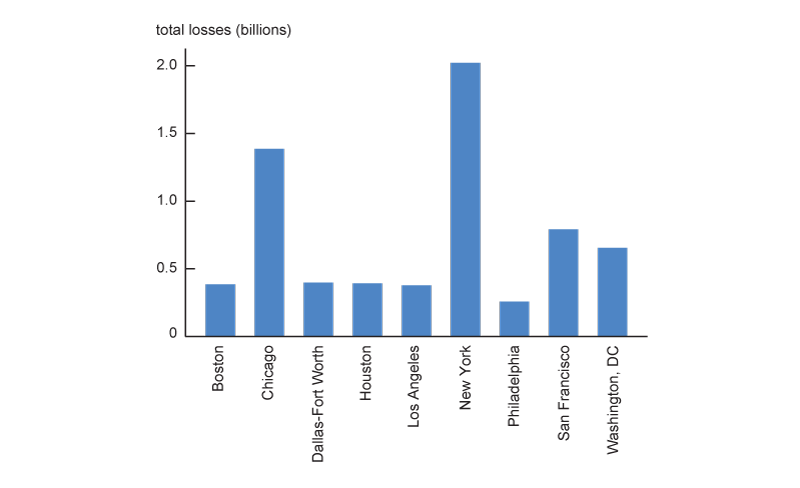
Figure 8 shows that exposures to the New York market account for almost a fifth of these losses, while the large exposures to the Los Angeles market are not expected to drive losses.21 In addition to the geographical diversification, insurers invest in CRE loans that are amortizing, and hence, the loan balance and loan-to-value ratios decrease over time, limiting the exposure of insurers to price declines in the CRE market.
8. Estimated losses for selected markets
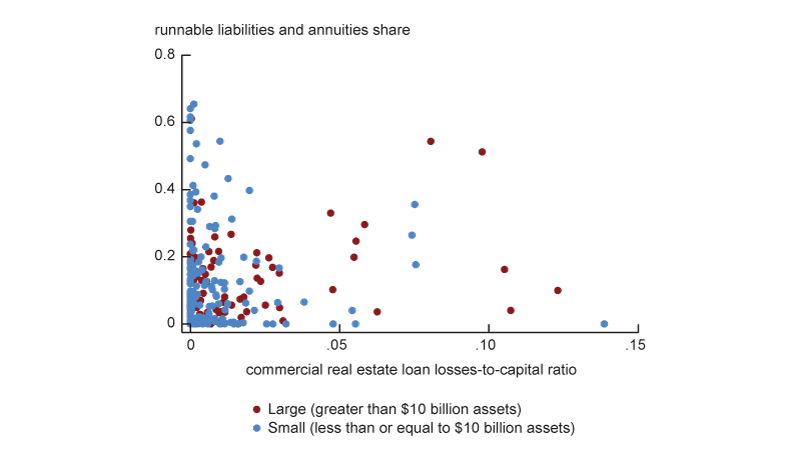
9. Commercial mortgage losses and all runnable liabilities
Sources: Authors’ calculations and National Association of Insurance Commissioners’ statutory filings provided by S&P Global Market Intelligence and Global Commercial Real Estate Services.
The median insurer experiences losses of about 1% of their adjusted capital, which includes loan loss reserves. However, not all insurers are equally geographically diversified; and four life insurers would face losses of at least 10% of their capital. Insurers with large losses could face runs if they have a significant share of nontraditional, runnable liabilities, such as funding-agreement-backed securities or federal home loan bank (FHLB) advances or have a large share of annuities that can be surrendered without penalty.22 Funding-agreement-backed securities have a fixed maturity and are typically rolled over. Foley-Fisher, Narajabad, and Verani (2020) show that during the 2008 financial crisis, investors refused to roll over these agreements. FHLB advances are included as FHLB funding itself can be fragile (Gissler and Narajabad, 2017a,b).
Figure 9 shows the runnable liabilities and annuities share and the commercial mortgage loss-to-capital ratio. Insurers with a large share of runnable nontraditional liabilities and annuities are more susceptible to runs if large losses materialize. Hence, insurers in the upper-right quadrant of the figure would have the largest run risks. Our analysis suggests few insurers with a large share of runnable liabilities could experience significant losses. For a small number of large insurers, the estimated losses exceed 5% of their adjusted capital. However, most of the large insurers with losses over 5% of capital—with the two exceptions—do not have outsized runnable liabilities and annuity shares. Similarly, the small insurer with the largest losses has little run risk.
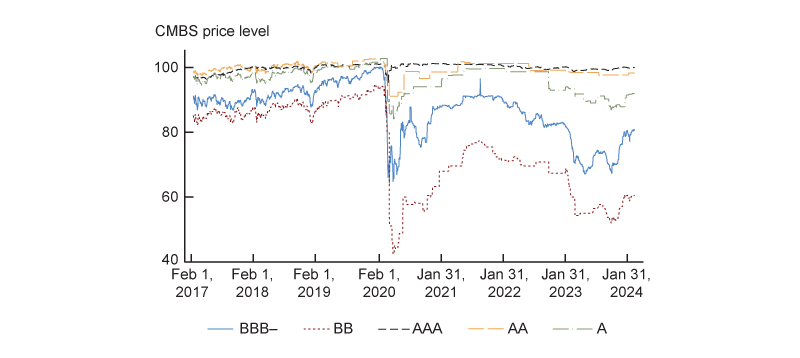
Next, we assess the indirect CRE exposure of insurers from their CMBS portfolios. We obtain current market prices for the CMBS holdings of insurers at the CUSIP level. Figure 10, panel A, shows the evolution of CMBS price indexes by rating. After falling sharply in March 2020, prices recovered after large interventions by the Federal Reserve, including direct support for the CMBS market through the Term Asset-Backed Securities Loan Facility (TALF). Prices started to decline in 2021, accelerated with the monetary tightening that started in 2022, and only recovered somewhat in early 2024. For each CUSIP, we obtain the average volume-weighted price in each quarter between 2022:Q4 and 2024:Q1 from TRACE and take the lowest average price.23 We make this assumption to account for the possibility of runs, forcing insurers to sell these securities instead of holding the security to maturity. This assumption is conservative, increasing potential losses, while as we discuss in more detail later, not all insurers are equally susceptible to run risk.
10. Commercial mortgage-based securities (CMBS) prices and losses
A. CMBS price indexes by rating
B. Estimated mark-to-market losses
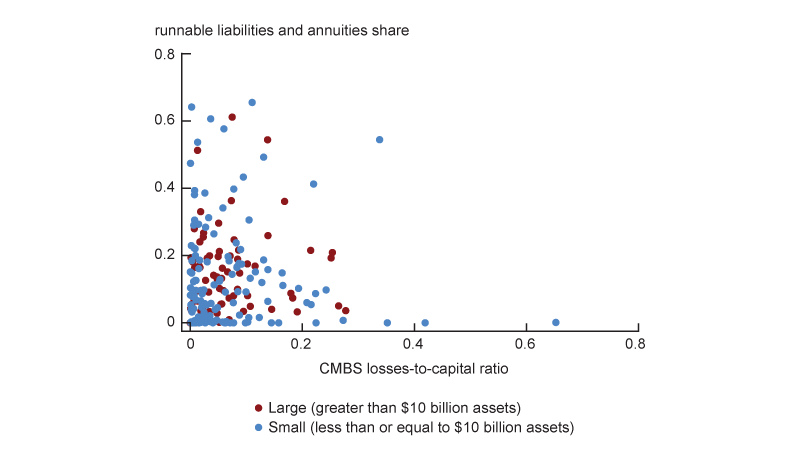
Under this assumption, we find current mark-to-market losses of $26.3 billion. These losses are significantly higher than those from insurers’ direct exposure from commercial mortgages. The average mark-to-market loss for a AAA-rated tranche is 13.3%. For AA-, A-, and BBB-rated tranches the respective losses are 17.9%, 17.1%, and 22%. With the monetary tightening that began in the fall of 2022, prices of CMBS dropped. We therefore decompose the losses into an interest rate component and a credit risk component.24 By comparing CMBS prices with same-maturity Treasury securities, we estimate that credit losses on AAA-rated are negligible: 1% for Conduit, but nearly 3% for SASB, in line with panel A of figure 10.25 In total, credit losses account for 28% of mark-to-market losses in SASB CMBS compared to 17% for conduit CMBS. To be clear, the mark-to-market losses can be seen as an upper bound that would only materialize if insurers had to sell these securities. However, insurers typically hold these securities to maturity and likely will only have to absorb the credit losses.
Figure 10, panel B, plots the CMBS loss-to-capital ratio against the runnable liabilities and annuities. Five large insurers with assets over $10 billion have mark-to-market losses of more than 20% of their adjusted capital, but these insurers have a share of runnable liabilities of under 25%.
In figure 11 we add the estimated losses from the commercial mortgage and CMBS portfolios, which amount to about $36.3 billion. We find that under our price scenario, five large insurers experience losses of more than 20% of their adjusted capital, and four smaller insurers face losses of over 30% of capital.
11. Total losses and run risk

We also evaluate the changes in the risk-based capital (RBC) ratio for the average large insurer, the RBC ratio (adjusted capital/(authorized control level RBC*2)) drops from 425% to 392%. Insurers with risk-based capital ratios under 400% may face heighted regulatory scrutiny.26 One large insurer just crosses the threshold for regulatory action (200%) when adding the CRE losses.27
Given current capital levels and when considered in isolation, the insurers’ CRE related losses are unlikely to trigger runs on insurers, though some large insurers may have to raise additional capital. Moreover, these losses could potentially lead to ratings downgrades of insurers, increasing their funding cost, further weakening their financial position, and increasing scrutiny by lenders and policyholders.28
Market reaction to commercial real estate news
In this section, we analyze the response of life insurer stocks to news about commercial real estate. Specifically, we test whether stocks of life insurers with larger CRE exposure dropped more after the failure of Silicon Valley Bank in March 2023, when CRE concerns first made headlines, and after the CRE loan loss disclosures of New York Community Bancorp in January 2024.
Failure of Silicon Valley Bank
Concerns about CRE exposure featured prominently in the news after the failure of Silicon Valley Bank (SVB) on March 10, 2023. In the days following the SVB failure, academics, market participants, and the financial press speculated which other banks could be potentially susceptible to runs.29 While SVB had only limited exposure to CRE, by mid-March 2023 CRE had become the focus as a potential source of significant losses for banks.30 As a result, bank stocks, especially regional bank stocks, plummeted in March and April 2023. However, market commentary was mostly silent on the potential implications for life insurers despite their, in part significant, CRE exposures.
To test the market reaction to concerns about CRE that unfolded during March and April 2023, we assess whether differences in quarterly stock returns of life insurers in 2023 can be explained by differences in CRE exposure. We therefore estimate the following regression.$2)\quad Stock \ Return_{i,t} = α_{t} + β \ Share \ CRE_{i},\;_{2022} + {γX}_{i}+ ϵ_{i},$
where ${Share CRE}_{i,\;2022}$ is the CRE mortgage share of general account assets of insurer i in 2022:Q4, and ${X}_{i}$ is a vector of insurer characteristics (log(assets) and surplus in 2022). We also include time-fixed effects $(\unicode{x03B1}_{t})$ that control other economy-wide factors, such as the market return.
Figure 12 shows the results of estimating equation 2. We do not detect a statistically or economically significant effect of exposure to CRE, either measured as the CRE mortgage share of general account assets (columns 1 and 2), as a dummy for the CRE mortgage share in the 75th percentile (columns 3 and 4), or as the CRE mortgage and CMBS share of general account assets (columns 5 and 6). Indeed, controlling for insurer size, measured as the log of general account assets, we find a positive, but insignificant coefficient on CRE exposure measures.31
12. Estimated effect of commercial real estate (CRE) exposure on quarterly life insurers’ stock returns
| (1) | (2) | (3) | (4) | (5) | (6) | (7) | (8) | |
| Share CRE | –0.235 | 0.064 | ||||||
| (0.259) | (0.214) | |||||||
| High CRE | –0.021 | 0.014 | ||||||
| (0.024) | (0.034) | |||||||
| Share CRE and CMBS | –0.178 | 0.147 | ||||||
| (0.299) | (0.189) | |||||||
| Scenario losses | –0.001 | 0.020 | ||||||
| (0.115) | (0.114) | |||||||
| Controls | No | Yes | No | Yes | No | Yes | No | Yes |
| Time-fixed effects | Yes | Yes | Yes | Yes | Yes | Yes | Yes | Yes |
| Observations | 92 | 92 | 92 | 92 | 92 | 92 | 80 | 80 |
| R2 | 0.11 | 0.11 | 0.11 | 0.11 | 0.11 | 0.11 | 0.35 | 0.35 |
Sources: Authors’ calculations, National Association of Insurance Commissioners’ statutory filings provided by S&P Global Market Intelligence, and CRSP and Compustat data provided by Wharton Research Data Services.
CRE losses reported by New York Community Bancorp
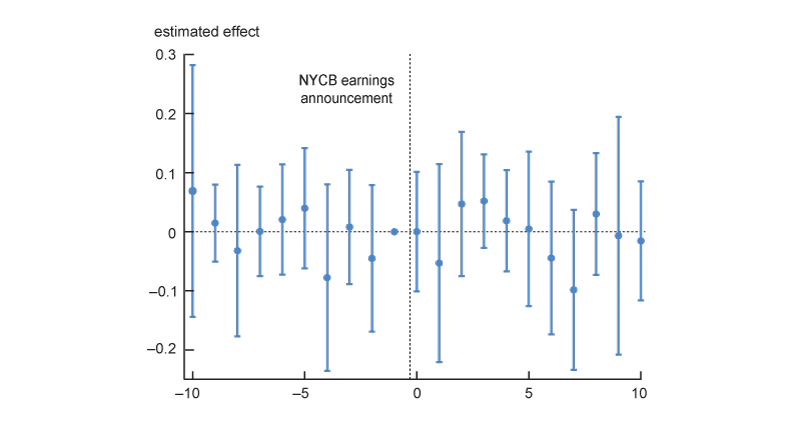
CRE exposures of banks were again thrown into sharp relief following the earnings announcement of New York Community Bancorp (NYCB) on January 31, 2024.32 The bank reported $185 million in write-offs, mostly attributable to two CRE loans, and a significant increase in provisioning for potential losses in the CRE loan portfolio. The announcement reignited questions about the health of banks.33 We therefore test whether market participants were also concerned about life insurers’ CRE exposure following the NYCB announcement. Different from the failure of SVB, in the NYCB case CRE was immediately the focus of market participants. Hence, we analyze the sensitivity of life insurers’ stock returns to CRE exposure in an event study setting. Specifically, we estimate the following regression:
$3)\quad{Stock\,Return}_{i,t},=\sum{_{t =\text{Jan 15,2024}}^\text{Feb 15,2024}{{\unicode{x03B2}}_{t}}\,Share CRE}_{i,2022}+{{\unicode{x03B3}}_{i}}\,+\,{{\unicode{x03B1}}_{t}}+{{\in}_{i}},$
where ${Share CRE}_{i,\;2022}$ is again the CRE mortgage share of general account assets of insurer i in 2022:Q4, ${\unicode{x03B3}_{i}}$ are insurer-fixed effects, and ${\unicode{x03B1}_{t}}$ are trading-day fixed effects that absorb general market conditions. The coefficient ${\unicode{x03B2}}_{t}$ captures the effect of CRE exposure on the stock return on day t.
Figure 13 shows the results of estimating equation 3 in a 21-day window around January 31, 2024. We find no effect of CRE exposure on daily stock returns around the NYCB earnings announcement.
13. Commercial real estate (CRE) exposure and life insurers’ daily stock returns around New York Community Bancorp (NYCB) earnings announcement
Sources: Authors’ calculations, National Association of Insurance Commissioners’ statutory filings provided by S&P Global Market Intelligence, and CRSP and Compustat data provided by Wharton Research Data Services.
Taken together, we do not find evidence that exposure to CRE affected life insurers’ stock returns in two periods of heightened concerns about CRE. One potential explanation is that life insurers’ liabilities are less subject to run-risk than banks’ uninsured deposits. As such, the evidence presented here is consistent with the interpretation that life insurers are asset insulators (Chodorow-Reich, Ghent, and Haddad, 2021).
Conclusion
We assess the potential losses from CRE-related investments in life insurers’ portfolios. Using detailed location-property type price forecasts and CMBS prices, we estimate that the life insurance sector as a whole could face combined losses of about $36.3 billion from direct and indirect exposures to CRE. We find that some individual large life insurers face significant losses of up to 34% of their capital. However, the largest losses are concentrated in life insurers with limited run risk. We also document that stocks of publicly traded life insurers with large CRE exposure did not exhibit abnormal negative returns after the failure of SVB or the earnings announcement of NYCB, suggesting that market participants did not anticipate life insurers experiencing outsized losses related to CRE.
Notes
1Insurers’ total assets are the sum of assets held on the “general account” and “separate account.” General account assets support liabilities where the insurer bears the liability risk and investment risk, such as for term-life contracts or annuities with guarantees. In contrast, the separate account contains assets that back liabilities where the policyholder bears the risk, similar to a mutual fund. The largest asset class in the general account is corporate bonds, followed by CRE mortgages and private placements.
2While life insurers have a long history of investing in commercial real estate loans (Robinson, 1975), to the best of our knowledge no recent research has systematically assessed the CRE exposure of life insurers.
3Insurers also have about $30 billion in foreign commercial mortgages.
4Given the stark differences between insurers’ CRE mortgage underwriting and mortgages in CMBS, we do not follow the approach by Jiang et al. (2023a), which relies on CMBS prices to calculate commercial mortgage losses for banks.
5In appendix 1, we assume that only loans with LTVs over 0.8 default, but that the loss on each of these loans is 30% of the mortgage balance, which on average leads to higher losses.6Nontraditional liabilities include, for example, funding-agreement-backed securities, borrowing from the Federal Home Loan Banks (FHLBs) backed by funding agreements, and repo and securities lending cash collateral. For more details on life insurers’ nontraditional liabilities, see Foley-Fisher, Narajabad, and Verani (2019).
7More information on the Financial Industry Regulatory Authority (FINRA) is available online.
8For a comprehensive overview of the life insurance industry, see Koijen and Yogo (2023a).
9There is also a more-dated literature on commercial loan defaults using life insurance data, see, e.g., Esaki, L’Heureux, and Snyderman (1999).
10We construct the current LTV ratio with the most recent assessed price. Price assessments in 2022 already show some declines, increasing current LTV ratios.
11More information is available online.
12The distance between New York City and Chicago is about 700 miles and between New York City and Miami is about 1,000 miles.
13In amortizing loans, the principal is repaid over time. Hence, amortizing loans become less risky over the lifetime of the loan as the outstanding balance shrinks. In contrast, loans with balloon payments require the borrower to pay back the loan amount at maturity.
14There are two types of CMBS: conduit CMBS and single-asset, single-borrower (SASB) CMBS. Conduit CMBS are backed by a diverse mix of CRE loans. In contrast, SASB CMBS securitize either loans to multiple properties owned by a single borrower or by a single asset, slicing the cash flow generated by that asset.
15We weight the price projection by the outstanding mortgage balances.
16There could be additional discounts as foreclosure sales tend to yield lower prices increasing losses. However, some insurers may opt to add the property to their real estate portfolio, thereby reducing losses. As such, the losses estimated in this analysis should be interpreted with caution.
17For hotels, we use the estimated retail price decline in the respective geography, for mixed-use buildings a weighted average of estimated retail, multifamily, and office price declines, and for all other properties the unweighted average of the estimated industrial, multifamily, office, and retail price declines. The weights for the mixed-use property price decline are 15% retail, 45% multifamily, and 40% office.
18For the properties with assessments in 2021 or 2022 that already incorporate some price declines, we potentially overestimate losses.
19For simplicity, we assume that all loans default and not only those that need to be refinanced. This assumption is backed by recent reports that borrowers defaulted well before maturity: For example, Wong (2024), Gittelsohn (2023), Buschbom et al. (2021), and Flynn Jr., Ghent, and Tchistyi (2020) present evidence of strategic renegotiation among CMBS borrowers. Glancy, Kurtzman, and Loewenstein (2022) present evidence consistent with bank borrowers strategically renegotiating at lower LTVs than CMBS borrowers.
20An alternative approach to estimating losses is to assume that loans with a loan-to-value (LTV) ratio of 80% default and in case of default, a specific percentage of the loan balance cannot be recovered. Specific triggers are common in CRE default models (see, e.g., BlackRock’s CMBS defaults model). Glancy, Kurtzman, and Loewenstein (2022) show that an LTV of 80% is above the 99th percentile of at-origination CMBS LTV loans originated between 2012 and 2017. Using an 80% default threshold and a loss-given default of 30% yields larger losses to those reported in this section. See appendix 1.
21In comparison to Manhattan and many other gateway cities, the office utilization rates for Los Angeles are higher, hence the estimated price declines are significantly smaller.
22Runs in the insurance sector have occurred in the past, albeit in the context of more significant high-risk asset exposures. For instance, in 1991 Executive Life invested approximately 60% of its $10.5 billion in the junk bond market. Policyholders aware of Executive Life’s significant exposure to the junk bond market ran on the insurer. They requested policy withdrawals and surrenders of more than $3 billion, roughly equal to 30% of the insurer’s liabilities in that year, resulting in the insolvency of the insurer. In the 2008 global financial crisis, investors stopped rolling over funding-agreement-backed securities, a form of nontraditional liabilities (Foley-Fisher, Narajabad, and Verani, 2020).
23We start in 2021 to avoid the severe price dislocations early in the pandemic and the subsequent support for the CMBS market by TALF. For most prices, the lowest price was observed in 2023. For CUSIPs for which we do not observe a transaction, we use the average minimum price in the respective rating category.
24We chose to separate out interest rate-related losses, because life insurers largely hedge interest rate risk through duration matching of their liabilities, as well as by purchasing interest rate derivatives. As a result of this hedging activity, changes in the value of insurers’ assets due to changes in interest rates are largely offset by corresponding changes in their liability values. However, in the event insurers sell assets, the realized gain/loss due to interest rate changes is booked in the interest maintenance reserve (IMR) and amortized over the duration of the sold security.
25For details, see appendix 2.
26The authorized control level RBC is the RBC at which surplus falls below 100% of the RBC amount.
27Since the risk-based capital ratio was only introduced in 1993, we cannot directly compare these changes to the failures during the 1990s.
28AM Best, the largest insurance rating agency, uses a methodology similar to the risk-based capital ratio as a crucial input in their rating process.
29See, e.g., Jiang et al. (2023b).
30See, e.g., Burgess (2023), Sample (2023), and Stein (2023).
31Larger insurers have significantly larger CRE shares. Appendix 3 shows the results of an event study setting with monthly stock returns and insurer-fixed effects. The event study confirms that insurers with larger CRE exposure did not have more negative returns in the last three quarters of 2023.
32See Heeb and Feuer (2024).
33See Armstrong and Wu (2024).
Appendix 1: Alternative loss assumptions for scenario analysis
In this robustness section, we modify the two key assumptions of the scenario analysis. First, we assume that instead of widespread strategic default, we assume that mortgages with an LTV of 0.8 or higher will default. Glancy, Kurtzman, and Loewenstein (2022) show that an LTV of 80% is above the 99th percentile of at-origination CMBS LTVs loans originated between 2012 and 2017. The second assumption is that the loss-given default is given by 30% of the mortgage balance. Given the low LTV, this assumption allows significant fire-sale discounts:A1)LGD = 0.3 × Mortgage Balance if Stressed LTV ≥ 0.8, 0 otherwise.
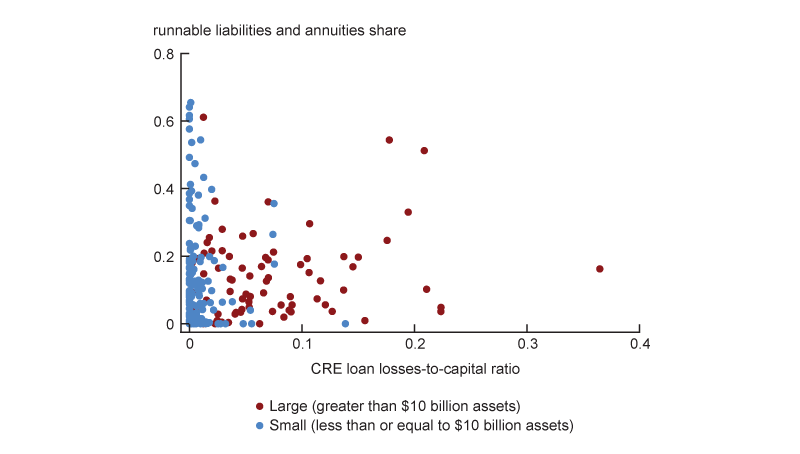
Figure A1 shows the results of the scenario analysis with these assumptions. Estimated losses are larger, but only five large insurers would face losses on their mortgage portfolio in excess of 20% (left panel). Most insurers with large mortgage losses have a small share of runnable liabilities. Adding the losses on the CMBS portfolio, shown in the right panel of figure A1, results in losses of up to 50% of capital, but the two large insurers with the largest estimated losses have a runnable liabilities share of less than 20% mitigating concerns about runs. Two large insurers have estimated losses of over 20% of capital. In this scenario, several large insurers would face regulatory actions and would likely need to raise additional capital.
Appendix 2. Decomposition of commercial mortgage-backed securities (CMBS) losses
To decompose the mark-to-market losses in CMBS into an interest rate component and a credit risk component, we:
- Find the ten-year Treasury rate at the time of the investment for each CMBS CUSIP,
- Get the ten-year Treasury rate as of 2022:Q4,
- Estimate the interest rate-only present value of each CMBS using the ten-year Treasury rate at the time of the investment as the coupon and the ten-year Treasury rate as the discount rate,
- Calculate interest rate-only price as interest rate-only present value divided by the par value,
- Estimate the price decline caused by increased credit risk as the difference between the interest rate-only price and the mark-to-market price, and
- Estimate credit-related CMBS losses as the price decline caused by increased credit risk multiplied with the actual cost of the CMBS at the time of purchase.
These steps give us a back-of-the-envelope estimate of the mark-to-market losses from interest rate and credit risk increases. Figure A2 summarizes the results by CMBS type.
A2. Estimated credit loss in insurers’ commercial mortgage-backed securities’ (CMBS) holdings
| Single-asset, single-borrower | Conduit | ||||||
| Holdings (billions of dollars) | Mark-to-Market loss (percent) | Credit loss (percent) | Holdings (billions of dollars) | Mark-to-Market loss (percent) | Credit loss (percent) | ||
| AAA | 30.3 | 13.2 | 2.7 | 102.4 | 13.3 | 0.9 | |
| AA | 3.8 | 17.6 | 4.8 | 8.8 | 17.9 | 4.6 | |
| A | 3.3 | 16.7 | 3.7 | 7.7 | 17.1 | 4.7 | |
| BBB | 2.9 | 24.3 | 9.0 | 7.7 | 22.0 | 8.8 | |
| High yield | 1.9 | 41.2 | 25.4 | 2.9 | 47.9 | 31.0 | |
| Total (billions of dollars) | 42.2 | 6.7 | 0.3 | 129.5 | 19.6 | 3.3 | |
Appendix 3. Alternative event studies
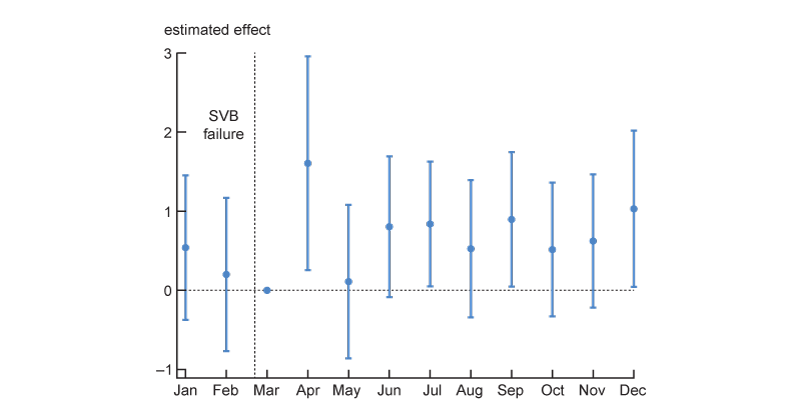
Figure A3 shows an alternative approach to estimating the importance of insurers’ CRE exposure for stock returns around the failure of SVB. We estimate an event study using monthly returns. Panel A shows the interactions between monthly dummy variables and the commercial mortgage-to-general account asset ratio. Panel B shows the interactions between monthly dummy variables and a dummy for an above-median commercial mortgage-to-general account asset ratio. We do not find that insurers with larger CRE exposure had lower returns after the failure of SVB.
A3. Monthly insurers’ stock returns and commercial real estate exposure around Silicon Valley Bank (SVB) failure
A. CRE to general account asset ratio × monthly dummies
B. Above median CRE to general account asset ratio × monthly dummies
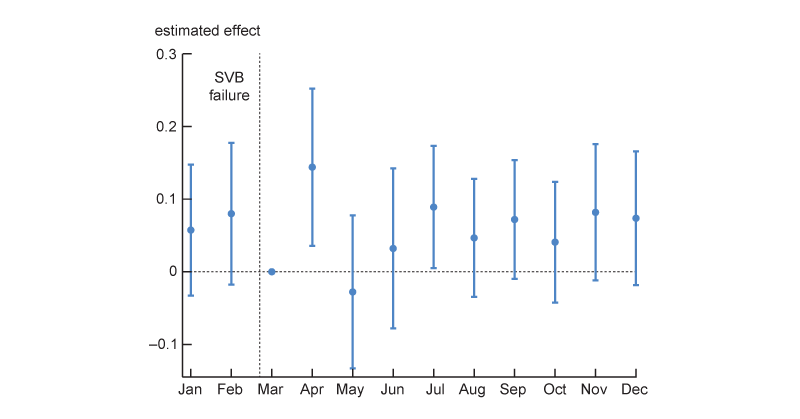
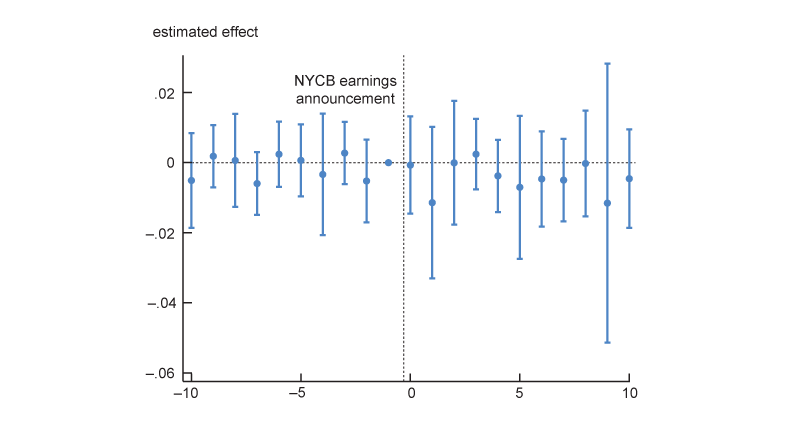
Figure A4 shows an alternative approach to estimating the importance of insurers’ CRE exposure for stock returns around the NYCB earnings announcement. We estimate an event study using daily returns. The figure shows the interactions between daily dummy variables and a dummy for an above median commercial mortgage-to-general account asset ratio. We do not find that insurers with larger CRE exposure had lower returns.
A4. Daily insurers’ stock returns and high commercial real estate exposure around New York Community Bancorp (NYCB) earnings announcement
A1. Commercial real estate (CRE)-related losses in life insurers’ portfolios
A. Commercial mortgages only
B. Total losses (including commercial mortgage-backed securities (CMBS))
References
Armstrong, Robert, and Ethan Wu, 2024, “The Fed won’t be rushed,” Financial Times, February 1, available online by subscription.
Becker, Bo, Marcus M. Opp, and Farzad Saidi, 2022, “Regulatory forbearance in the U.S. insurance industry: The effects of removing capital requirements for an asset class,” Review of Financial Studies, Vol. 35, No. 12, December, pp. 5438–5482. Crossref
Black, Lamont K., John R. Krainer, and Joseph B. Nichols, 2020, “Safe collateral, arm’s-length credit: Evidence from the commercial real estate market,” Review of Financial Studies, Vol. 33, No. 11, November, pp. 5173–5211. Crossref
Black, Lamont, John Krainer, and Joseph Nichols, 2017, “From origination to renegotiation: A comparison of portfolio and securitized commercial real estate loans,” Journal of Real Estate Finance and Economics, Vol. 55, No. 1, July, pp. 1–31. Crossref
Burgess, Robert, 2023, “Banking’s next threat? It might be commercial real estate,” Bloomberg, March 13, available online by subscription.
Buschbom, Stephen L., James B. Kau, Donald C. Keenan, and Constantine Lyubimov, 2021, “Delinquencies, default and borrowers’ strategic behavior toward the modification of commercial mortgages,” Real Estate Economics, Vol. 49, No. 3, Autumn (Fall), pp. 936–967. Crossref
Chiang, Chia-Chun, and Greg Niehaus, 2020, “Correlated trading by life insurers and its impact on bond prices,” Journal of Risk and Insurance, Vol. 87, No. 3, September, pp. 597–625. Crossref
Chodorow-Reich, Gabriel, Andra Ghent, and Valentin Haddad, 2021, “Asset insulators,” Review of Financial Studies, Vol. 34, No. 3, March, pp. 1509–1539. Crossref
Ellul, Andrew, Chotibhak Jotikasthira, Anastasia Kartasheva, Christian T. Lundblad, and Wolf Wagner, 2022, “Insurers as asset managers and systemic risk,” Review of Financial Studies, Vol. 35, No. 12, December, pp. 5483–5534. Crossref
Esaki, Howard, Stephen L’Heureux, and Mark Snyderman, 1999, “Commercial mortgage defaults: An update,” Real Estate Finance, Vol. 16, No. 1, Spring, available online.
Flynn, Sean J., Jr., Andra C. Ghent, and Alexei Tchistyi, 2020, “Informational efficiency in securitization after Dodd–Frank,” Review of Financial Studies, Vol. 33, No. 11, November, pp. 5131–5172. Crossref
Foley-Fisher, Nathan, Nathan Heinrich, and Stéphane Verani, 2023, “Are US life insurers the new shadow banks?,” Board of Governors of the Federal Reserve System, paper, April. Crossref
Foley-Fisher, Nathan, Borghan Narajabad, and Stéphane Verani, 2020, “Self-fulfilling runs: Evidence from the US life insurance industry,” Journal of Political Economy, Vol. 128 No. 9, September, pp. 3520–3569. Crossref
Foley-Fisher, Nathan, Borghan N. Narajabad, and Stéphane Verani, 2019, “Assessing the size of the risks posed by life insurers’ nontraditional liabilities,” FEDS Notes, Board of Governors of the Federal Reserve System, May 21. Crossref
Girardi, Giulio, Kathleen W. Hanley, Stanislava Nikolova, Lorianna Pelizzon, and Mila Getmansky Sherman, 2021, “Portfolio similarity and asset liquidation in the insurance industry,” Journal of Financial Economics, Vol. 142, No. 1, October, pp. 69–96. Crossref
Gissler, Stefan, and Borghan Narajabad, 2017a, “The increased role of the Federal Home Loan Bank system in funding markets, part 3: Implications for Financial Stability,” FEDS Notes, Board of Governors of the Federal Reserve System, October 18. Crossref
Gissler, Stefan, and Borghan Narajabad, 2017b, “The increased role of the Federal Home Loan Bank system in funding markets, part 1: Background,” FEDS Notes, Board of Governors of the Federal Reserve System, October 18. Crossref
Gittelsohn, John, 2023, “Pimco-owned office landlord defaults on $1.7 billion mortgage,” Bloomberg, February 22, available online by subscription.
Glancy, David, Robert J. Kurtzman, and Lara Loewenstein, 2022, “Loan modifications and the commercial real estate market,” Finance and Economics Discussion Series, Board of Governors of the Federal Reserve System, No. 2022-050, August. Crossref
Heeb, Gina, and Will Feuer, 2024, “New York Community Bancorp stock plunges 38%, reigniting fears for regional banks,” Wall Street Journal, January 31, available online by subscription.
Jiang, Erica Xuewei, Gregor Matvos, Tomasz Piskorski, and Amit Seru, 2023a, “Monetary tightening, commercial real estate distress, and US bank fragility,” National Bureau of Economic Research, working paper, No. 31970, December. Crossref
Jiang, Erica Xuewei, Gregor Matvos, Tomasz Piskorski, and Amit Seru, 2023b, “Monetary tightening and U.S. bank fragility in 2023: Mark-to-market losses and uninsured depositor runs?,” National Bureau of Economic Research, working paper, No. 31048, March 2023, revised October 2023. Crossref
Kirti, Divya, and Natasha Sarin, 2024, “What private equity does differently: Evidence from life insurance,” Review of Financial Studies, Vol. 37, No. 1, January, pp. 201–230. Crossref
Koijen, Ralph S. J., and Motohiro Yogo, 2023a, Financial Economics of Insurance, Princeton, NJ: Princeton University Press. Crossref
Koijen, Ralph S. J., and Motohiro Yogo, 2023b, “Understanding the ownership structure of corporate bonds,” American Economic Review: Insights, Vol. 5, No. 1, March, pp. 73–92. Crossref
Robinson, Thomas R., 1975, “Life insurance companies and the commercial mortgage market, 1960–73,” Real Estate Economics, Vol. 3, No. 1, March, pp. 49–72. Crossref
Sample, Brooke, 2023, “SVB sends tremors across the banking landscape,” Bloomberg, March 18, available online by subscription.
Stein, Jeff, 2023, “The initial banking crisis is easing. Another may be around the corner,” Washington Post, March 27, available online by subscription.
Wong, Natalie, 2024, “Blackstone’s defaulted NYC office loan for sale at 50% discount,” Bloomberg, January 16, available online by subscription.


