

Excerpted from a joint publication of the Funders' Network for Smart Growth and Livable Communities, its members, and the Federal Reserve Banks of Atlanta, Boston, Chicago and New York1
Executive Summary
Place-based funders2 can play an important role in connecting economic growth to economic opportunity. Looking for Progress in America's Smaller Legacy Cities describes a study tour undertaken by representatives from four Federal Reserve Banks and more than two dozen place-based funders, under the auspices of the Funders’ Network-Federal Reserve Philanthropy Initiative. What began as an inquiry into four small legacy cities – Chattanooga, TN; Cedar Rapids, IA; Rochester, NY; and Grand Rapids, MI – that appeared to have experienced some measure of revitalization in the post Great Recession environment evolved into an understanding that revitalization in these places is moving along two distinct paths: an “arc of growth” and an “arc of opportunity.” In the context of these small legacy cities, growth and opportunity is unfolding separately along these two long-term “arcs,” leading to the conclusion that broad community prosperity lies in: 1) recognizing that growth alone does not naturally lead to opportunity; and 2) advancing deliberate policies, investments, and programs that connect growth to opportunity. Tour participants observed that without the action of organizations like placed-based funders, that connection rarely occurs.
Given the common narratives emerging from the study tour and the dual arcs framework for evaluating place-based revitalization, participants in the tour put forward a short, non-exhaustive, list of conclusions for funders.
Patient capital builds local capacity.
The time horizons of community revitalization require capital that seeks both social impact and financial return over a longer term. Place based funders are uniquely positioned to address the long time horizon that this work dictates, and the resources they control may be critical aspects in its acceleration or deceleration.
State policy often limits the flexibility and authority of local leaders to connect the arcs of growth and opportunity.
Funders can take an active role in identifying those policy bottlenecks or opportunities that facilitate more positive local action toward connecting growth to opportunity. Place-based funders can be catalytic change agents for both policy and practice without engaging in lobbying.
Jurisdictional authorities dictate policy to connect the growth and opportunity arcs.
The levers of power and resource allocations accorded to any number of public or pseudo-public authorities have a significant, often negative, impact on the efficacy of efforts to connect the dual arcs. Funders can take an active role in helping to identify and break down or circumnavigate local jurisdictional boundaries that prevent positive action and facilitate alignment toward common goals.
Effective marketing and communication advances positive momentum.
Maintaining a steady cadence on the long-term mission of community revitalization often falls to place-based leaders. In most cases we examined, the local community foundation or another place-based funder had a role in funding or otherwise supporting the narrative of a community’s recovery, articulating a common, inclusive vision of what is possible.
Accountability for distribution of benefits from growth is the linchpin for connecting the arcs.
Cities around the country (including the four visited) have revitalized in various ways over the last several decades. But, outcomes of that growth have left many behind. Place-based funders should be strategic in holding local stakeholders accountable for connecting the growth and opportunity arcs.
Despite the challenges of connecting the arcs, local place-based foundations in the four cities studied played a lead role as a funder, convener or ‘steward’ of revitalization efforts that employed a variety of approaches or “tools” to bridge growth and opportunity, which may be valuable to other communities. These tools were observed within a local context, and were often part of a broadly articulated plan or vision, suggesting that while tools are helpful, the environment in which they are most likely to succeed is also important.
- Addressing concentrated poverty by place: Interventions in this category were geographically targeted, but multi-faceted and cross-generational. Distressed neighborhoods that were located near resources – for example transportation or a good school – were seen as good places to start.
- Addressing concentrated poverty through policy: Interventions in this category were explicit in channeling more gains from growth to opportunity through local policy, either by removing barriers or being prescriptive in the intentional distribution of benefits.
- Revitalizing downtown with greater attention to preserving and increasing affordable housing: Investments in making communities more attractive by building downtown entertainment or “innovation” districts and increasing desirable amenities, raised property values but also increased living costs. Funders and other local partners recognized the need for more affordable, family friendly housing options near emerging employment opportunities.
- Business recruitment led by business retention: Community economic growth strategies focused on strengthening existing businesses by recruiting businesses in their supply chain, placing retention and success of existing business as a higher priority than traditional recruitment, alone. Coordinated workforce development was often key to this strategy.
- Developing leaders: Concern about where the next two generations of leaders will come from and how they will support broad-based collaborative efforts prompted attention to formal and informal leadership development efforts. Strong leaders in business, government, and nonprofits are critical to building a regional approach to both arcs.
- Evidence-based decision making: Data has played an important role in many of the cities visited. Data should be publicly available and granular enough to support neighborhood level understanding, as well as robust enough to present an aggregated, comprehensive city – or MSA-wide – profile.
While local dynamics dictate the timing, sequence, and particularities of the interplay between growth and opportunity strategies, this study concludes that revitalization efforts that recognize the dual arcs of growth and opportunity and plan for their meaningful integration are more likely to yield robust and lasting long-term results. Because place-based funders are so integrally linked to the history and prospects of the communities they serve, they have unique roles and responsibilities not only as funders, but as local institutions and innovators to make these linkages across place and time.
Map and population of study tour cities

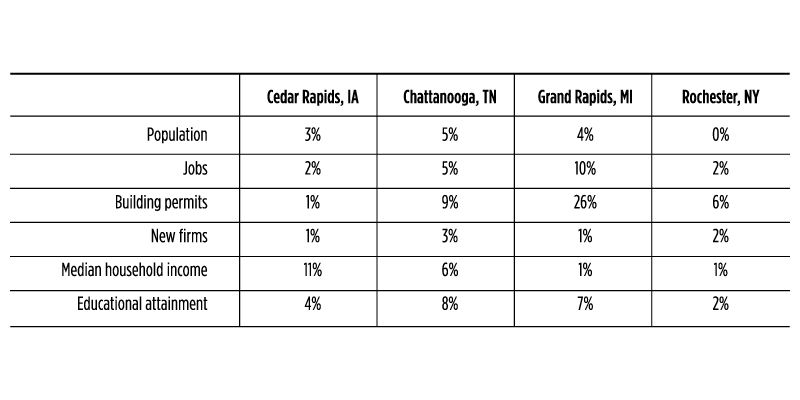
Table 1. Post-recession economic revitalization trends in select cities
Site selection and process
Four cities were selected for the study tour: Chattanooga, TN; Cedar Rapids, IA; Rochester, NY; and Grand Rapids, MI. Two of these are located within the Federal Reserve’s Seventh District. Cities were selected based on these rough criteria:
-
following a significant loss of population and economic activity, some level of post-recession revitalization as reflected in population, jobs, building permits, firm creation, household income, and/or educational attainment (see table 1);3
-
an economy dominated previously by a single company or closely tied industrial sector that has declined;
-
existing research, media or documentation available to support a narrative of recent economic revitalization; and
-
hosts in the community to assist in facilitating visits and provide background information.4
Local conversations took the form of interviews and small group/panel discussions to enable candid discussions about the arc of each city’s revitalization, the fits and starts, and the ramifications – both positive and negative – of decisions that were made along the way. Site visits were roughly similar and included meetings with elected officials; city planning officials; community groups; philanthropic, business, and civic leaders; emerging leaders; and off-the-record discussions with media, community colleges, and regional planning agencies. Site visits were short (36 hours) and admittedly provided only a snapshot that was not intended to result in understanding a ‘complete’ city, but to provide a comparative baseline across communities. An interview protocol, informed by the work of Alan Mallach, was developed to guide local conversations.5
'Dual arcs' of revitalization
The study tour began as an exploration of why some small legacy cities have rebounded from economic decline in the post Great Recession timeframe while others have not. It was informed by earlier work, which led us to ask: “Is there an ‘arc of recovery’ that can be observed across several cities that appear to be rebounding?” The concept of an arc was seen as being distinct from a formula as advocated by many in the period of urban renewal. The work began with an assumption that no single approach would lead to comprehensive community revitalization in every local setting. The metaphor of an ‘arc’ also allowed that different places could be at different points along a spectrum of revitalization.
Early on in the study tour, a divided pattern of progress became evident. A starting assumption was that an “arc of growth” – as measured by increasing population, jobs, building permits, firm creation, household income, and education attainment – was an appropriate construct through which to understand the overall trajectory of a community. Places that are moving along a trajectory with positive economic growth, was the line of thinking, and should also be places where that growth translates into opportunity. A corresponding assumption was that the Great Recession timeframe (changes in the local economy between approximately 2008 and 2014) was sufficient to assess revitalization for the purposes of selecting cities for this inquiry.
What was observed is that the broad indicators of growth – population, employment, and income per capita – often fail to translate into improved opportunities for populations traditionally marginalized from the mainstream economy; assessing revitalization also necessitated a much longer time horizon. Based on the visits, the ‘dual arcs’ of revitalization in terms of economic growth and opportunity emerged, recognizing that economic growth is necessary but not sufficient for sustained, broad-based community revitalization.
While the study tour was not designed to produce a definitive set of metrics for each arc, the age-old metaphor of the “economic pie” seems to apply. The growth arc is manifest primarily by changes in the size of the pie, while the opportunity arc is represented by the size and distribution of its slices. The arc of growth might be measured by, among other things, the long-term trajectory of a place in terms of changes in population, employment, and personal income. While the magnitude of change may be different, figure 1 demonstrates that each city on the study tour largely improved across these growth metrics over the last 30 plus years.
On the other hand, the arc of opportunity could be assessed by examining factors such as housing affordability, poverty, and unemployment. Figures 2-5 are included for illustrative purposes to demonstrate the challenges of intersecting the arcs. For example, figure 2 indicates that while each city on the study tour and the US as a whole have experienced increases in unemployment (blue bars), the magnitude of the increases in poverty (red bars) suggests that something other than unemployment is affecting family poverty levels. Figure 3 offers another perspective: the disconnect between rising home values (red bars) and lagging incomes (blue bars) resonates nationwide. Figures 4 and 5 illustrate the challenge through other lenses and indicate that increases in population can be challenging to correlate with increases in jobs, especially following an economic downturn. However, in the cities we visited, the divergence is more pronounced. As can be observed, while growth metrics have been largely positive, opportunity as measured by housing affordability and poverty have trended largely in a negative direction. To complete the metaphor, in these cities (and in many other parts of the United States), the pie has grown while its slices have been thinning for many parts of the community.
Figure 1. Select growth metrics in study tour cities (1980-2014)
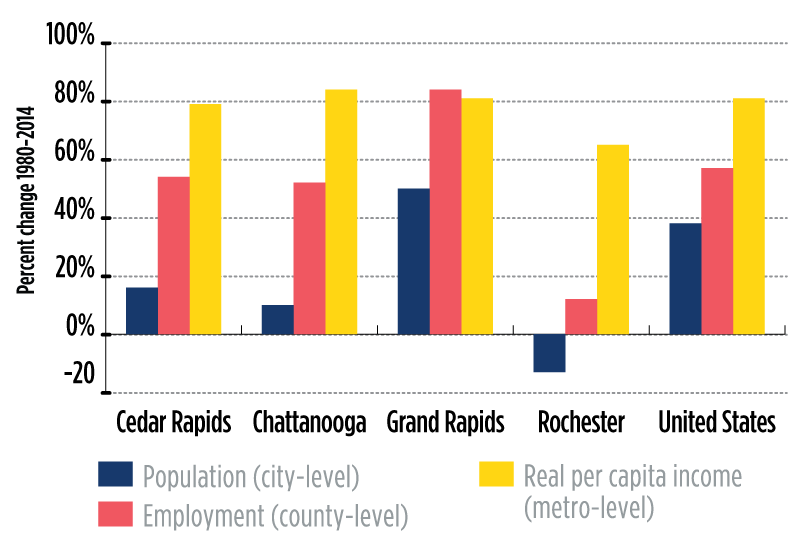
Figure 1 indicates that each city on the study tour largely improved across growth metrics from 1980 to 2014.
Figure 2. Change in unemployment/change in poverty (1980-2014)
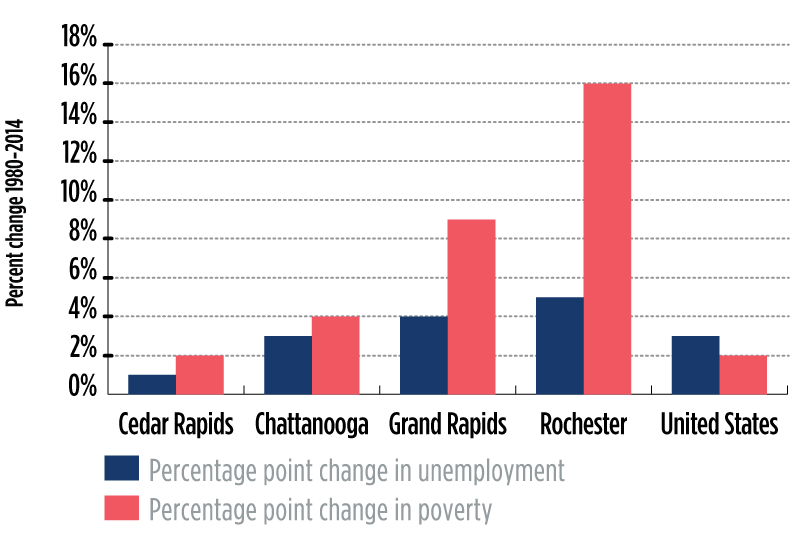
Figure 2 illustrates changes in the poverty rate since 1980 and changes in the unemployment rate over the same time period. The conclusion is that while unemployment (blue bars) has trended at or near national levels across the four cities, poverty (red bars) has trended significantly higher, indicating that job creation may not always be the primary factor in alleviating persistent poverty.
Figure 3. Change in median family income/change in home values (1980-2010)
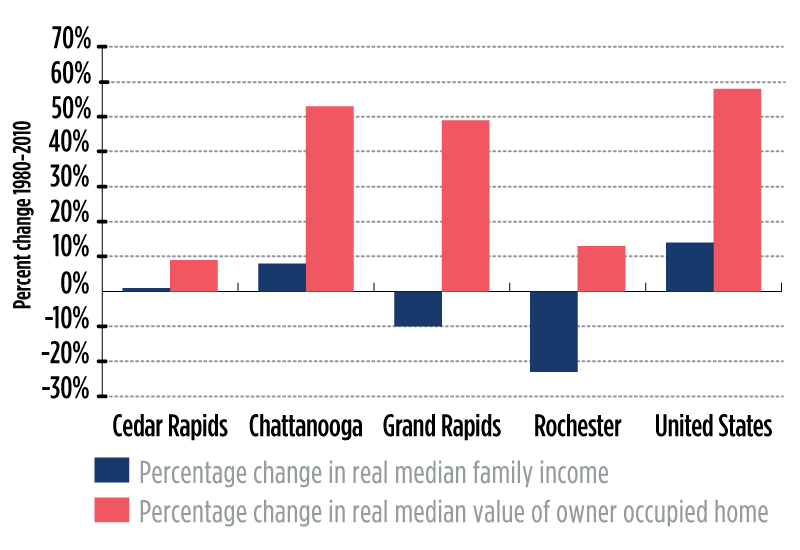
Figure 3 illustrates changes in median family incomes since 1980 and changes in median home values over the same time period. The conclusion is that changes in median family incomes (blue bars) have not kept pace with national levels, while changes in median family home values (red bars) vary widely, indicating affordability challenges in some places.
Figure 4. Population index (2000-2014)

Figure 4 compares population growth since 2000 by indexing to 100. The trajectories of the four cities are featured, as are those of the United States as a whole, as well as just “urbanized areas.” The graph illustrates how population growth trends in the four cities differ from the country as a whole, as well as other cities.
Figure 5. Jobs index (2000-2014)

Figure 5 compares job (number) growth since 2000 by indexing to 100. The trajectories of the four cities are featured, as are those of the United States as a whole, as well as just “urbanized areas.” The graph illustrates how job growth trends across the four cities have followed both similar and divergent paths, and certainly have not followed population trends.
The most salient manifestation of the disconnect between the two arcs is a city with both increasing population and employment and increasing poverty levels, or increasing household income and an increasing share of residents who struggle to afford housing. In some parts of the cities on the study tour, civic leaders were heavily invested in creating an environment attractive to millennials and families alike, trying to stimulate economic growth with nightlife, grocery stores, bike lanes, and other sought-after amenities. In other parts of these same cities, long-term residents lived in virtual isolation from growth efforts, where aging housing and lagging schools foretold more of the same for their children. To be sure, these conditions are not unique to the four cities visited, but the dilemma was noted by residents and leaders alike.
If communities are to prosper and that prosperity is to be broadly shared, the growth arc and the opportunity arc must intersect. Leadership across the communities we visited presented differing views on the interplay of growth and opportunity. One perspective is that the benefits of growth will eventually extend to all residents. An opposing perspective is that opportunity creation must take precedence. The optimal approach most likely lies in striking a balance between the pursuit and creation of growth, with effort focused on ways to share prosperity.
Conclusion
Although diverse, the four cities visited for this study are by no means unique. They share a common narrative of crisis and recovery, challenged by chronic socioeconomic distress but bolstered by a spirit of resilience and civic pride honed over decades. New leadership is still emerging in all four places, but demonstrates enthusiasm and innovation as it waits for the right time and space to make its mark. Each place also benefits profoundly from a ‘community champion’ in the form of a community or private foundation that works alongside and among an array of community partners.
As a result of the site visits summarized in this report and informed by prior work done by various Reserve Banks and the Fund for Our Economic Future in Northeast Ohio, it is the consensus opinion of the contributors to the report that, if communities continue to pursue the arcs of growth and opportunity as separate strategies, they will continue to struggle to restore broad-based prosperity in their communities. If the goal is to help these proud communities restore greater prosperity for their residents, place-based funders are uniquely positioned to help move their communities in the right direction by deliberately forcing the two arcs of growth and opportunity to intersect and interact more strategically.
This is not to suggest that funders undertaking the difficult work of revitalization must enact growth and opportunity strategies in equal measure along exactly the same timeline. The study was not designed to determine how best to sequence growth and opportunity initiatives to maximize revitalization potential, if such a determination were even possible. As the experience of these and other legacy cities undergoing revitalization has demonstrated, an initial focus on downtown redevelopment can provide the needed momentum to both spur a virtuous cycle of reinvestment and to reshape the public mindset around a narrative of change and renewal. However, efforts that fail to incorporate inclusionary measures such as affordable housing provision and low-cost transit and mobility options, or that begin and end with physical redevelopment are unlikely to unlock the full potential of local and regional economic growth. Where the goal is resilient, long-term prosperity, place-based revitalization requires intentional investment that connects education, workforce, and other strategies designed to maximize human capital in struggling cities with broader business and economic development initiatives. While the dynamics at play within any given community will dictate the timing, sequence, and particularities of the interplay between growth and opportunity strategies, the larger lesson of this study is that neither a growth nor an opportunity approach is likely to be successful in the absence of the other. Revitalization efforts that recognize these dual arcs of development and plan for their meaningful integration are more likely to yield robust and lasting results.
Because place-based funders are so integrally linked to the history and prospects of the communities they serve, they have unique roles and responsibilities not only as funders, but as local institutions and innovators. In concluding this essay, the authors of the report urged place-based funders to do the following:
- Be patient and help to guide projects with a long-time horizon, potentially over decades rather than years.
- Inform both questions and answers with data
- Stand behind difficult choices. There is never enough money to do everything. Place-based funders must be resolute (and informed) in their commitments, and able to say, "Not yet."
- Stay on message. In times of crisis – and even in times of economic stability – place-based funders can be the keepers and articulators of a vision of possibility for their communities.
- Finally, continually ask “for whom?” to ensure that leadership and decision-making bodies are truly representative of the entirety of the community served. In a global economy, competition takes place on a regional level; philanthropies (that often bear the names of the places they serve) are uniquely positioned to “call the equity question,” ensuring that all residents share in the benefits of new opportunities.
Comprehensive community revitalization in economically distressed cities is a long undertaking that requires the vision and fortitude to unremittingly bend the arcs of growth and opportunity toward one another. We hope that this report offers some measure of encouragement and support to funders to embrace the challenge of uniting these arcs for the betterment of both the people and the places they serve.
1 The full report can be accessed at https://chicagofed.org/region/community-development/community-economic-development/looking-for-progress-report.
2 One of the primary audiences for this publication is what are commonly referred to as 'place-based funders,' e.g., community foundations or other philanthropic efforts focused on a specific place. However, the findings may also be of interest to other individuals and entities with a (financial) commitment to a targeted geography.
3 We note, however, that comparing data across places and across time masks intra-time highs and lows and does not allow for full consideration of place-specific events, such as the effects of the 2008 flood in Cedar Rapids, IA.
4 In each city selected for the study tour, a local host assisted with planning, organization, and logistics. Hosts included the Lyndhurst Foundation in Chattanooga, TN; the Greater Cedar Rapids Community Foundation in Cedar Rapids, IA; the Rochester Area Community Foundation, the Farash Foundation, and the United Way of Greater Rochester, all in Rochester, NY; and the Grand Rapids Community Foundation in Grand Rapids, MI.
5 See, for example, Mallach, A., 2012, “In Philadelphia’s Shadow: Small Cities in the Third Federal Reserve District, A Special Report by the Community Development Studies and Education Department,” Federal Reserve Bank of Philadelphia; and Mallach, A., 2014, “Out of the Shadow: Strategies for Change in Small Postindustrial Cities, A Special Report by the Community Development Studies and Education Department,” Federal Reserve Bank of Philadelphia.


